. 2023;15(4):841-867.
doi: 10.1016/j.jcmgh.2022.12.005. Epub 2022 Dec 13.

Fibroblast Activation Protein Activates Macrophages and Promotes Parenchymal Liver Inflammation and Fibrosis

Affiliations

Fibroblast Activation Protein Activates Macrophages and Promotes Parenchymal Liver Inflammation and Fibrosis

Ai-Ting Yang et al. Cell Mol Gastroenterol Hepatol. 2023.

Abstract

Background & aims: Fibroblast activation protein (FAP) is expressed on activated fibroblast. Its role in fibrosis and desmoplasia is controversial, and data on pharmacological FAP inhibition are lacking. We aimed to better define the role of FAP in liver fibrosis in vivo and in vitro.

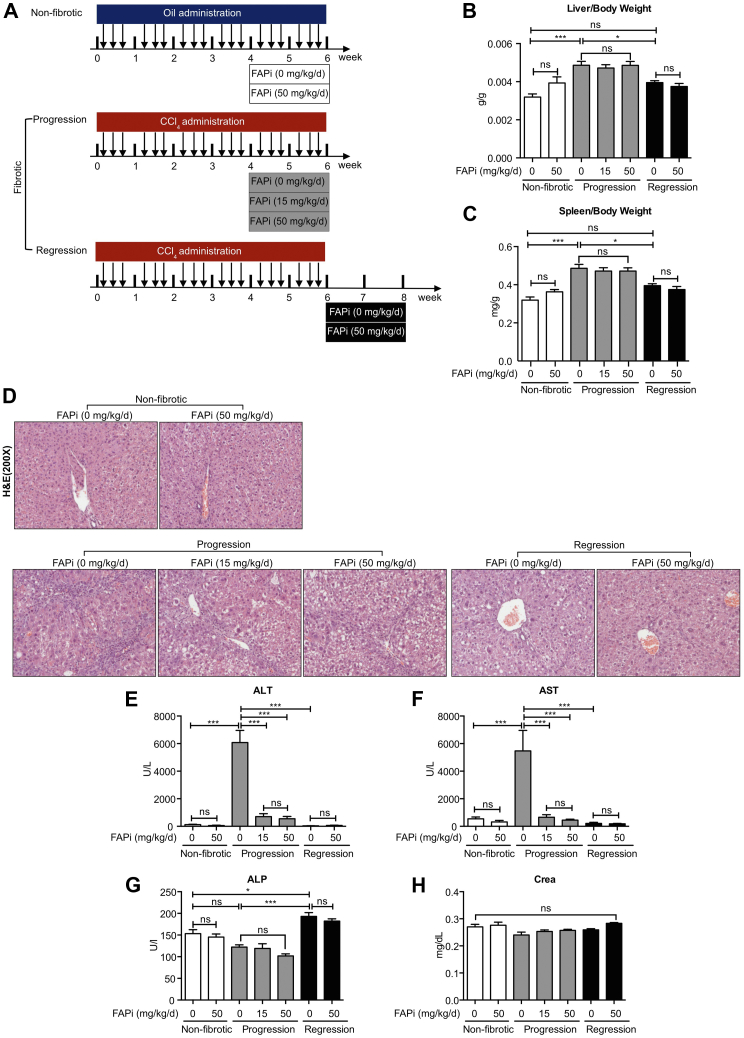
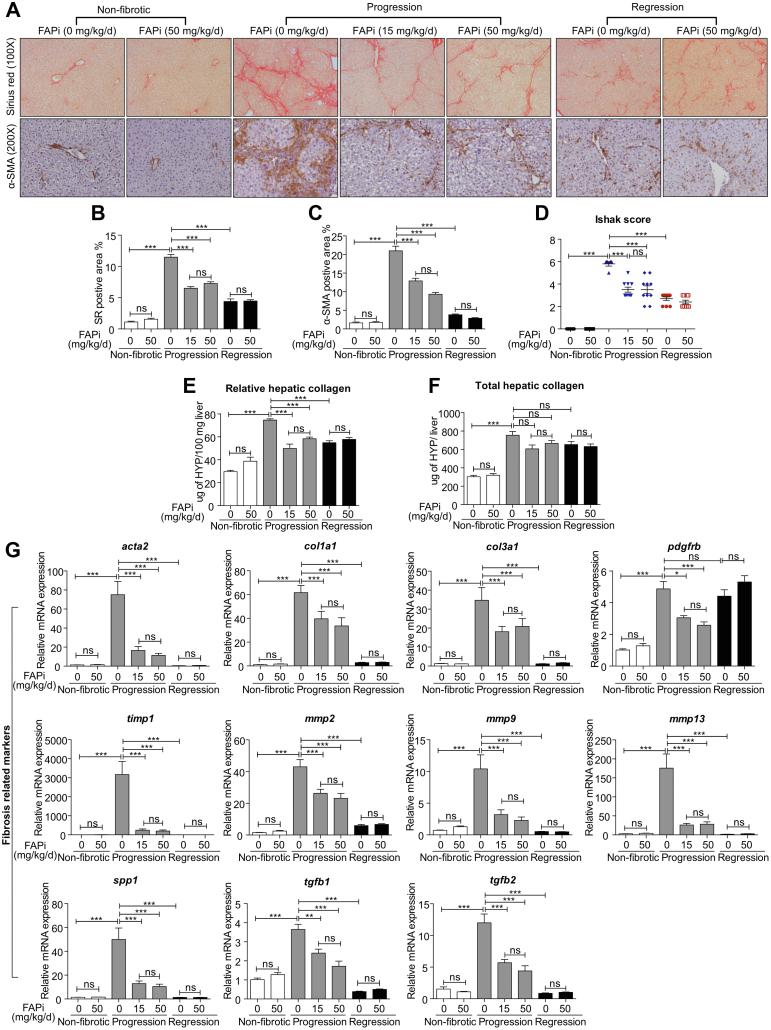
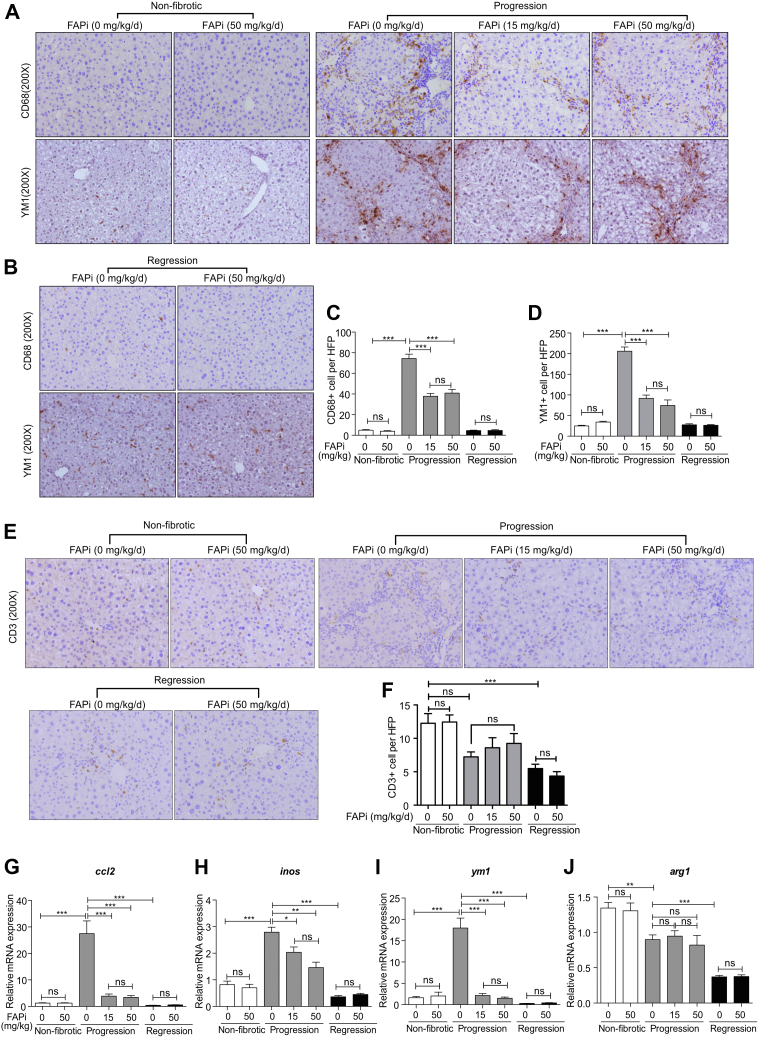
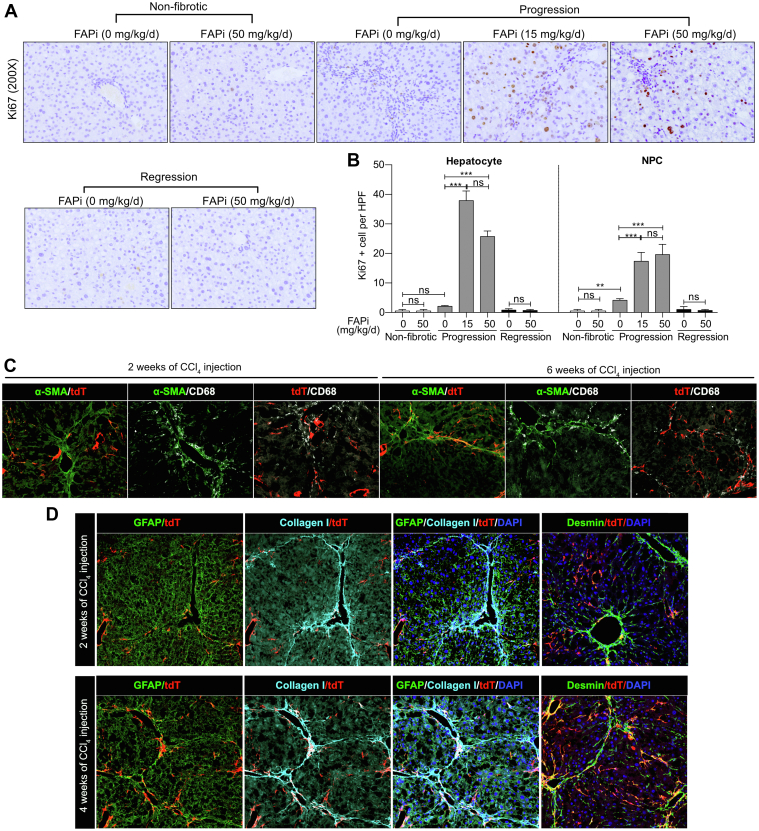
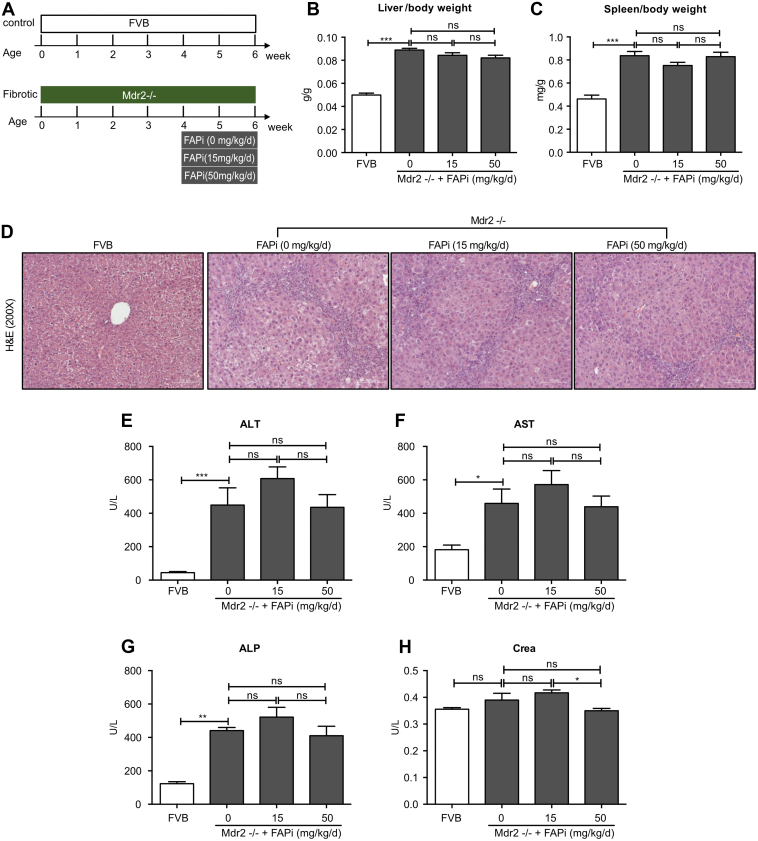
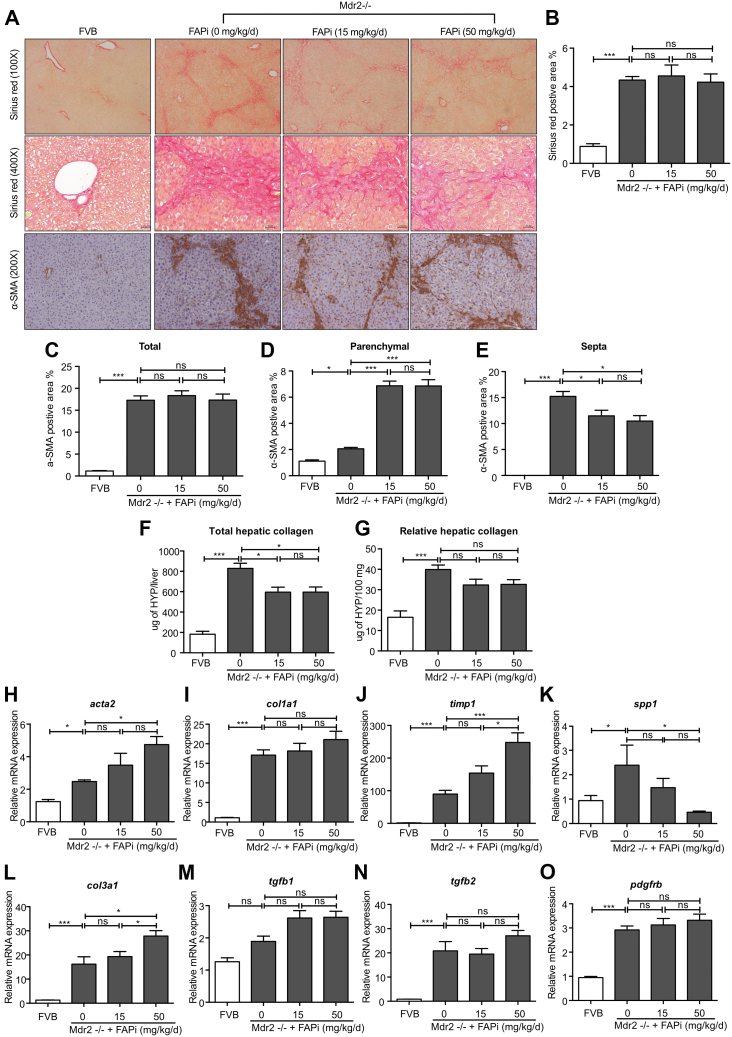
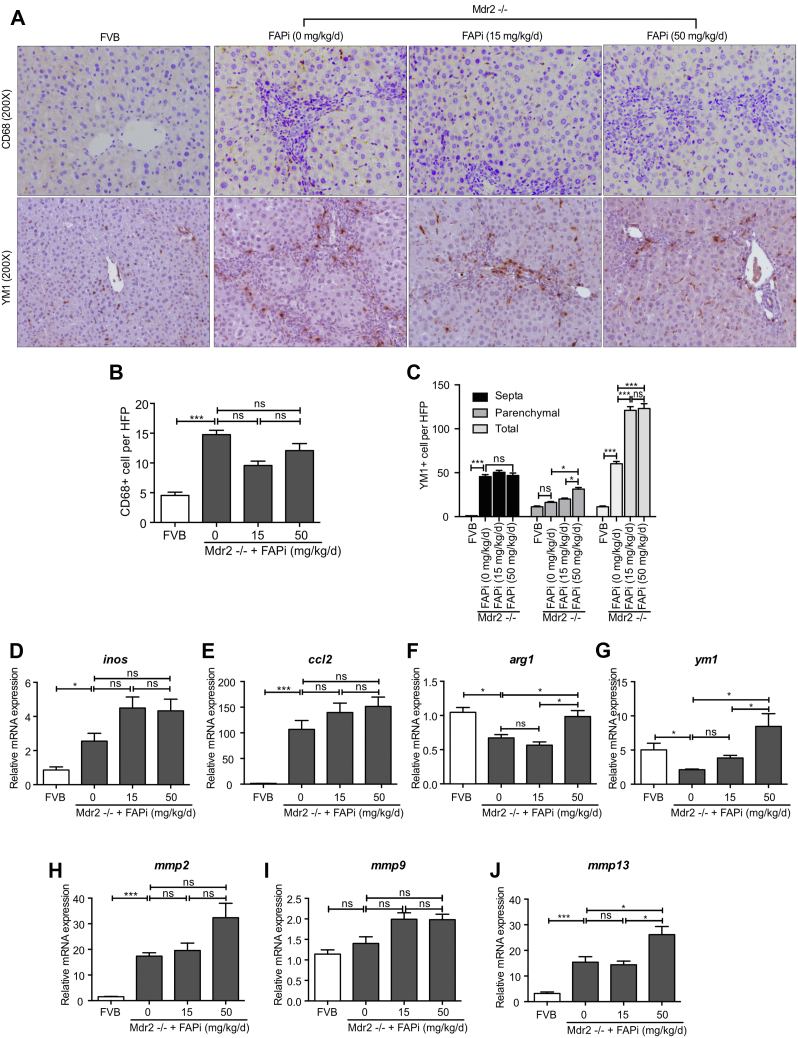
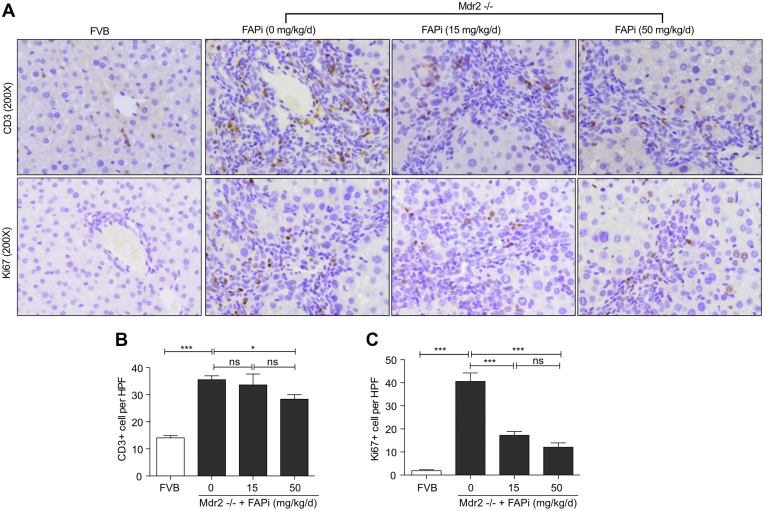
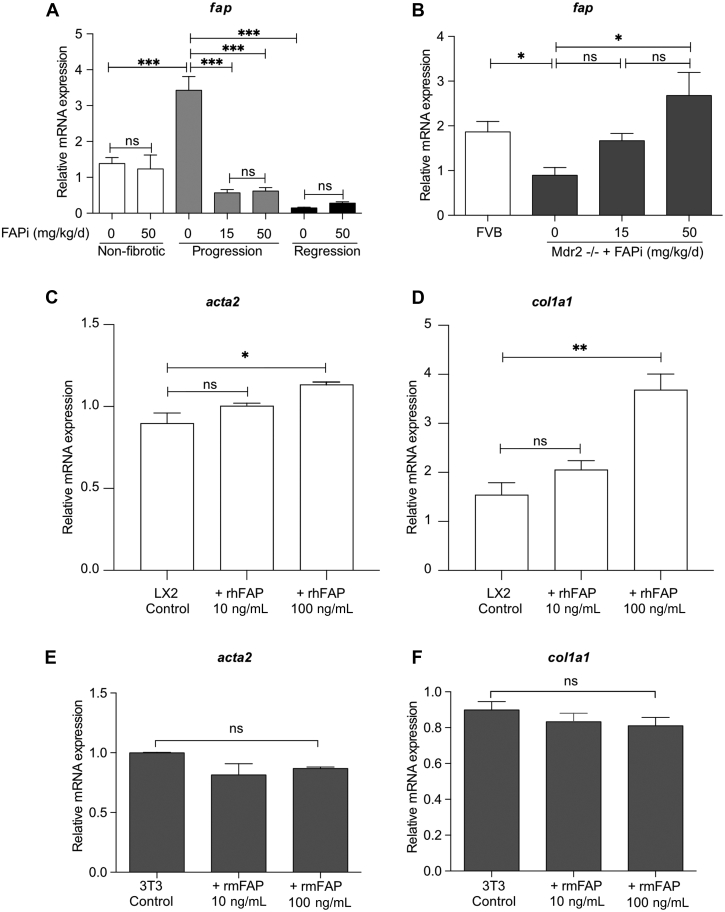
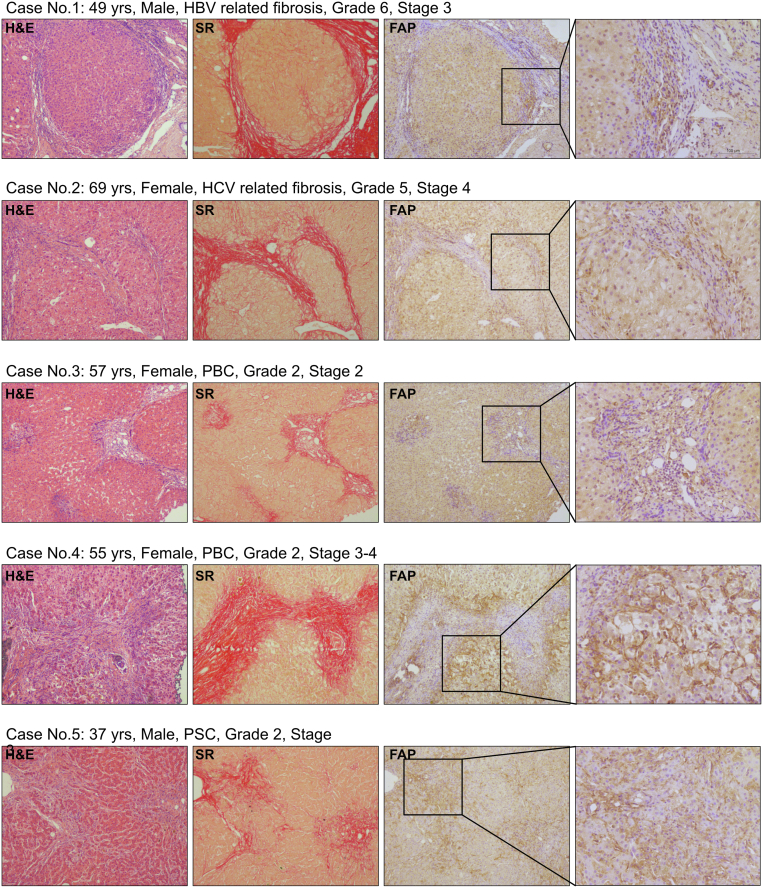
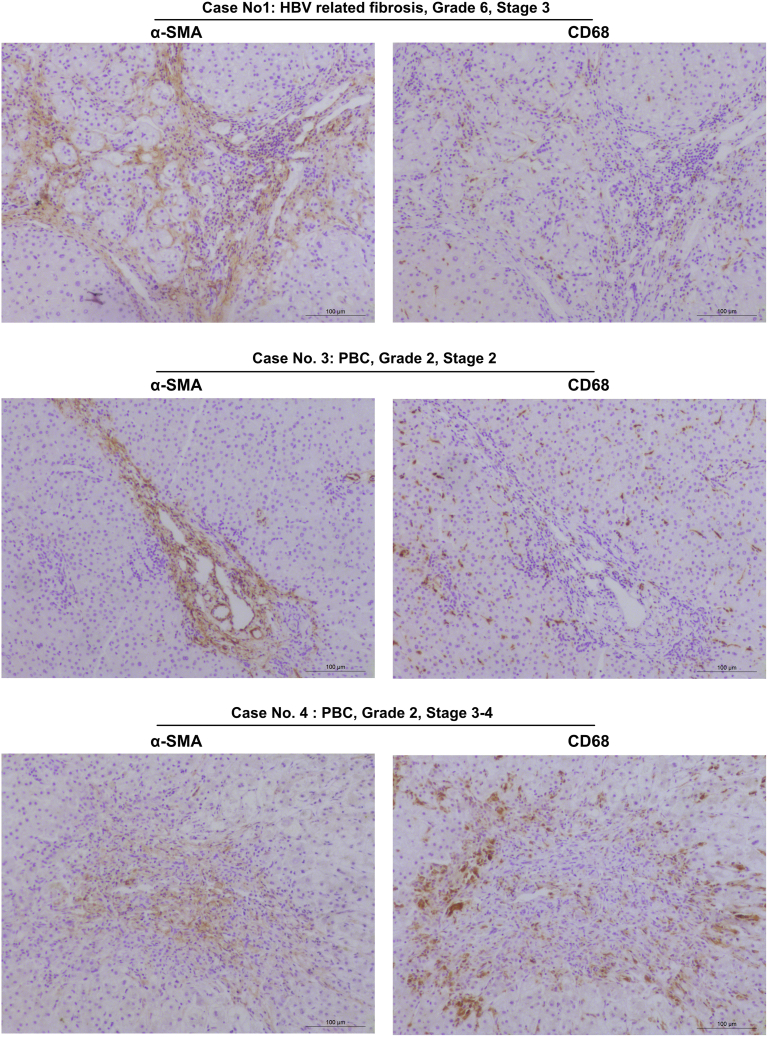
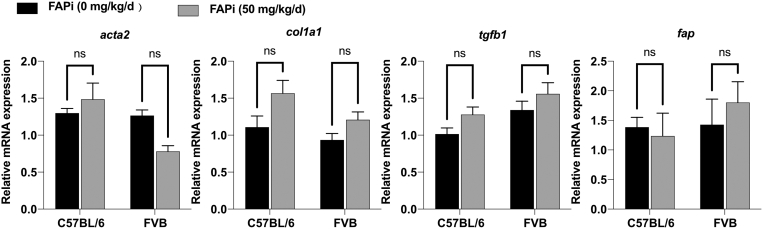
Methods: FAP expression was analyzed in mice and patients with fibrotic liver diseases of various etiologies. Fibrotic mice received a specific FAP inhibitor (FAPi) at 2 doses orally for 2 weeks during parenchymal fibrosis progression (6 weeks of carbon tetrachloride) and regression (2 weeks off carbon tetrachloride), and with biliary fibrosis (Mdr2-/-). Recombinant FAP was added to (co-)cultures of hepatic stellate cells (HSC), fibroblasts, and macrophages. Fibrosis- and inflammation-related parameters were determined biochemically, by quantitative immunohistochemistry, polymerase chain reaction, and transcriptomics.

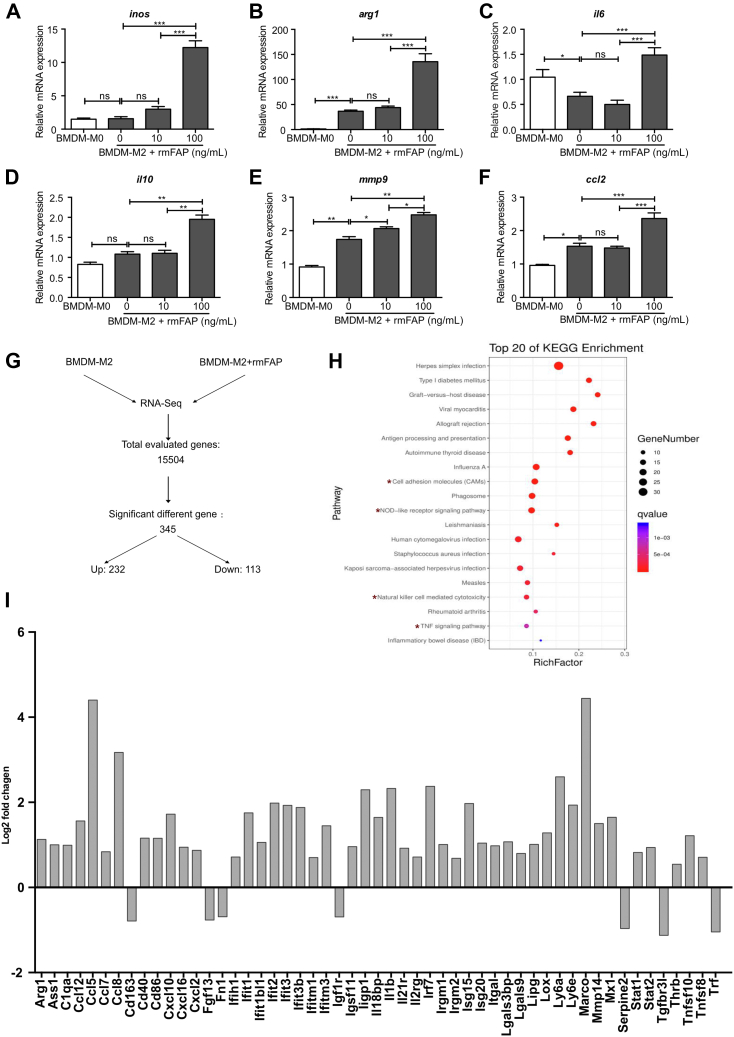
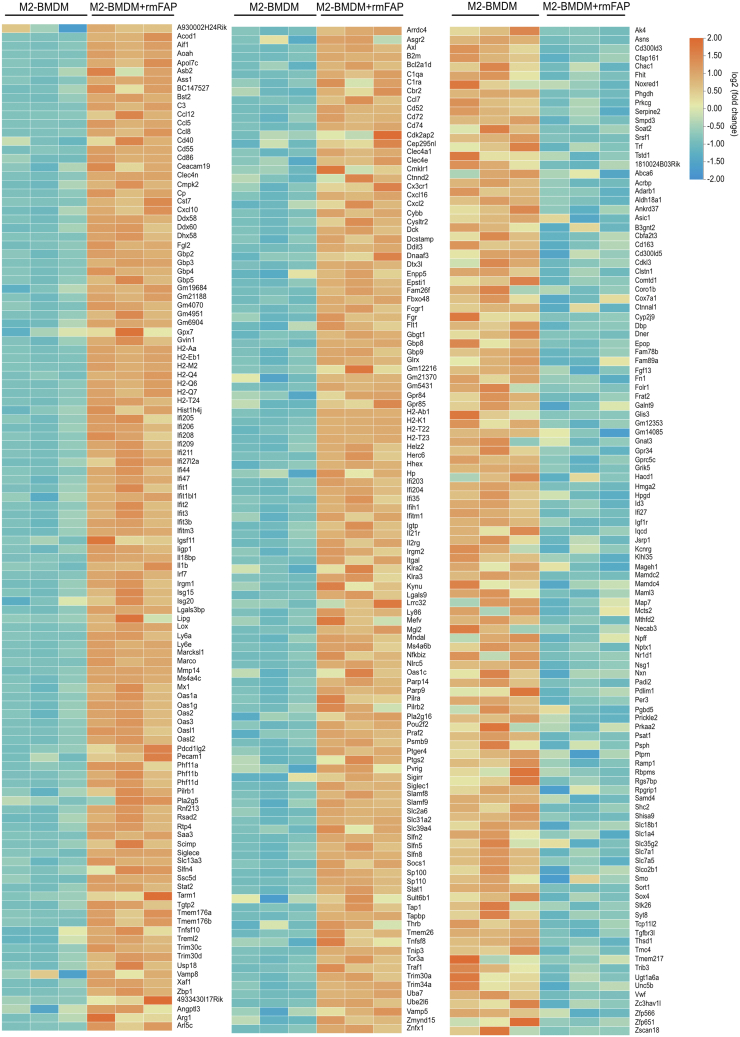
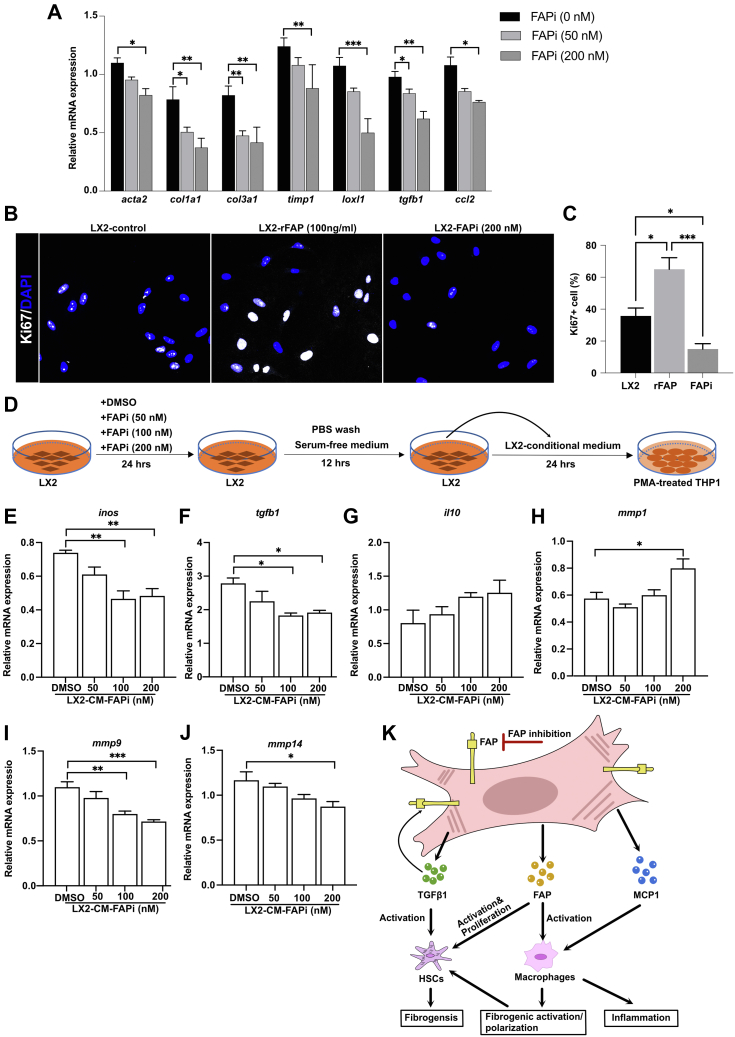
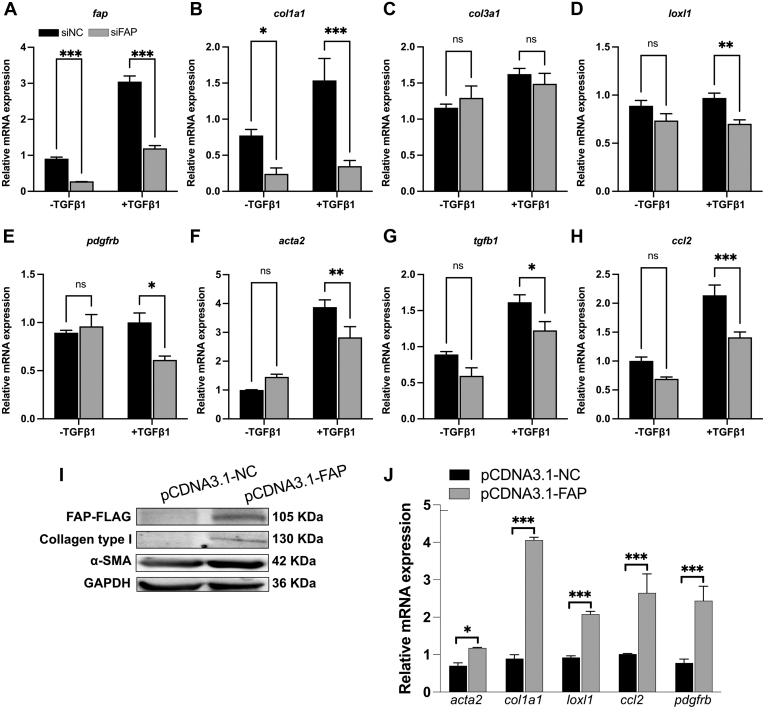
Results: FAP+ fibroblasts/HSCs were α-smooth muscle actin (α-SMA)-negative and located at interfaces of fibrotic septa next to macrophages in murine and human livers. In parenchymal fibrosis, FAPi reduced collagen area, liver collagen content, α-SMA+ myofibroblasts, M2-type macrophages, serum alanine transaminase and aspartate aminotransferase, key fibrogenesis-related transcripts, and increased hepatocyte proliferation 10-fold. During regression, FAP was suppressed, and FAPi was ineffective. FAPi less potently inhibited biliary fibrosis. In vitro, FAP small interfering RNA reduced HSC α-SMA expression and collagen production, and FAPi suppressed their activation and proliferation. Compared with untreated macrophages, FAPi regulated macrophage profibrogenic activation and transcriptome, and their conditioned medium attenuated HSC activation, which was increased with addition of recombinant FAP.

Conclusions: Pharmacological FAP inhibition attenuates inflammation-predominant liver fibrosis. FAP is expressed on subsets of activated fibroblasts/HSC and promotes both macrophage and HSC profibrogenic activity in liver fibrosis.

Keywords: Antifibrotic Therapy; Fibroblast Activation Protein (FAP); Hepatic Stellate Cell; Liver Fibrosis; Macrophage.


Figures

Figure 1
Figure 1
Treatment of CCl4-fibrotic mice with FAP inhibitor. (A), Scheme of experimental design. Female C56BL/6 mice received escalating doses of oral CCl4 in mineral oil (fibrotic group, n = 10) or mineral oil alone (non-fibrotic controls, n = 5) for 6 weeks. Fibrotic mice were analyzed at peak progression or after 2 weeks of regression. Other groups of fibrotic mice continued with their chow were set on chow containing FAPi at 15 or 50 mg/kg/d (n = 10 per group). (B–C), Liver/bw ratio and spleen/bw ratios. (D), Representative images of H&E-stained liver section of each group. (E–H), Serum ALT, AST, ALP, and creatinine levels. Data in (B–C, E–H) are presented as means ± standard error of the mean (SEM). Statistical analysis was performed by 1-way analysis of variance followed by Tukey’s post hoc test (∗P < .05; ∗∗P < .01; ∗∗∗P < .005; ns, not significant).
Figure 2
Figure 2
FAP inhibition attenuates parenchymal liver fibrosis. (A–C), Livers of mice (n = 5–10/group) treated with FAPi during fibrosis progression or regression vs fibrotic untreated controls were analyzed by quantitative Sirius red and α-SMA immunohistochemistry, performed in 10 random high-power fields per mouse using ImageJ software. (D), Histological fibrosis score of liver sections. (E–F), Hepatic hydroxyproline concentration. (G), Hepatic transcript of fibrosis related transcripts. Data in (B–G) are means ± standard error of the means (SEMs). Statistical analysis was performed as for Figure 1.
Figure 3
Figure 3
Effect of FAP inhibition on hepatic inflammation in CCl4-induced fibrosis. (A–D), Livers from non-fibrotic mice and mice with fibrosis progression or regression (n = 5–10/group) treated with FAPi and controls were analyzed for macrophage markers CD68 and YM1 using immunohistochemistry in 10 random high-power fields per liver. (E–F), Representative images and quantification of CD3+ T cells in 10 random fields (×200) from the central right lobe of each liver. (G–J), Hepatic transcript levels of inflammation related genes. Data in (C–D, F, G–J) are means ± standard error of the means (SEMs). Statistical analysis was performed as for Figure 1.
Figure 4
Figure 4
FAP inhibition increases hepatocyte and nonparenchymal liver cell proliferation in CCl4-induced fibrosis. (A–B), Representative images of Ki67 expressing cells and morphometrical quantification in 10 random high-power fields per liver. (C), Co-localization of FAP+ fibroblasts, α-SMA+ (myo-)fibroblasts, and CD68+ macrophage in livers of mice with CCl4-induced fibrosis. (D), Co-localization of FAP+ fibroblasts with type I collagen, GFAP-, and desmin-positive HSCs and (myo-)fibroblasts in livers of mice with CCl4-induced fibrosis. Data are presented as means± standard error of the means (SEMs) (n = 5 mice per non-fibrotic, and n = 10 mice per fibrotic subgroups). Statistical analysis was performed as for Figure 1.
Figure 5
Figure 5
Effect of FAP inhibition on liver/spleen weight and general liver inflammation in Mdr2−/− mice. (A), Scheme of FVB control and Mdr2−/− biliary fibrotic mice (n = 5 and n = 10 mice per group, respectively) treated with FAPi (15 or 50 mg/kg bw) or vehicle for 2 weeks. (B−C), Liver/bw ratio and spleen/bw ratio. (D), Representative images of H&E staining from liver sections. (E−H), Serum ALT, AST, ALP, and creatinine levels. Data in (B−C, E−H) are means ± standard errors of the mean (SEMs). Statistical analysis was performed as for Figure 1.
Figure 6
Figure 6
FAP inhibition attenuates hepatic fibrosis in Mdr2−/− mice. (A–E), Livers of nonfibrotic FBV control and biliary fibrotic Mdr2/ mice (n = 5–10/group) were treated with FAPi (15 or 50 mg/kg/d) for 2 weeks and compared with respective untreated mice. Sirius red stained area and α-SMA-expressing cells in the parenchymal vs septal areas were assessed by quantitative morphometry in 10 high-power fields. (F–G), Total and relative hepatic hydroxyproline concentration. (H–O), Hepatic transcript levels of fibrosis related genes. Data in (B–O) are presented as means ± standard error of the means (SEMs). Statistical analysis was performed as detailed in Figure 1.
Figure 7
Figure 7
Effects of FAP inhibition on hepatic inflammation in Mdr2−/− mice. (A–C), Livers of control and Mdr2/ fibrotic mice (n = 5–10/group) treated with FAPi as in Figure 5 were assessed for numbers of CD68 and YM1 expressing macrophages in 10 random high-power fields per mouse. (D–J), Hepatic transcript levels related to macrophage activation, polarization, and MMP expression were determined by qPCR. Data in (B–J) are presented as means ± standard error of the means (SEMs). Statistical analysis was performed as detailed in Figure 1.
Figure 8
Figure 8
FAP inhibition does not modify T cell infiltration and suppresses cell proliferation in Mdr2−/− mice. (A–C), Representative images and quantification of CD3- and Ki67-positive cells in 10 random fields (×200) from the central right lobe of each liver. Data in (B–C) are means ± standard error of the means (SEMs). Statistical analysis was performed as detailed in Figure 1.
Figure 9
Figure 9
FAP expression in CCl4and Mdr2−/− fibrotic livers with/without FAP inhibition and effect of rhFAP/rmFAP on LX-2 HSCs and murine fibroblasts. (A–B), Transcript levels of fap. (C–D), Effect of treatment with rhFAP on LX2 HSCs activation and collagen gene expression. (E–F), Effect of treatment with rmFAP on NIH/3T3 fibroblast activation and collagen gene expression. Data in (A–F) are means ± standard error of the means (SEMs). Statistical analysis was performed as detailed in Figure 1.
Figure 10
Figure 10
Effect of rmFAP on M2-type macrophage polarization and gene expression. (A–F), M0 (unpolarized)-BMDMs and M2-type BMDMs were treated with rmFAP (0–100 ng/mL, 48 hours), and macrophage activation/polarization relevant transcript levels were analyzed by qPCR. (G), RNA-Seq results in M2-BMDMs treated with 100 ng/mL rmFAP vs untreated M2-BMDMs. (H), Scatter plot for Kyoto Encyclopedia of Genes and Genomes enrichment analysis of the differentially expressed genes. Top 20 significantly enriched pathways (P < .05 by the Fisher exact test) are shown. (I), Log2-fold change of selected genes in M2-BMDMs treated with rmFAP (vs untreated M2-BMDMs). Data in (A–F) as means ± standard error of the means (SEMs). Statistical analysis was performed as detailed in Figure 1.
Figure 11
Figure 11
Gene expression profiling by RNA-seq analysis of M2-polarized BMDMs with or without rmFAP treatment. Heatmaps of differentially expressed genes (differentiated as up- or downregulated by adjusted q-values <0.05 and ≥1.5 fold-change) in M2-BMDMs with vs without rmFAP treatment. Fragments per kilobase of transcript, per million mapped reads (FPKM) values were used to calculate the expression level by fold change of mRNA between the M2-BMDM and M2-BMDM+rmFAP groups, expressed as log2 (fold change) values. Differentially expressed genes (DEGs) between the M2-BMDM and M2-BMDM+rmFAP groups were identified using the Student t test. Orange color marks up-regulated and blue color down-regulated genes compared with the untreated M2-BMDM group. Side bar: X-fold change.
Figure 12
Figure 12
FAPi-treated LX2 HSC modulate macrophage activation and polarization in vitro. (A), Expression of acta2, col1a1, col3a1, timp1, loxl1, tgfb1, and ccl2 in LX2 HSC treated with FAPi. (B–C), Immunofluorescent staining for Ki67 and DAPI in LX2 cells treated with rhFAP and FAPi. (D), Scheme of the experimental design of LX2 CM being added to THP1 cell-derived macrophages. (E–J), Expression of inos, tgfb1, il10, mmp1, mmp9, and mmp14 in PMA-treated (macrophage) THP1 cells after addition of culture medium from LX2 HSC pretreated with and without FAPi. (K), Working model of FAP and FAPi action during liver fibrogenesis. FAP upregulates HSC fibrogenic activation and proliferation and promotes macrophage profibrogenic activation/polarization directly as well as indirectly by production of factors that further promote HSC activation or induce monocyte recruitment (eg, tgfb1 and ccl2, respectively). Data in (A, C, E–J) are means ± standard error of the means (SEMs). Statistical analysis was performed as detailed in Figure 1.
Figure 13
Figure 13
FAP regulates HSC activation. (A), Knockdown of FAP inhibits TGFβ1-induced profibrotic gene expression. LX2 cells were transfected with negative control small interfering (siNC) or small interfering FAP (siFAP) following pretreatment with 5 ng/mL TGFβ1 for 24 hours. Transcript levels of fap, col1a1, col3a1, loxl1, pdgfrb, acta2, tgfb1, and ccl2 were analyzed using qPCR. (B–C), Overexpression of FAP promotes HSC activation. LX2 cells were transfected with pCDNA3.1 control plasmid or FAP plasmid for 48 hours. (B), Protein levels of FLAG, collagen type I, and α-SMA were determined by Western blot. (C), Transcript levels of col1a1, acta2, loxl1, and ccl2 were analyzed using qPCR. Data are presented as means ± standard error of the means (SEMs). Statistical analysis was performed using an unpaired 2-tailed Student t test (∗P < .05; ∗∗P < .01; ∗∗∗P < .005).
Figure 14
Figure 14
Expression of FAP protein in livers of patients with chronic liver diseases. Representative H&E, Sirius red, and FAP staining indicates prominent expression on HSC/fibroblasts at parenchymal-mesenchymal interfaces and adjacent to inflammatory infiltrates containing macrophages.
Figure 15
Figure 15
Sequential staining CD68 and α-SMA in livers of patients with advanced chronic liver diseases. Representative images of sequential staining of liver with cirrhosis due to hepatitis B, and PBC stage 2 and stage 4. CD68+ macrophages are located peripherally of areas occupied by α-SMA+ (myo)fibroblasts, compared with a closer association of macrophages with FAP+ fibroblasts (see Figure 14).
Figure 16
Figure 16
In vivo FAP inhibitor administration has no effect on fibrosis related gene expression in normal C67BL/6 and FBV mouse strains. Female C56BL/6 (10 weeks old; n = 5) or FBV (4 weeks old; n = 5) background health control mice were fed chow with or without FAP inhibitor (FAPi) (50 mg/kg/d) for 2 weeks. No difference of hepatic transcript levels of acta2, col1a1, tgfb1, and fap between FAPi-treated and FAPi-treated FVB and C57BL/6 mice. Data are presented as means ± standard error of the means (SEMs). Statistical analysis was performed using an unpaired 2-tailed Student t test (ns, not significant).
Figure 17
Figure 17
Formula and specificity of the FAP inhibitor (A) and targeting strategy to generate Fap-cre-knock in (KI) mice (B–C). (B), Diagram of the Fap-WT and Fap-Cre-KI alleles. C57BL/6 embryonic stem cells were transfected by the CRISPR/Cas9 technology using 2 ∼ 3.0 kb homologous arms on both sides of the 2A-Cre-WPRE (woodchuck posttranscriptional regulatory element)-polyA insertion sequence. Positive clones were selected with ampicillin. The Cre element in the Fap-cre-KI were inserted in exon 26, between the Fap STOP and polyadenylation signals. After embryo transfer, founder mice (F0) with successful homologous recombination were bred with C57BL/6 mice to obtain the F1 generation (Biomodel Organism Science & Technology Development, Shanghai). (C), Genotyping of WT and heterozygous (He) mice by PCR using primer pairs specific to the Fap-cre allele and Fap-WT allele confirmed correct insertion. To detect the constitutive KI allele (395-bp fragment) as well as the WT allele (683-bp fragment) by PCR. The following primers were used: (P3) 5′-CTTAATGCACCAGTTCTATC-3′, forward; (P4) 5′-GAGCATCTTCCAGGTGTG -3′, reverse; (P1) 5′-TGCCGCACTTATGCAATGAAGACAAT-3′, forward; (P2) 5′-CCCGGCAATGAACAGGTGATAAAACA-3′, reverse. 2A: ‘self-cleaving’ 2A peptide from porcine teschovirus-1. (D), tdTomato is expressed in FAP-positive cells upon crossing the reporter mice (LSL-tdTomato) with FAP-cre mice. FAP-expressing cells are detected in muscle cells of striated muscle, heart, and liver.

Comment in

References

    1. Asrani S.K., Devarbhavi H., Eaton J., et al. Burden of liver diseases in the world. J Hepatol. 2019;70:151–171. - PubMed
    1. Matsuda M., Seki E. The liver fibrosis niche: novel insights into the interplay between fibrosis-composing mesenchymal cells, immune cells, endothelial cells, and extracellular matrix. Food Chem Toxicol. 2020;143 - PMC - PubMed
    1. Schuppan D., Afdhal N.H. Liver cirrhosis. Lancet. 2008;371:838–851. - PMC - PubMed
    1. Kisseleva T., Brenner D. Molecular and cellular mechanisms of liver fibrosis and its regression. Nat Rev Gastroenterol Hepatol. 2021;18:151–166. - PubMed
    1. Rockey D.C., Friedman S.L. Fibrosis regression after eradication of hepatitis C virus: from bench to bedside. Gastroenterology. 2021;160:1502–1520.e1. - PMC - PubMed

Publication types