. 2022 Dec 15;6(3):e202201833.
doi: 10.26508/lsa.202201833. Print 2023 Mar.

Convergent evolution and horizontal gene transfer in Arctic Ocean microalgae

Affiliations

Convergent evolution and horizontal gene transfer in Arctic Ocean microalgae

Richard G Dorrell et al. Life Sci Alliance. .

Abstract

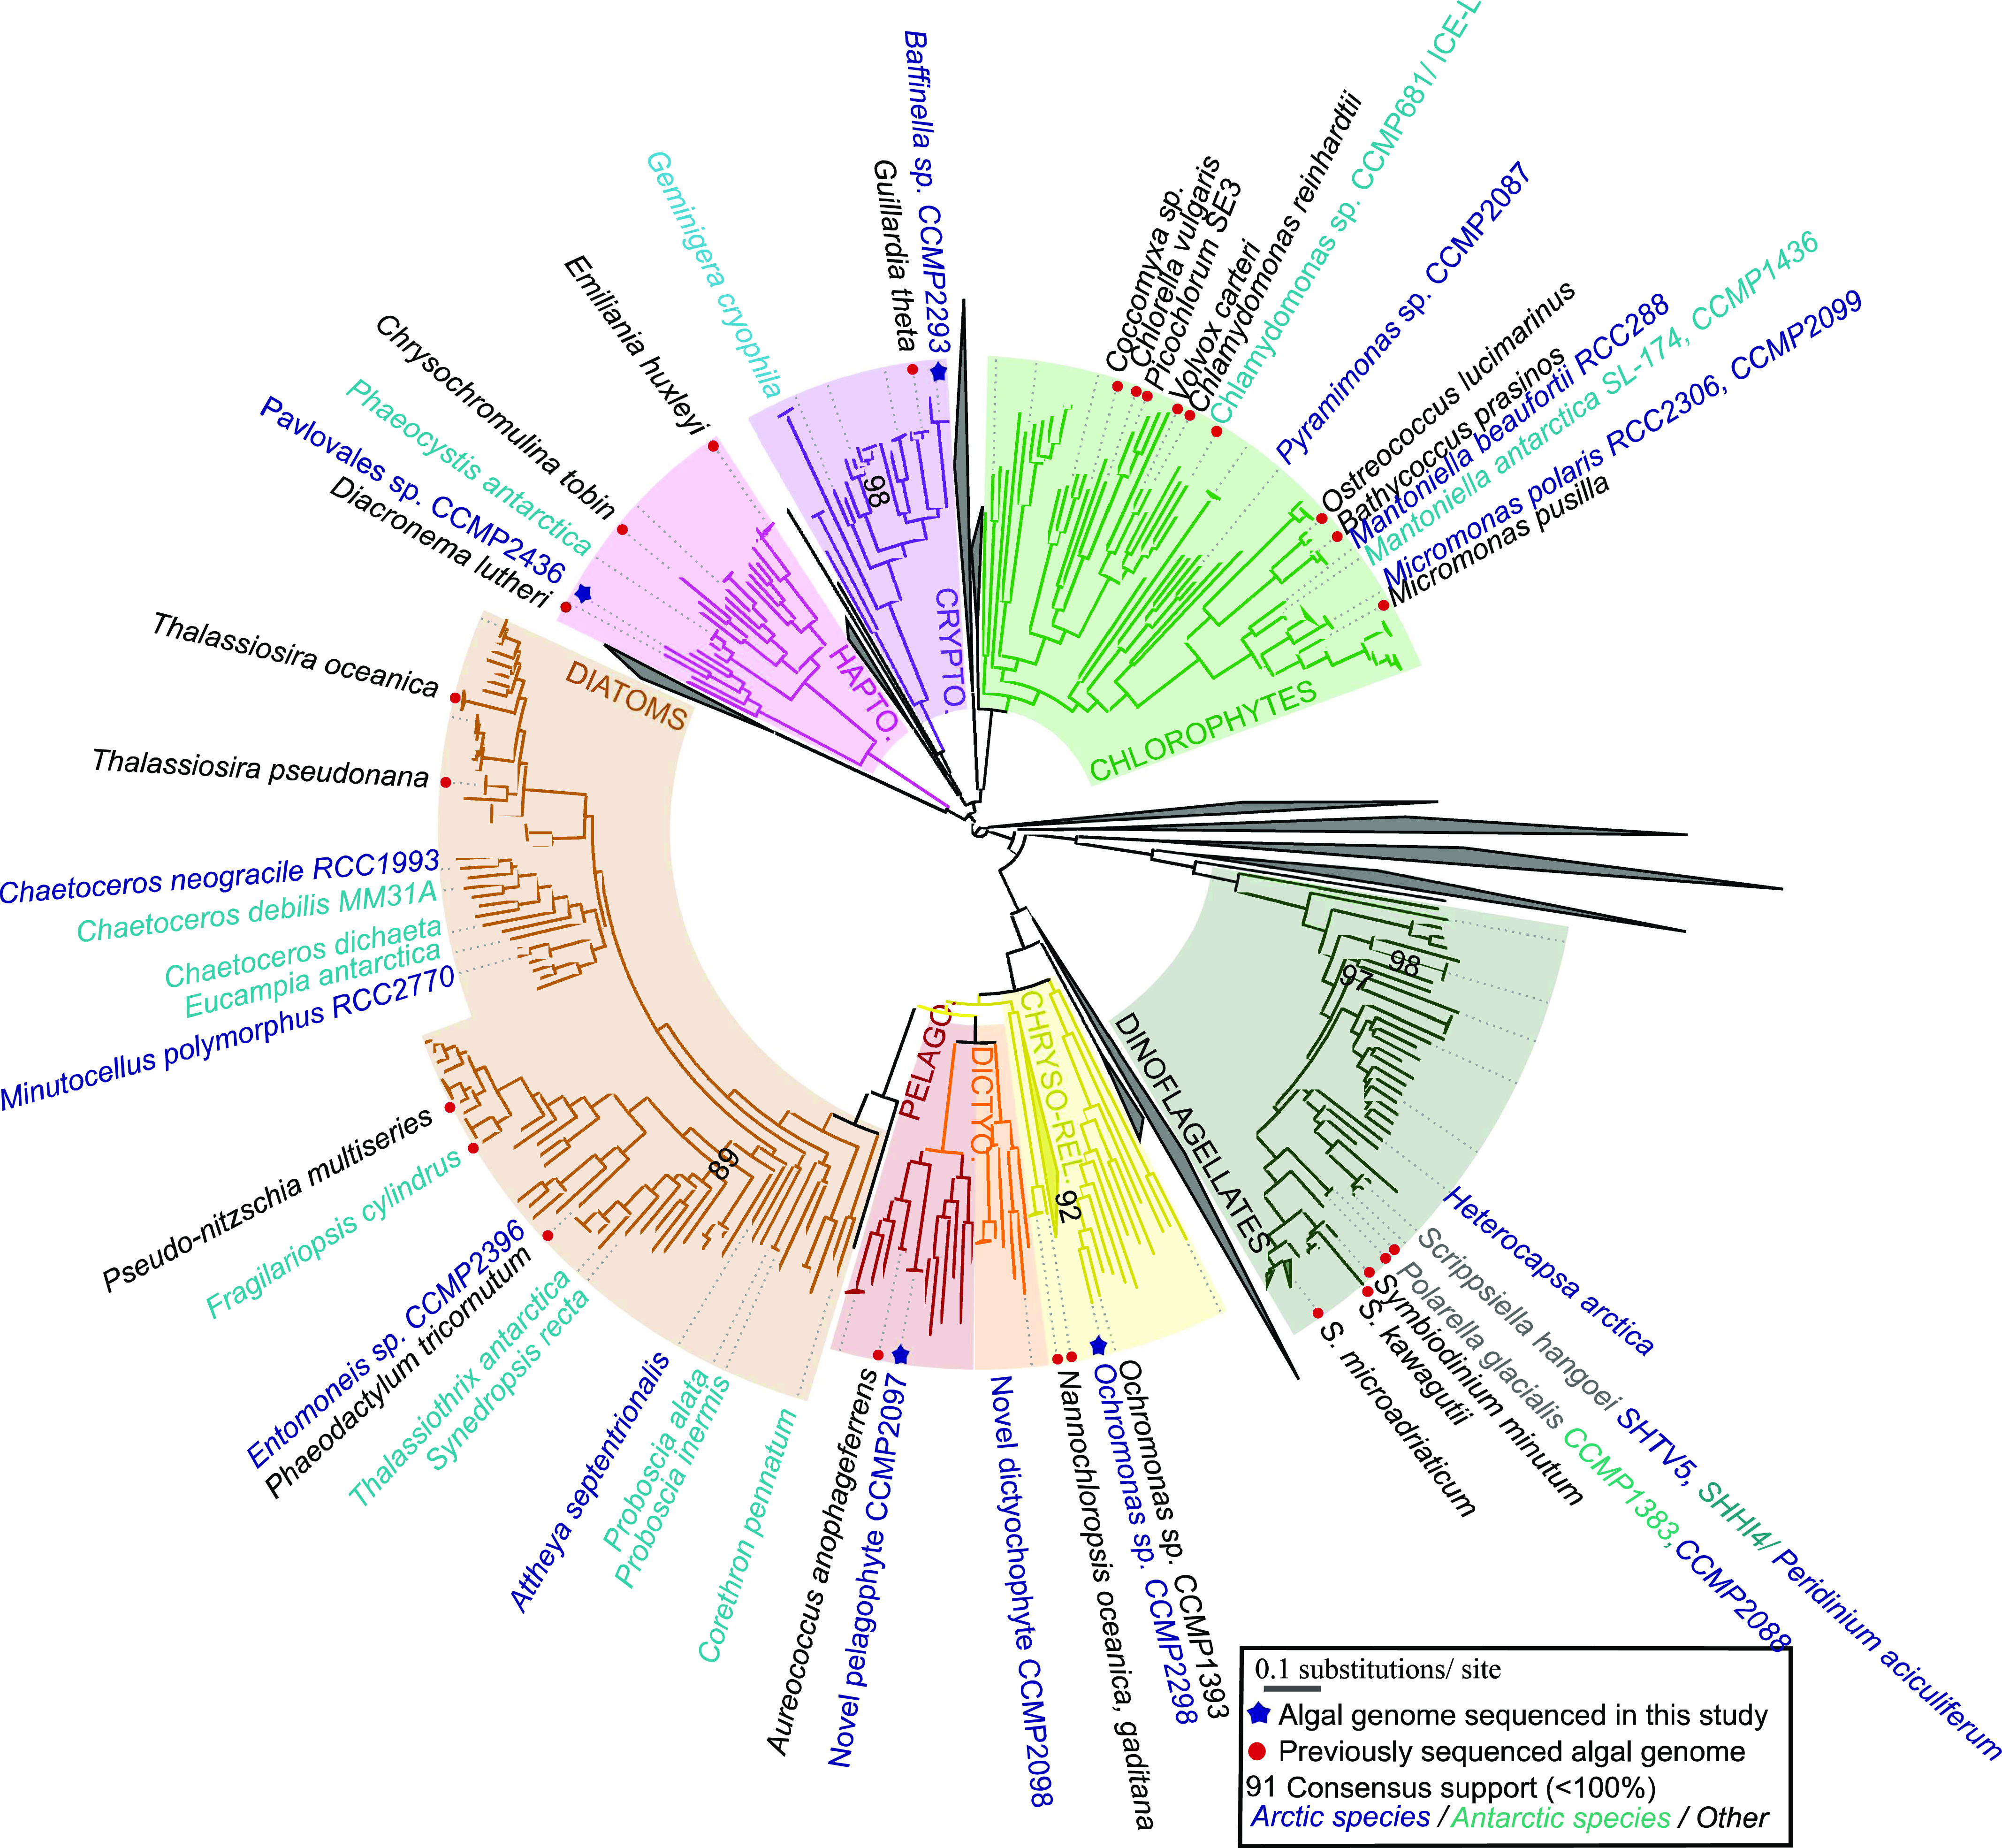
Microbial communities in the world ocean are affected strongly by oceanic circulation, creating characteristic marine biomes. The high connectivity of most of the ocean makes it difficult to disentangle selective retention of colonizing genotypes (with traits suited to biome specific conditions) from evolutionary selection, which would act on founder genotypes over time. The Arctic Ocean is exceptional with limited exchange with other oceans and ice covered since the last ice age. To test whether Arctic microalgal lineages evolved apart from algae in the global ocean, we sequenced four lineages of microalgae isolated from Arctic waters and sea ice. Here we show convergent evolution and highlight geographically limited HGT as an ecological adaptive force in the form of PFAM complements and horizontal acquisition of key adaptive genes. Notably, ice-binding proteins were acquired and horizontally transferred among Arctic strains. A comparison with Tara Oceans metagenomes and metatranscriptomes confirmed mostly Arctic distributions of these IBPs. The phylogeny of Arctic-specific genes indicated that these events were independent of bacterial-sourced HGTs in Antarctic Southern Ocean microalgae.


Conflict of interest statement

The authors declare that they have no conflict of interest.

Figures

Figure 1.
Figure 1.. Broad phylogeny of Arctic and Antarctic algae.
Consensus ML topology of a 391 taxa × 39,504 amino acid alignment based on 250 conserved single-copy nuclear genes from available microalgal genomes and MMETSP transcriptomes. Eight algal groups (cryptomonads, chlorophytes, chrysophytes, dictyochophytes, diatoms, dinoflagellates, haptophytes, and pelagophytes) with at least one Arctic representative are included. Branch colour corresponds to the phylogeny and text colour the isolation site of each genome or transcriptome considered. Sequenced Arctic and Antarctic algal strains and taxonomically representative taxa for each algal group are labelled. Genome libraries sequenced in this study are indicted with blue asterisks.
Figure S1.
Figure S1.. Baffinella SSU trees.
Consensus MrBayes and RAxML tree topology of SSU rRNA of cryptomonads. Topologies are rooted on Goniomonas sp. as an outgroup, with Arctic and algal strains labelled in blue and Antarctic strains in cyan. The inferred evolutionary position of Baffinella sp. CCMP2293 as conspecific of CCMP2045 is noted with a red circle (i) 18S rRNA gene tree with 143 taxa × 1,699 nt, (ii) 16S rRNA (chloroplast) gene tree with 53 taxa × 1,178 nt.
Figure S2.
Figure S2.. Novel pelagophyte CCMP2097 SSU trees.
Consensus MrBayes and RAxML tree topologies of pelagophyte and dictyochophytes. Topologies are rooted between the pelagophytes and dictyochophytes, with Arctic algal strains labelled in blue and Antarctic sequences in cyan. The inferred evolutionary position of the novel species CCMP2097 associated with the Ankylochrysis cluster is noted with a red circle. (i) 18S rRNA gene tree with 48 taxa × 1,730 nt, (ii) 16S rRNA gene (chloroplast) tree with 35 taxa × 819 nt chloroplast 16S alignments.
Figure S3.
Figure S3.. Pavlovales sp. CCMP2436 SSU trees.
Consensus MrBayes and RAxML tree topologies of haptophytes. Topologies are rooted between Pavlophytes and prymnesiophytes, with Arctic and Antarctic algal sequences indicated in blue and cyan, respectively. The position of Pavlovales sp. CCMP2436 is noted with red circles. The inferred evolutionary position puts the strain distant from other known Pavlophytes. (i) 18S rRNA gene tree with 241 taxa × 1,679 nt, (ii) 16S rRNA (chloroplast) gene tree with 94 taxa × 816 nt.
Figure S4.
Figure S4.. Ochromonas CCMP2298 SSU trees.
Consensus MrBayes and RAxML tree topologies of chrysophyte-related species. Topologies are rooted between pinguiophytes—synchromophytes and chrysophytes—synurophytes, with Arctic and Antarctic algal sequences labelled in blue and cyan, respectively. The inferred evolutionary position of Ochromonas sp. CCMP2298 is noted with red circles (i) 18S tree with 219 taxa × 1,684 nt 18S, (ii) 16S rRNA gene (chloroplast) tree with 15 taxa × 1,383 nt.
Figure S5.
Figure S5.. Total read counts of Tara Oceans ribotypes, identified via phylogenetic reconciliation and >99% nucleotide identity to the Arctic strains, in 16S rRNA V4-V5 (16S), 18S rRNA V4 (V4), and 18S rRNA V9 (V9) data.
For the Arctic stations, 3 and 200 μm filters were used compared with 5 and 180 μm filters used for other Tara stations. The two different filter combinations roughly correspond to the nanoplankton (3–200 μm) size fraction and were treated as equivalent here. The totals for each ribotype are tabulated below each plot. Ochromonas sp. CCMP2298 was only detected in the 16S ribotype data. Proportions are shown for (upper panel) depth category; surface, deep chlorophyll maximum, or deeper mesopelagic; and for (lower panel) size fractions.
Figure S6.
Figure S6.. Relative abundances of 18S V9, 18S V4, and 16S V4-V5 ribotypes found in Tara Oceans data.
Ribotypes were identified by BLASTn (threshold similarity [99%]) followed by phylogenetic reconciliation to the target strain to the exclusion of all other sequenced and cultured isolates of the same algal group. Abundances are shown for surface samples and size fractions (typically 0.8–2,000 and 3–20 or 5–20 μm) in which the greatest number of corresponding ribotypes were counted, indicated by the corresponding bubble colours. The different scales for the four strains reflect their comparative abundance or rarity in the Tara data: (i) Baffinella sp. CCMP2293; (ii) novel pelagophyte CCMP2097; (iii) Pavlovales sp. CCMP2436; and (iv) Ochromonas sp. CCMP2298.
Figure S7.
Figure S7.. Tara Ocean stations and pan-algal strain latitudes of origin and in situ temperatures.
Additional experimental growth temperatures of all geolocalised algal genomes (filled symbols) and transcriptomes (open symbols) within the pan-algal dataset are shown. Taxa are shaded by phylogeny (diamond symbols) based on Fig 1, main text. Experimental growth temperature data were manually verified for each culture identified in genome and transcriptome portals (32, 33). Tara Oceans data are taken from PANGAEA entries for each station. The Arctic species sequenced in this study are surrounded by a blue box.
Figure 2.
Figure 2.. Convergence of PFAM domain contents of Arctic-specific algae.
Violin plots of Bray–Curtis indices calculated between PFAM distributions of pairs of algal genomes (top) or transcriptomes (bottom), separated by habitat: Arctic (isolation site > 60°N, within Arctic water masses), Antarctic (isolation site south of the polar front of the Antarctic Circumpolar Current), or other (all intermediate latitudes). Comparisons between members of the same taxonomic group and involving either freshwater or obligately non-photosynthetic species were excluded from the analyses. As there was only one Antarctic genome (Fragilariopsis cylindrus) in the pan-algal dataset, it was not considered in the genomic comparisons. Significance values of one-way ANOVA tests of the separation of means (red dots) are provided between Arctic–Arctic strain pairs and all other forms of strain pairs considered.
Figure S8.
Figure S8.. Violin plots calculated between PFAM distributions (as in Fig 2) separated by habitat: Arctic, Antarctic, or other (all non-polar latitudes).
Significance values of one-way ANOVA tests of the separation of means are shown between Arctic–Arctic strain pairs and all other forms of strain pairs considered. Comparisons between members of the same taxonomic group, freshwater or obligately non-photosynthetic species, were excluded from the analyses. Genomic calculations between pairs of Antarctic strains are not shown as the pan-algal dataset contains only one Antarctic genome (Fragilariopsis cylindrus). Significance values of one-way ANOVA tests of the separation of means are provided between Arctic–Arctic strain pairs and all other forms of species pairs considered. (A, B) Violin plot of pairwise numbers of total number of shared PFAMs normalised on % recovered complete (single or duplicated) eukaryotic BUSCOs and (B) violin plot of Spearman correlation coefficients between PFAM distributions, from Arctic, Antarctic, and other algal genomes (top) and transcriptomes (bottom) within the pan-algal dataset.
Figure S9.
Figure S9.. PCA plot based on PFAM content from transcriptomes and multigene phylogeny of Fig 1.
PCA plots of the principal components 2 and 3. Symbols indicate habitat, and colours indicate underlying phylogeny. Arctic strains (points 2 to 17) are indicated on the plot. The Antarctic strain of Polarella glacialis is shown in the upper left corner (point 1).
Figure 3.
Figure 3.. Arctic-specific expansions and contractions of PFAM domains.
Scatterplot of 3,858 PFAMs, detected in at least one algal genome and one algal transcriptome, and having inferred to have undergone at least one expansion or contraction by CAFE genome data and at least one expansion and contraction by CAFE transcriptome data, showing possible enrichments and depletions in Arctic strains. The horizontal axis shows the signed −log10 chi-squared P-value of the presence of PFAMs in Arctic versus non-Arctic species in the dataset. Positive values indicate the PFAM occurs more frequently than expected in Arctic species, and negative values indicate that the PFAM occurs less frequently than expected in Arctic species. The vertical axis shows the −log10 chi-squared P-values for enrichment in expansions of each PFAM, inferred by CAFE, in Arctic compared with non-Arctic strains, minus the −log10 chi-squared P-values of contractions in each PFAM in Arctic strains, using the same methodology. Positive values indicate that the PFAM is more frequently expanded in Arctic strains and negative values indicate that it is more contracted in Arctic strains than expected. PFAMs that are inferred to either be specifically associated (enriched in presence or expanded) or not associated (contracted) in Arctic compared with non-Arctic strains (P < 10−05) are indicated. The insert shows PFAM (PF11999, ice-binding protein domain) which was enriched and expanded in Arctic strains and was off-scale of the main plot.
Figure 4.
Figure 4.. HGT of ice-binding domain sequences between Arctic algae.
Consensus best scoring tree topology obtained with RAxML under JTT and WAG substitution models for a 4,862-branch × 193 aa alignment of all ice-binding domains (PF11999) sampled from UniRef, JGI algal genomes, MMETSP, and Tara Oceans. Branches are shaded by evolutionary origin and leaf nodes by biogeography (either isolation location of cultured accessions where recorded or on oceanic region for which >70% total abundance of each Tara unigene could be recorded). One Tara unigene (asterisked) shows bipolar distributions (>35% total abundance in both the Arctic Ocean and the Antarctic Southern Ocean). Thick branches indicate the presence of a clade in both best scoring tree outputs. The upper tree schematic shows an overview of the global topology obtained, four clades of algal IBPs with probable within-Arctic transfer histories and two clades of algal IBPs with probable within-Antarctic IBPs (indicated as Arctic A, B, C, and D and Antarctic 1 and 2). Numbers in parentheses identify the number of non-identical branches (i.e., gene sequences) identified in each named species. The earliest diverging branch in each clade, relative to the remaining global tree topology, is marked with an arrow. From these rooting points, probable horizontal transfer events can be inferred, for example, from monophyletic groups of sequences positioned within paraphyletic groups of sequences between sister groups of species with different phylogenetic derivations.
Figure 5.
Figure 5.. Relative abundances of Tara Ocean IBP Marine Atlas of Tara Ocean Unigenes in Arctic and Antarctic clades.
Marine Atlas of Tara Ocean Unigenes were assigned to each clade based on phylogenetic reconciliation from the consensus RAxML topology shown in Fig 4. Relative abundances, shown as a proportion of all meta-genes for each station, for surface and deep chlorophyll maximum depths based on non-size–fractionated samples (0.8−2,000 μm).
Figure S10.
Figure S10.. Diversity of PhnA (PF03831) domains and evidence for bi-polar HGT.
Consensus best scoring tree topology with RaxML under GTR, JTT, and WAG substitution models for a 2,934 branch × 113 aa alignments of all PhnA domains (PF03831) from UNIREF, JGI algal genomes, MMETSP, and MATOUs from Tara Oceans. Branches are shaded by taxonomy and leaf nodes by biogeographical providence. Arctic sequences in blue and Antarctic sequences in cyan. Thick branches indicate the presence of a clade in all three best scoring tree outputs. Top: global topology. Bottom: topology of the indicated clade showing evidence of HGT between Arctic eukaryotic algae. The red dot indicates a clade of Arctic pelagophyte (CCMP2097) and dictyochophyte (CCMP2098).
Figure S11.
Figure S11.. Diversity DUF347 (PF03988) domains and evidence for bi-polar HGT.
Consensus best scoring tree topology with RaxML under GTR, JTT, and WAG substitution models for a 3,942 branch × 240 aa alignments of all DUF347 domains (PF03988) sampled from Uniref, JGI algal genomes, MMETSP, and MATOUs from Tara Oceans. Branches are shaded by taxonomy and leaf nodes by biogeographic providence. Thicker branches indicate the presence of a clade in all three best scoring tree outputs. Top: overview of the global topology. Bottom: topology of two clades containing the bipolar dinoflagellate Scrippsiella and (i) Pavlovales sp. CCMP2436 or (ii) the Antarctic cryptomonad Geminigera. Support values for two nodes linking the Arctic or Antarctic algal genes and meta-genes are indicated by the blue circles.

References

    1. Longhurst A (2006). Ecological Geography of the Sea, pp 560. Cambridge: Academic Press.
    1. Carmack EC (2007) The alpha/beta ocean distinction: A perspective on freshwater fluxes, convection, nutrients and productivity in high-latitude seas. Deep Sea Res Part II: Topical Stud Oceanogr 54: 2578–2598. 10.1016/j.dsr2.2007.08.018 - DOI
    1. Sommeria-Klein G, Watteaux R, Ibarbalz FM, Pierella Karlusich JJ, Iudicone D, Bowler C, Morlon H (2021) Global drivers of eukaryotic plankton biogeography in the sunlit ocean. Science 374: 594–599. 10.1126/science.abb3717 - DOI - PubMed
    1. Chaffron S, Delage E, Budinich M, Vintache D, Henry N, Nef C, Ardyna M, Zayed AA, Junger PC, Galand PE, et al. (2021) Environmental vulnerability of the global ocean epipelagic plankton community interactome. Sci Adv 7: eabg1921. 10.1126/sciadv.abg1921 - DOI - PMC - PubMed
    1. Beszczynska-Moller A, Woodgate RA, Lee C, Melling H, Karcher M (2011) A synthesis of exchanges through the main oceanic gateways to the Arctic Ocean. Oceanography 24: 82–99. 10.5670/oceanog.2011.59 - DOI

Publication types