. 2022 Dec 15;13(1):7515.
doi: 10.1038/s41467-022-34549-2.

Microencapsulation and nanowarming enables vitrification cryopreservation of mouse preantral follicles

Affiliations

Microencapsulation and nanowarming enables vitrification cryopreservation of mouse preantral follicles

Conghui Tian et al. Nat Commun. .

Abstract

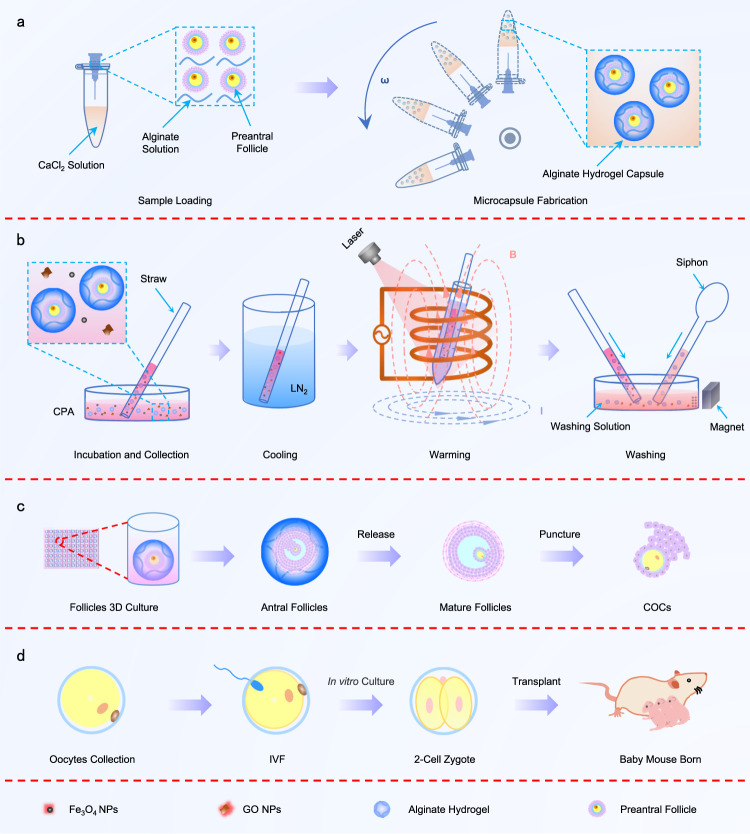
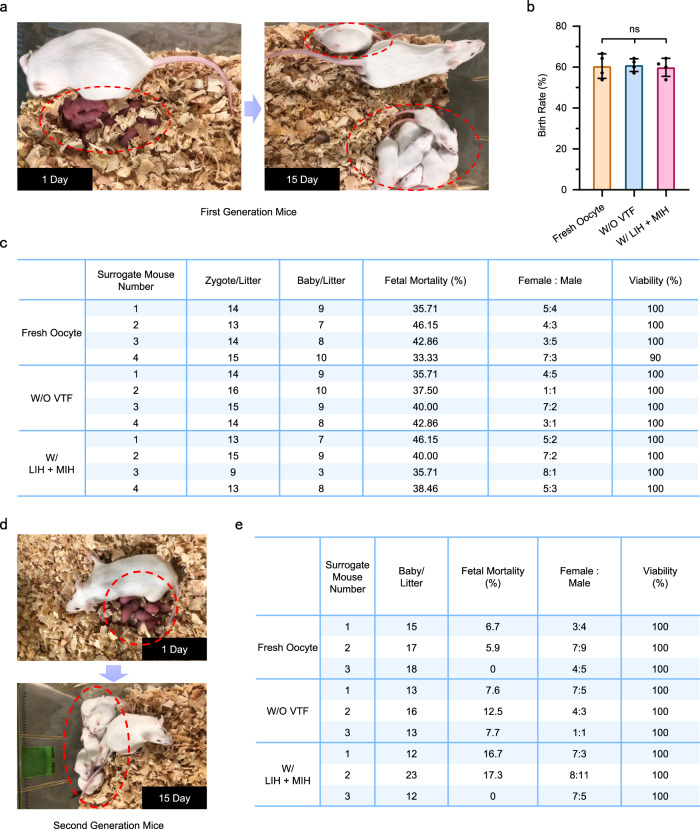
Preantral follicles are often used as models for cryopreservation and in vitro culture due to their easy availability. As a promising approach for mammalian fertility preservation, vitrification of preantral follicles requires high concentrations of highly toxic penetrating cryoprotective agents (up to 6 M). Here, we accomplish low-concentration-penetrating cryoprotective agent (1.5 M) vitrification of mouse preantral follicles encapsulated in hydrogel by nanowarming. We find that compared with conventional water bath warming, the viability of preantral follicles is increased by 33%. Moreover, the cavity formation rate of preantral follicles after in vitro culture is comparable to the control group without vitrification. Furthermore, the percentage of MII oocytes developed from the vitrified follicles, and the birth rate of offspring following in vitro fertilization and embryo transfer are also similar to the control group. Our results provide a step towards nontoxic vitrification by utilizing the synergistic cryoprotection effect of microencapsulation and nanowarming.


Conflict of interest statement

The authors declare no competing interests.

Figures

Fig. 1
Fig. 1. Schematic illustration of microencapsulation, cryopreservation, development of preantral follicles (PAFs) in vitro and subsequent in vitro fertilization (IVF) and transplant.
a Fabrication of PAF-alginate hydrogel microcapsules by centrifugal microfluidic technology. CaCl2 solution: 0.15 M CaCl2 solution; Alginate solution: 1% (w/v) alginate solution. b Cryopreservation and nanowarming [combined with magnetic induction heating (MIH) and laser-induced heating (LIH)] of PAFs. CPA: 0.75 M ethylene glycol (EG) + 0.75 M 1, 2-propanediol (PROH) + 1 M trehalose; Washing solution: α-MEM + 10% FBS. c In vitro culture of PAFs after warming. d IVF and the birth of the next generation of mice after in vivo transplantation of 2-cell zygotes. NPs nanoparticles, GO graphene oxide, COCs cumulus-oocyte complex, LN2 liquid nitrogen, CPA cryoprotective agent.
Fig. 2
Fig. 2. Cooling and warming of CPAs in plastic straws and the thermal effect of NPs excited by near-infrared and magnetic fields.
a Typical images display the cooling and warming of CPAs in plastic straws (PSs) and the thermal history of the nanowarming process. P#1-#4 = 2.4980e−12, P#2-#4 = 7.0018e−10, P#3-#4 = 2.7421e−09, P#2-#3 = 0.0013 (iv). b Scattered light images of 0.3% (w/v) Fe3O4 and 0.03% (w/v) GO NP suspension, 0.1% (w/v) black carbon suspension and deionized (DI) water made by a camera (D5500, Nikon, Japan). c Infrared thermogram of CPA solution containing Fe3O4 and GO NPs under MIH and LIH. #1: CPA (0.75 M EG, 0.75 M PROH, 1 M trehalose), 37 °C water bath; #2: CPA with NPs (0.3% Fe3O4 and 0.03% GO NPs, w/v), 37 °C water bath and MIH; #3: CPA with NPs (0.3% Fe3O4 and 0.03% GO NPs, w/v), 37 °C water bath and LIH; #4: CPA with NPs (0.3% Fe3O4 and 0.03% GO NPs, w/v), 37 °C water bath and MIH + LIH. One-way analysis of variance (ANOVA) and Tukey’s post hoc were used for statistical analysis. ns: p > 0.05; **p ≤ 0.01; ****p ≤ 0.0001. Control: without heating; W/ MIH: with magnetic induction heating; W/ LIH: with laser-induced heating; W/ MIH + LIH: with magnetic induction heating and laser-induced heating. Data are presented as the mean ± standard deviation (SD) (a (iv)).
Fig. 3
Fig. 3. Effect of MIH and LIH on PAFs during warming.
a Differential interference contrast (DIC) and fluorescence images of PAFs after warming under the following different conditions: W/ Encap or W/O Encap, W/ LIH, W/ MIH or W/ MIH and LIH during warming. b Viability of the PAFs after vitrification with different CPAs (0 M, green; 1 M, light green; 1.5 M, orange; 2 M, purple bars). P1–1.5 = 0.5978, P1–2 = 0.4151, P1.5–2 = 0.9785. Each experiment was repeated three times with similar results, and representative images are shown. c Viability of the PAFs encapsulated in different concentrations of alginate hydrogel (0%, green; 1%, rust; 1.5%, pink; and 2%, emerald green bars. w/v) after vitrification with different 1.5 M CPA. P1–1.5 = 0.9553, P1–2 = 0.7018, P1.5–2 = 0.9894. d Viability of PAFs after warming under different conditions (Fresh: green; W/O Encap, MIH and LIH: light green; W/ Encap: orange; W/ Encap and MIH: pink; W/ Encap and LIH: emerald green; W/ Encap, MIH and LIH: blue bars). PFresh- W/ MIH + LIH = 0.1740, PW/O Enap-W/ Enap, W/O MIH or LIH = 0.0265, PW/ Enap, W/O MIH or LIH-W/ MIH = 0.0306, PW/ Enap, W/O MIH or LIH-W/ LIH = 0.0221, PW/ MIH-W/ MIH +  LIH = 0.0137, PW/ LIH-W/ MIH + LIH = 0.0045. 1 M: 0.5 M EG + 0.5 M PROH + 1 M trehalose; 1.5 M: 0.75 M EG + 0.75 M PROH + 1 M trehalose; 2 M: 1 M EG + 1 M PROH + 1 M trehalose. W/O Encap: without encapsulation; W/ Encap: with encapsulation; W/ MIH: with magnetic induction heating; W/O MIH: without magnetic induction heating; W/ LIH: with laser-induced heating; W/O LIH: without laser-induced heating. W/ MIH + LIH: with magnetic induction heating and laser-induced heating. One-way analysis of variance (ANOVA) and Tukey’s post hoc were used for statistical analysis. ns: p > 0.05; *p ≤ 0.05; **p ≤ 0.01. n = 18–23 for four replicates. n: number of follicles used in each experiment. Data are presented as the mean ± SD (b, c, d).
Fig. 4
Fig. 4. The effect of cryopreservation on the development capacity of PAFs.
a Typical developmental images of PAFs after vitrification (VTF). b Growth of PAFs warmed with MIH and LIH. Day 13: PW/O VTF-W/ MIH + LIH = 0.0011. c Secretion of estradiol (E2) from growing PAFs. Day 12: PW/O VTF-W/ MIH + LIH = 0.0020. d The pictures of COCs collection. e The percentage of PAFs developing to antral follicles. f Percentage of MII oocytes in the collected COCs. g Confocal images of spindle morphology in oocytes. h Normal ratio of spindles in oocytes. MI: PFresh oocyte-W/ MIH + LIH = 0.0385. W/O VTF: PAFs were only encapsulated in hydrogel and did not undergo vitrification; W/ MIH + LIH: PAFs encapsulated in hydrogel were warmed with MIH and LIH after vitrification. Fresh oocytes: MII oocytes obtained directly from the ampulla of the oviduct of a mouse; Two-way analysis of variance (ANOVA) and Tukey’s post hoc were used for statistical analysis (b, c, h); One-way analysis of variance (ANOVA) and Tukey’s post hoc were used for statistical analysis (f); Two-tailed Student’s t test (e). ns: p > 0.05; *p ≤ 0.05. **p ≤ 0.01. n = 10–20 for three replicates (b); n = 30 for three replicates (c); n = 40–50 for four replicates (e); n = 10–20 for four replicates (f); n = 10–20 for five replicates (h). n: number of follicles used in each experiment. Data are presented as the mean ± SD (b, c, e, f, h). Each experiment was repeated three times with similar results, and representative images are shown (a, d, g).
Fig. 5
Fig. 5. IVF of MII oocytes and development of zygotes.
a Representative images of the development of oocytes in vitro (from MII oocytes to the blastocyst stage). Each experiment was repeated three times with similar results, and representative images are shown. b IVF analysis of oocytes. Pronuclear formation rate: Percentage of 2-pronuclei to total number of oocytes involved in IVF. c Evaluation of the embryonic developmental performance. W/O VTF: PAFs were only encapsulated in hydrogel and did not undergo vitrification; W/ MIH + LIH: PAFs encapsulated in hydrogel were warmed with MIH and LIH after vitrification; Fresh oocytes: MII oocytes obtained directly from the ampulla of the oviduct of a mouse; One-way analysis of variance (ANOVA) and Tukey’s post hoc were used for statistical analysis (b); Two-way analysis of variance (ANOVA) and Tukey’s post hoc were used for statistical analysis (c). ns: p > 0.05. n = 10–20 for five replicates (b); n = 10–20 for three replicates (c). n: number of follicles used in each experiment. Data are presented as the mean ± SD (b, c).
Fig. 6
Fig. 6. H3K4me3 and H3K9me3 in embryos at different stages.
a Representative images of H3K4me3 in embryos at different stages. b Representative images of H3K9me3 in embryos at different stages. Scale bar is 10 μm (a, b). Each experiment was repeated three times with similar results, and representative images are shown (a, b). W/O VTF: PAFs were only encapsulated in hydrogel and did not undergo vitrification; W/ MIH + LIH: PAFs encapsulated in hydrogel were warmed with MIH and LIH after vitrification.
Fig. 7
Fig. 7. Birth of offspring after transplantation of 2-cell stage zygotes.
a Mouse pups were born after transplantation of 2-cell stage embryos. b Analysis of the mouse birth rate. c Reproductive performance after zygote transfer. d Birth of the second generation of mice. e Reproduction performance of the first generation of mice. W/O VTF: PAFs were only encapsulated in hydrogel and did not undergo vitrification; W/ MIH + LIH: PAFs encapsulated in hydrogel were warmed with MIH and LIH after vitrification. Fresh oocytes: MII oocytes obtained directly from the ampulla of the oviduct of a mouse; One-way analysis of variance (ANOVA) and Tukey’s post hoc were used for statistical analysis (b). ns: p > 0.05. n = 10–20 for four replicates (b). n: number of follicles used in each experiment. Data are presented as the mean ± SD (b).
Fig. 8
Fig. 8. Possible mechanism of microencapsulation, MIH and LIH to improve the efficiency of low-pCPA PAF vitrification.
MIH magnetic induction heating, LIH laser-induced heating.

References

    1. Breast cancer statistics. Cancer Research UK. https://www.cancerresearchuk.org/health-professional/cancer-statistics/s... (2019).
    1. Oktay KH, Marin L, Titus S. Impact of chemotherapy on the ovarian reserve: Are all primordial follicles created equal? Fertil. Steril. 2022;117:396–398. doi: 10.1016/j.fertnstert.2021.12.007. - DOI - PubMed
    1. Cacciottola L, Donnez J, Dolmans MM. Ovarian tissue and oocyte cryopreservation prior to iatrogenic premature ovarian insufficiency. Best. Pract. Res Clin. Obstet. Gynaecol. 2022;81:119–133. doi: 10.1016/j.bpobgyn.2021.09.010. - DOI - PubMed
    1. Szymanska KJ, Tan X, Oktay K. Unraveling the mechanisms of chemotherapy-induced damage to human primordial follicle reserve: road to developing therapeutics for fertility preservation and reversing ovarian aging. Mol. Hum. Reprod. 2020;26:553–566. doi: 10.1093/molehr/gaaa043. - DOI - PMC - PubMed
    1. Del Castillo LM, et al. The cyto-protective effects of LH on ovarian reserve and female fertility during exposure to gonadotoxic alkylating agents in an adult mouse model. Hum. Reprod. 2021;36:2514–2528. doi: 10.1093/humrep/deab165. - DOI - PMC - PubMed

Publication types

Substances