. 2022 Dec 15;13(1):7775.
doi: 10.1038/s41467-022-35454-4.

Multi-omics identify falling LRRC15 as a COVID-19 severity marker and persistent pro-thrombotic signals in convalescence

Affiliations

Multi-omics identify falling LRRC15 as a COVID-19 severity marker and persistent pro-thrombotic signals in convalescence

Jack S Gisby et al. Nat Commun. .

Abstract

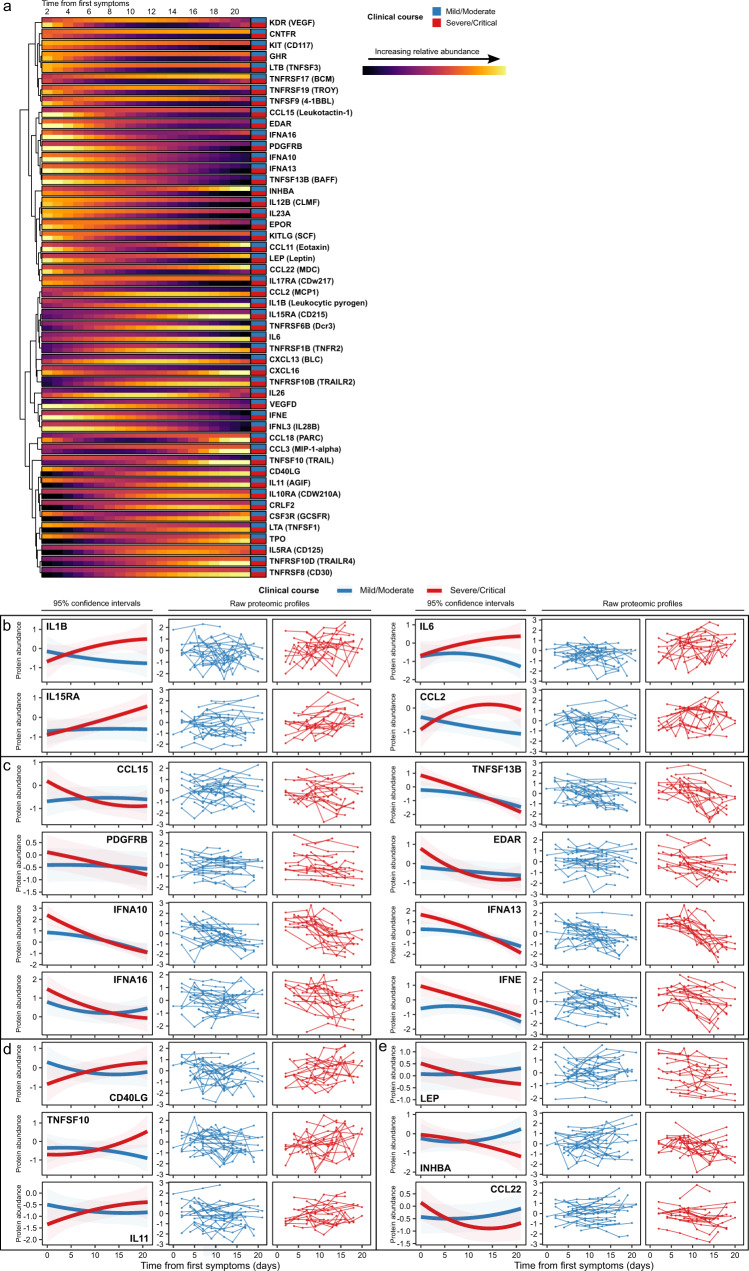
Patients with end-stage kidney disease (ESKD) are at high risk of severe COVID-19. Here, we perform longitudinal blood sampling of ESKD haemodialysis patients with COVID-19, collecting samples pre-infection, serially during infection, and after clinical recovery. Using plasma proteomics, and RNA-sequencing and flow cytometry of immune cells, we identify transcriptomic and proteomic signatures of COVID-19 severity, and find distinct temporal molecular profiles in patients with severe disease. Supervised learning reveals that the plasma proteome is a superior indicator of clinical severity than the PBMC transcriptome. We show that a decreasing trajectory of plasma LRRC15, a proposed co-receptor for SARS-CoV-2, is associated with a more severe clinical course. We observe that two months after the acute infection, patients still display dysregulated gene expression related to vascular, platelet and coagulation pathways, including PF4 (platelet factor 4), which may explain the prolonged thrombotic risk following COVID-19.


Conflict of interest statement

None of the authors have any patents (planned, pending or issued) or competing interests relevant to this work. Other interests unrelated to this work: S.P.M. reports personal fees from Celltrion, Rigel, GSK and Cello; M.C.P. reports consulting honoraria with Alexion, Apellis, Achillion, Novartis and Gyroscope; D.C.T. reports speaker and consultancy fees from Astra-Zeneca and Novartis; J.E.P. has received travel and accommodation expenses and hospitality from Olink proteomics to speak at Olink-sponsored academic meetings (none within the past 5 years). None of the other authors have any interests to declare.

Figures

Fig. 1
Fig. 1. Study design and cohort summary.
a Graphical summary of the patient cohorts, sampling, and major analyses. Wave 1 patients were recruited in Spring 2020. 17 of the COVID-19 negative ESKD patients recruited as a controls in Wave 1 were recruited again as COVID-19 positive cases in Wave 2 (2021). For 12/13 survivors in Wave 2, we obtained a convalescent sample approximately 2 months following recovery. Thus, for Wave 2, we had paired pre-infection, acute infection and post-infection samples from the same individuals. b, c For each cohort, the timing of the serial blood sampling is shown by triangles and the temporal COVID-19 severity by coloured bars. Three patients were hospitalised prior to COVID-19 diagnosis in the Wave 1 cohort. Three of the four patients in the Wave 2 cohort with fatal outcomes died >30 days from first positive swab.
Fig. 2
Fig. 2. Signatures of COVID-19 in ESKD.
a PCA of the PBMC transcriptome (left) and plasma proteome (right). Each point represents a sample and is coloured by COVID-19 status. b Paired violin plots showing intra-individual comparisons of pre-infection and most severe sample (Wave 2 cohort; n = 34 samples from 17 individuals) during COVID-19 for selected genes. Grey lines link each individual’s pre-infection and infection samples; these samples are represented by points and coloured by COVID-19 status. Shaded areas indicate kernel density estimates. For boxplots, centre = median, upper bound = upper quartile, lower bound = lower quartile. All genes shown were significantly differentially expressed (1% FDR) in both cohorts. Genes are grouped by membership to pathways that were significantly enriched (1% FDR) in GSVA. c The 30 protein pathway enrichment terms with the greatest RRA scores (indicating consistent dysregulation in both the Wave 1 and Wave 2 proteomic datasets), ordered by effect size. All pathway terms shown were significantly enriched in the individual cohort analyses (1% FDR). Red= up-regulated in COVID-19 positive versus negative; blue= down-regulated. d As for b, but displaying selected plasma proteins (significant at 1% FDR) (n = 32 samples from 16 individuals).
Fig. 3
Fig. 3. Association of the PBMC transcriptome and COVID-19 severity.
a PCA of the PBMC transcriptome. Each point represents a sample and is coloured by contemporaneous COVID-19 WHO severity (left) and overall clinical course (right). b The 30 GSVA transcriptomic pathway enrichment terms with the greatest RRA scores. All were significantly enriched in both Wave 1 and 2 cohorts (1% FDR). Terms are ordered and coloured by their effect size. Red=up-regulated in more severe COVID-19; blue=down-regulated. c Violin plots show gene expression values (Wave 1 cohort; n = 179 samples from 51 COVID-19 positive ESKD patients and 55 samples from COVID-19 negative ESKD patients) stratified by COVID-19 status and severity (at time of sample) for selected genes. Shaded areas indicate kernel density estimates. For boxplots, centre=median, upper bound=upper quartile (UQ), lower bound=lower quartile (LQ), upper whisker=largest value at most 1.5 * IQR (inter-quartile range) from the UQ, lower whisker=smallest value at most 1.5 * IQR from the LQ, points=samples outside of the range of the whiskers. All genes shown were significantly associated (1% FDR) with severity in both the Wave 1 and 2 cohorts. Genes are grouped by membership to pathways that were significantly enriched (1% FDR) in GSVA.
Fig. 4
Fig. 4. Longitudinal profiles of transcriptomic modules.
a The longitudinal profiles of significant (TxCC, LMM, FDR < 0.05) gene modules, stratified by clinical course. Lines represent estimated marginal means and shaded areas represent their 95% confidence intervals. b Modelled longitudinal profiles of the three genes within module B with the most significant TxCC interaction effects (LMM). Left: lines represent estimated marginal means and shaded areas represent their 95% confidence intervals. Right: individual-level data (n = 169 samples from 40 individuals). c Heatmap displaying associations (LMM) between transcriptomic and proteomic modules (right). Red=positive correlation, blue=negative correlation. Significant associations (5% FDR) are represented by an asterisk.
Fig. 5
Fig. 5. Dynamic temporal changes in circulating cytokines and receptors vary between severe and mild COVID-19.
a Heatmap displaying proteins with a significantly different temporal profile in mild vs severe disease (TxCC, LMM, FDR < 0.05). Colour indicates LMM estimated marginal means over time, stratified by patient group (n = 169 samples from 40 individuals). Proteins are clustered based on the temporal profile of the discordance between mild/moderate and severe/critical disease. Proteins are annotated using gene symbols, with alternative common protein identifiers in parentheses. b–e Examples of proteins with differing patterns of discordance over time in severe/critical versus mild/moderate patients (TxCC, LMM, FDR < 0.05). Lines represent estimated marginal means and shaded areas represent their 95% confidence intervals. The raw proteomic profiles display protein abundance for each individual (n = 169 samples from 40 individuals).
Fig. 6
Fig. 6. Supervised learning to predict COVID-19 severity from molecular features.
a Point estimates (mean) and 95% confidence intervals of the area under the receiver operating characteristic curve (AUC-ROC) for predicting COVID-19 severity (from 200 cross-validation resamples of 51 independent samples) using lasso regression. Both = supervised learning on the combined proteomic and transcriptomic data. b Important proteins (left) and genes (right) for the lasso model. Feature importance is scaled between 0 and 1, where 1 represents the most important feature. c The profile of LRRC15 plasma protein concentration over time, stratified by severity of the patients’ overall clinical course (n = 169 samples from 40 individuals). Left: lines represent estimated LMM marginal means and shaded areas represent their 95% confidence intervals. Right: raw data for each individual.
Fig. 7
Fig. 7. Persistent dysregulation of immune cell gene expression two months following COVID-19.
a PCA of the Wave 2 PBMC transcriptomic data, including pre-infection, infection and recovery samples (taken 2 months after the acute illness). Each point represents a sample. Arrows link recovery samples to the pre-infection sample from the same individual. b Paired violin plots for differentially expressed genes in recovery versus pre-infection samples (n = 24 samples from 12 individuals). Grey lines link each individual’s pre- infection sample to their recovery sample; these samples are represented by points. Shaded areas indicate kernel density estimates. For boxplots, centre=median, upper bound=upper quartile, lower bound=lower quartile. c All significantly enriched (5% FDR) pathway terms for the differentially expressed genes in recovery versus pre-infection samples. Overrepresentation testing was performed for each gene set with a one-sided Fisher’s exact test.

References

    1. Mann ER, et al. Longitudinal immune profiling reveals key myeloid signatures associated with COVID-19. Sci. Immunol. 2020;5:eabd6197. doi: 10.1126/sciimmunol.abd6197. - DOI - PMC - PubMed
    1. Laing AG, et al. A dynamic COVID-19 immune signature includes associations with poor prognosis. Nat. Med. 2020;26:1623–1635. doi: 10.1038/s41591-020-1038-6. - DOI - PubMed
    1. Stephenson E, et al. Single-cell multi-omics analysis of the immune response in COVID-19. Nat. Med. 2021;27:904–916. doi: 10.1038/s41591-021-01329-2. - DOI - PMC - PubMed
    1. Bernardes JP, et al. Longitudinal multi-omics analyses identify responses of megakaryocytes, erythroid cells, and plasmablasts as hallmarks of severe COVID-19. Immunity. 2020;53:1296–1314.e9. doi: 10.1016/j.immuni.2020.11.017. - DOI - PMC - PubMed
    1. Szabo PA, et al. Longitudinal profiling of respiratory and systemic immune responses reveals myeloid cell-driven lung inflammation in severe COVID-19. Immunity. 2021;54:797–814.e6. doi: 10.1016/j.immuni.2021.03.005. - DOI - PMC - PubMed

Publication types