

Cerebrospinal fluid biomarkers for assessing Huntington disease onset and severity
- PMID: 36523269
- PMCID: PMC9746690
- DOI: 10.1093/braincomms/fcac309
Cerebrospinal fluid biomarkers for assessing Huntington disease onset and severity
Abstract
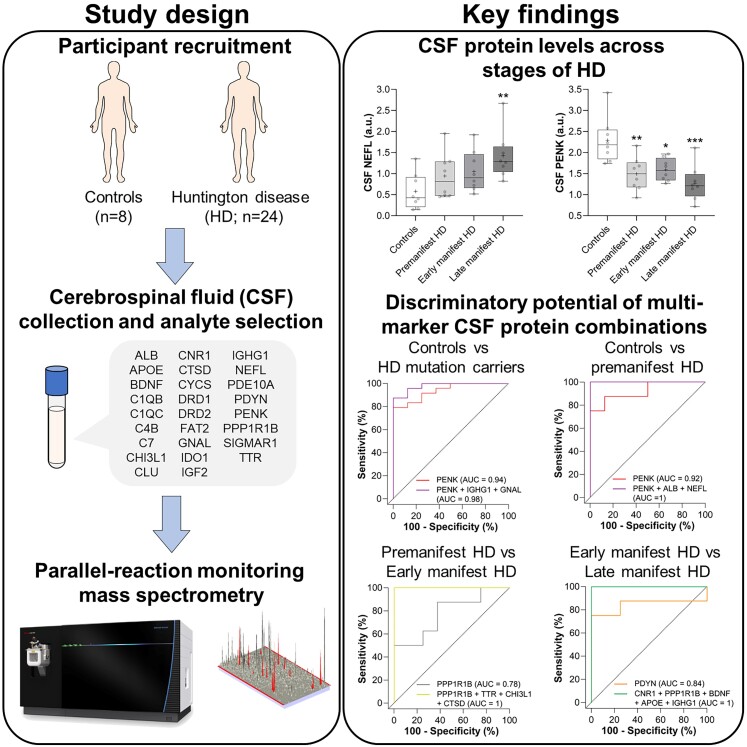
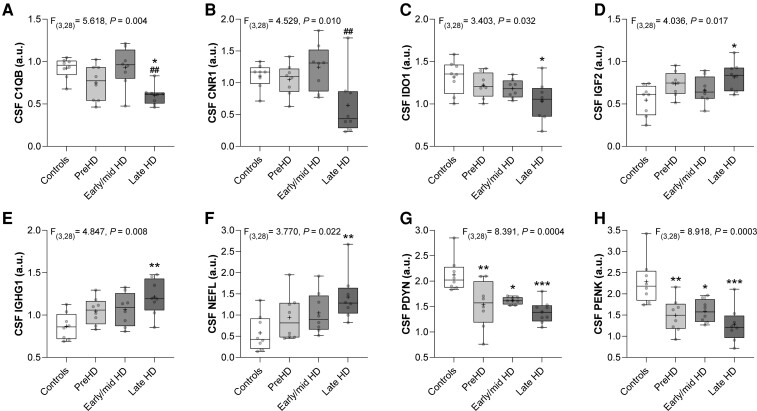
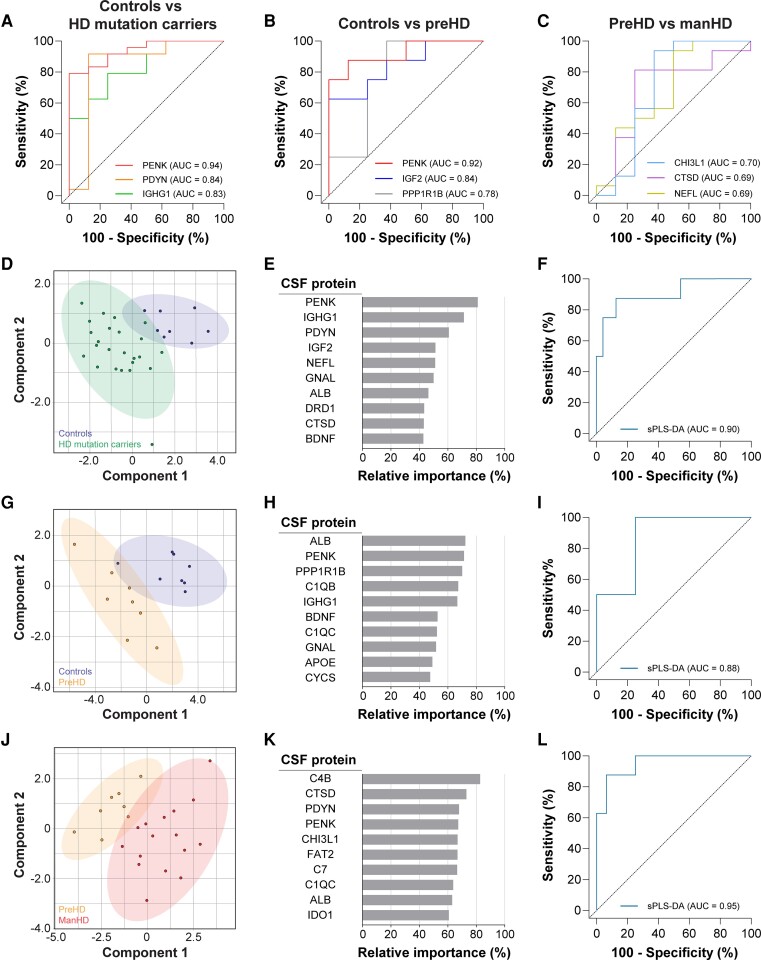
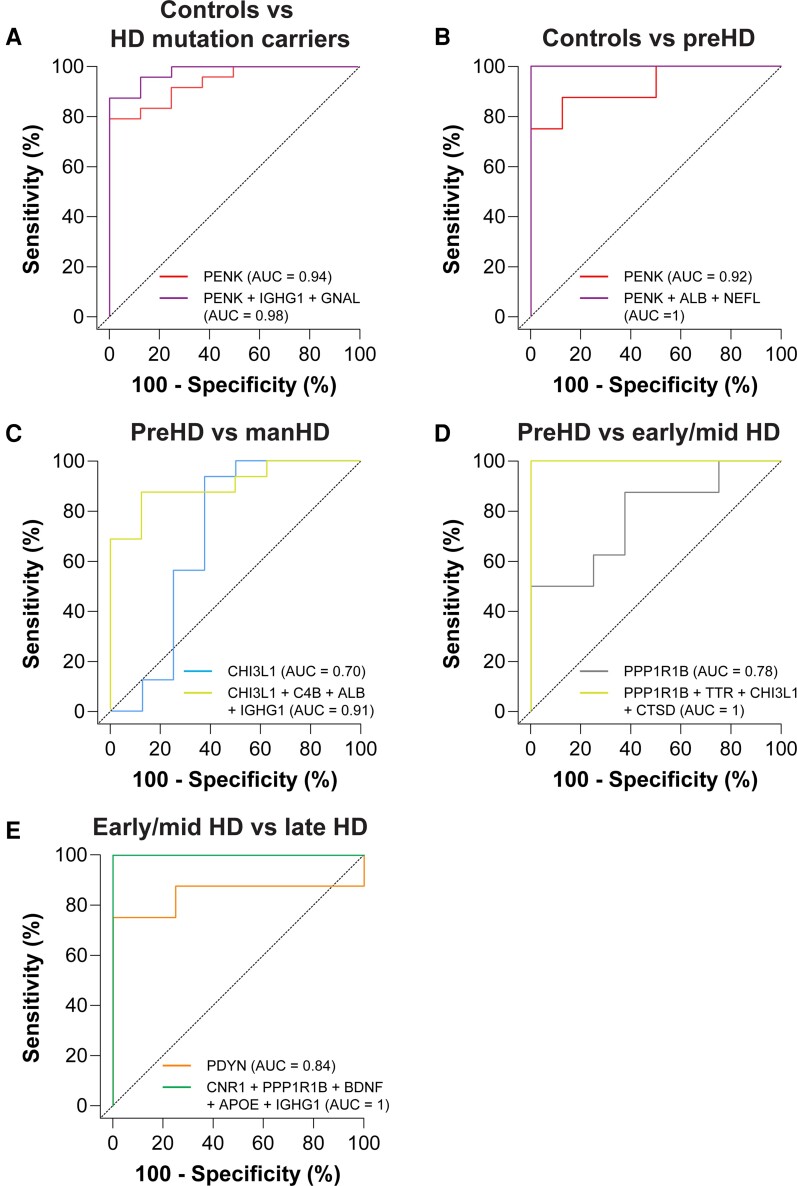
The identification of molecular biomarkers in CSF from individuals affected by Huntington disease may help improve predictions of disease onset, better define disease progression and could facilitate the evaluation of potential therapies. The primary objective of our study was to investigate novel CSF protein candidates and replicate previously reported protein biomarker changes in CSF from Huntington disease mutation carriers and healthy controls. Our secondary objective was to compare the discriminatory potential of individual protein analytes and combinations of CSF protein markers for stratifying individuals based on the severity of Huntington disease. We conducted a hypothesis-driven analysis of 26 pre-specified protein analytes in CSF from 16 manifest Huntington disease subjects, eight premanifest Huntington disease mutation carriers and eight healthy control individuals using parallel-reaction monitoring mass spectrometry. In addition to reproducing reported changes in previously investigated CSF biomarkers (NEFL, PDYN, and PENK), we also identified novel exploratory CSF proteins (C1QB, CNR1, GNAL, IDO1, IGF2, and PPP1R1B) whose levels were altered in Huntington disease mutation carriers and/or across stages of disease. Moreover, we report strong associations of select CSF proteins with clinical measures of disease severity in manifest Huntington disease subjects (C1QB, CNR1, NEFL, PDYN, PPP1R1B, and TTR) and with years to predicted disease onset in premanifest Huntington disease mutation carriers (ALB, C4B, CTSD, IGHG1, and TTR). Using receiver operating characteristic curve analysis, we identified PENK as being the most discriminant CSF protein for stratifying Huntington disease mutation carriers from controls. We also identified exploratory multi-marker CSF protein panels that improved discrimination of premanifest Huntington disease mutation carriers from controls (PENK, ALB and NEFL), early/mid-stage Huntington disease from premanifest mutation carriers (PPP1R1B, TTR, CHI3L1, and CTSD), and late-stage from early/mid-stage Huntington disease (CNR1, PPP1R1B, BDNF, APOE, and IGHG1) compared with individual CSF proteins. In this study, we demonstrate that combinations of CSF proteins can outperform individual markers for stratifying individuals based on Huntington disease mutation status and disease severity. Moreover, we define exploratory multi-marker CSF protein panels that, if validated, may be used to improve the accuracy of disease-onset predictions, complement existing clinical and imaging biomarkers for monitoring the severity of Huntington disease, and potentially for assessing therapeutic response in clinical trials. Additional studies with CSF collected from larger cohorts of Huntington disease mutation carriers are needed to replicate these exploratory findings.
Keywords: CSF; Huntington disease; biomarkers; neurofilament light; proenkephalin.
© The Author(s) 2022. Published by Oxford University Press on behalf of the Guarantors of Brain.
Figures
References
-
- The Huntington’s Disease Collaborative Research Group . A novel gene containing a trinucleotide repeat that is expanded and unstable on Huntington’s disease chromosomes. Cell. 1993;72(6):971–983. - PubMed
-
- Deng YP, Albin RL, Penney JB, Young AB, Anderson KD, Reiner A. Differential loss of striatal projection systems in Huntington’s disease: A quantitative immunohistochemical study. J Chem Neuroanat. 2004;27(3):143–164. - PubMed
-
- Glass M, Dragunow M, Faull RL. The pattern of neurodegeneration in Huntington’s disease: A comparative study of cannabinoid, dopamine, adenosine and GABA(A) receptor alterations in the human basal ganglia in Huntington’s disease. Neuroscience. 2000;97(3):505–519. - PubMed
-
- Cudkowicz M, Kowall NW. Degeneration of pyramidal projection neurons in Huntington’s disease cortex. Ann Neurol. 1990;27(2):200–204. - PubMed
LinkOut - more resources
Full Text Sources
Other Literature Sources
Research Materials
Miscellaneous