. 2022 Nov 29:13:969509.
doi: 10.3389/fimmu.2022.969509. eCollection 2022.

Combined proteomics and single cell RNA-sequencing analysis to identify biomarkers of disease diagnosis and disease exacerbation for systemic lupus erythematosus

Affiliations

Combined proteomics and single cell RNA-sequencing analysis to identify biomarkers of disease diagnosis and disease exacerbation for systemic lupus erythematosus

Yixi Li et al. Front Immunol. .

Abstract

Introduction: Systemic lupus erythematosus (SLE) is a chronic autoimmune disease for which there is no cure. Effective diagnosis and precise assessment of disease exacerbation remains a major challenge.

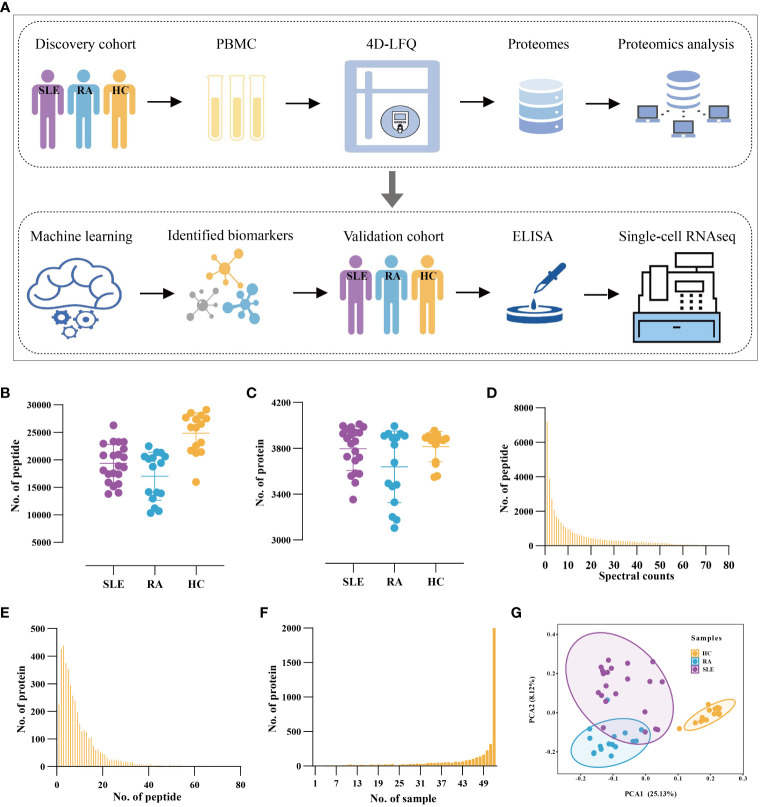
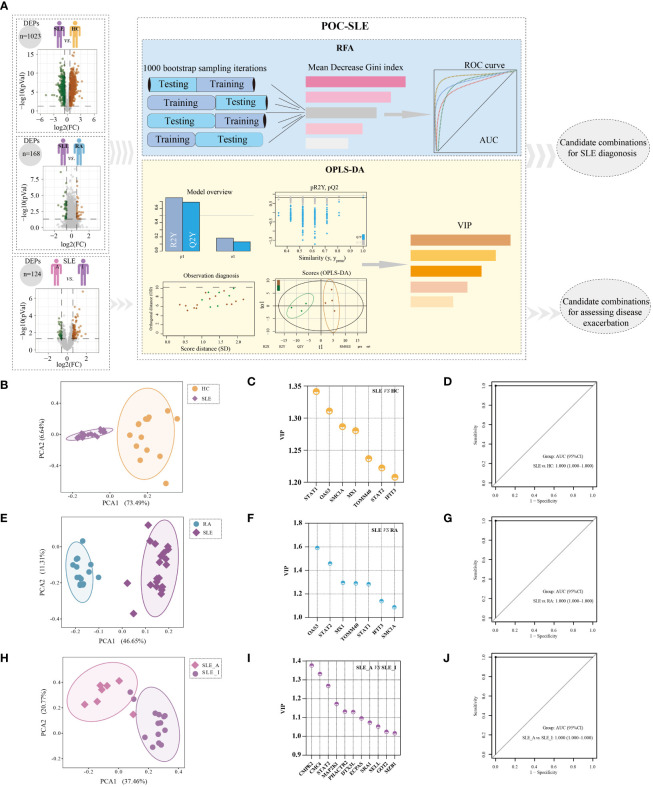
Methods: We performed peripheral blood mononuclear cell (PBMC) proteomics of a discovery cohort, including patients with active SLE and inactive SLE, patients with rheumatoid arthritis (RA), and healthy controls (HC). Then, we performed a machine learning pipeline to identify biomarker combinations. The biomarker combinations were further validated using enzyme-linked immunosorbent assays (ELISAs) in another cohort. Single-cell RNA sequencing (scRNA-seq) data from active SLE, inactive SLE, and HC PBMC samples further elucidated the potential immune cellular sources of each of these PBMC biomarkers.

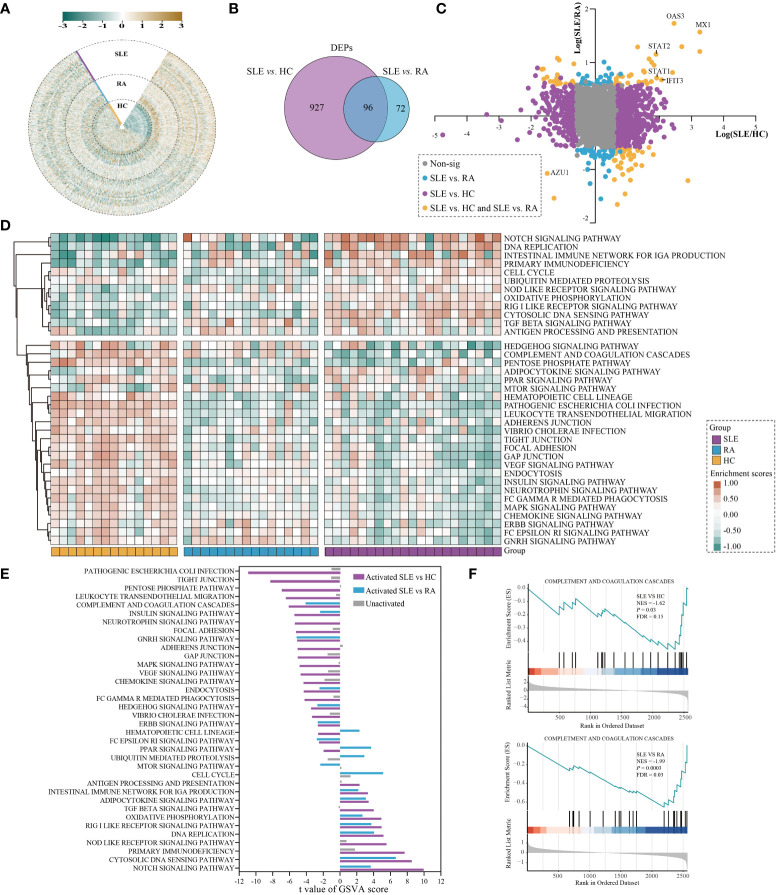
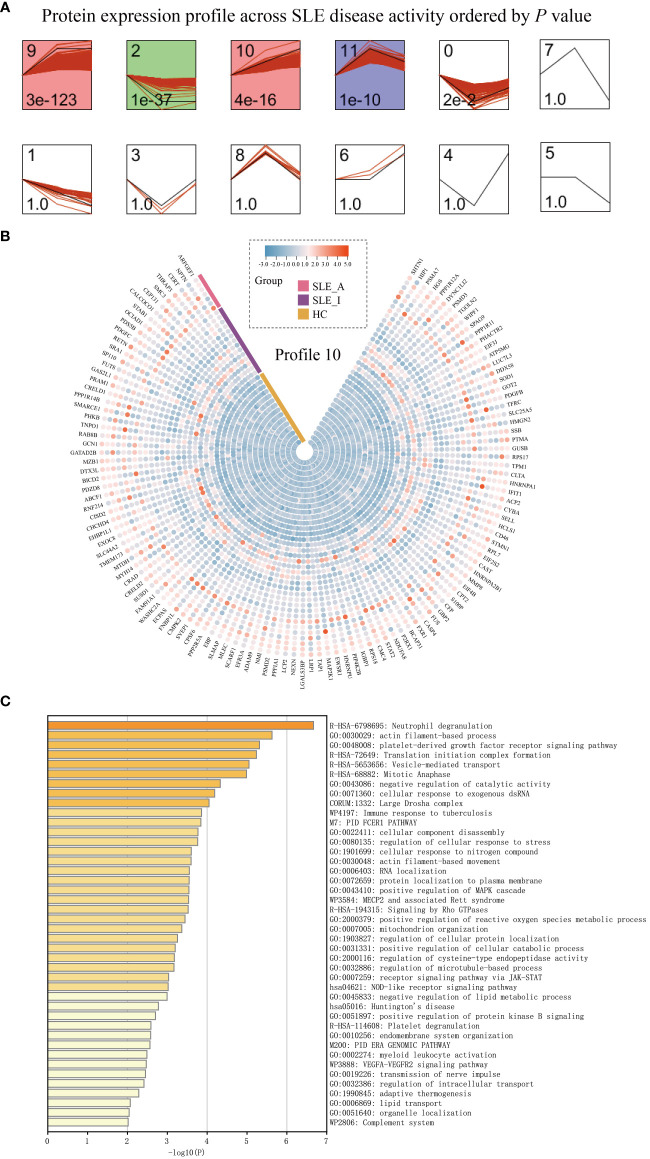
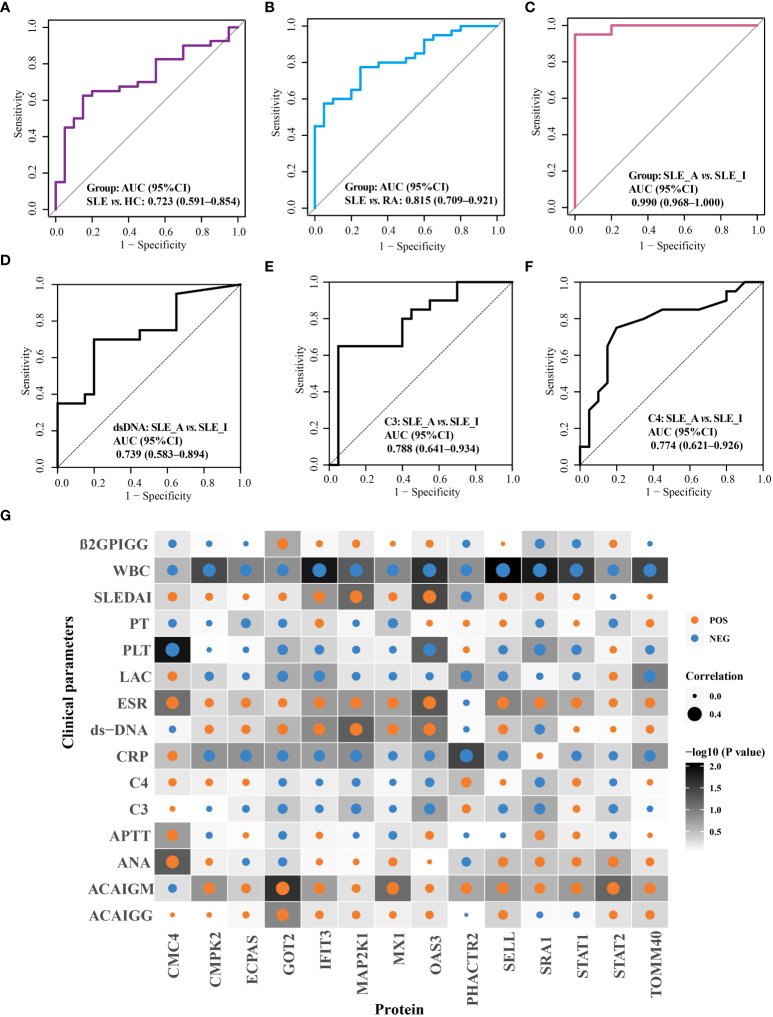
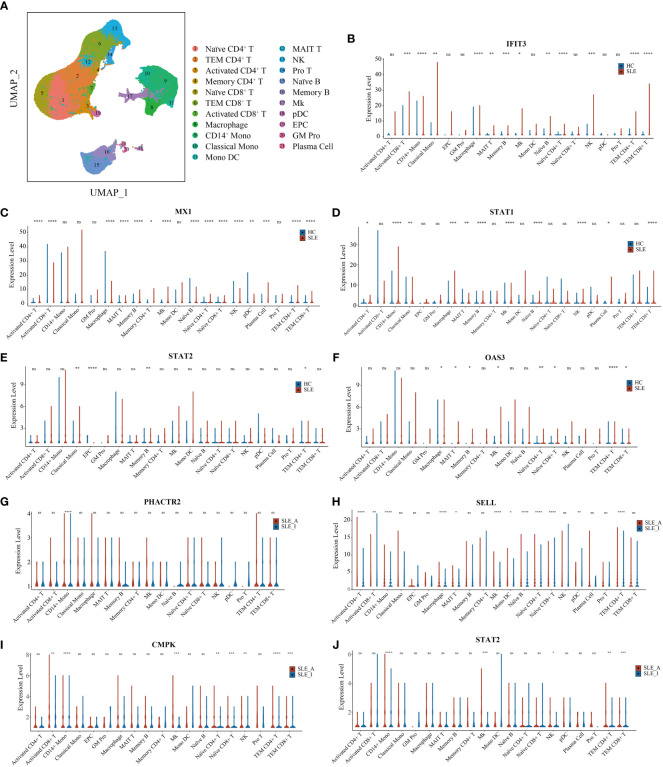
Results: Screening of the PBMC proteome identified 1023, 168, and 124 proteins that were significantly different between SLE vs. HC, SLE vs. RA, and active SLE vs. inactive SLE, respectively. The machine learning pipeline identified two biomarker combinations that accurately distinguished patients with SLE from controls and discriminated between active and inactive SLE. The validated results of ELISAs for two biomarker combinations were in line with the discovery cohort results. Among them, the six-protein combination (IFIT3, MX1, TOMM40, STAT1, STAT2, and OAS3) exhibited good performance for SLE disease diagnosis, with AUC of 0.723 and 0.815 for distinguishing SLE from HC and RA, respectively. Nine-protein combination (PHACTR2, GOT2, L-selectin, CMC4, MAP2K1, CMPK2, ECPAS, SRA1, and STAT2) showed a robust performance in assessing disease exacerbation (AUC=0.990). Further, the potential immune cellular sources of nine PBMC biomarkers, which had the consistent changes with the proteomics data, were elucidated by PBMC scRNAseq.

Discussion: Unbiased proteomic quantification and experimental validation of PBMC samples from two cohorts of patients with SLE were identified as biomarker combinations for diagnosis and activity monitoring. Furthermore, the immune cell subtype origin of the biomarkers in the transcript expression level was determined using PBMC scRNAseq. These findings present valuable PBMC biomarkers associated with SLE and may reveal potential therapeutic targets.

Keywords: biomarker; disease diagnosis; disease exacerbation; immune cell; machine learning.


Conflict of interest statement

Author LY was employed by Guangzhou Enttxs Medical Products Co., Ltd. Author BH was employed by Reproductive and Genetic Hospital of China International Trust and Investment Corporation (CITIC)-Xiangya. The remaining authors declare that the research was conducted in the absence of any commercial or financial relationships that could be construed as a potential conflict of interest.

Figures

Figure 1
Figure 1
Proteomic Profiling of PBMC from SLE and RA patients and Health Volunteers. (A) The workflow of the study. All PBMC samples were used for 4D-LFQ proteomics analysis and ELISA analysis. (B, C) The distribution of numbers of quantified (B) peptides and (C) proteins in the 52 PBMC samples from three groups. Color dots represent multiple independent samples, SLE (n = 21), RA (n = 16), HC (n = 15). (D) The distribution of MS/MS spectral counts of quantified peptides. (E) The distribution of peptide numbers of quantified proteins. (F) The distribution of protein numbers in PBMC samples. (G) PCA of proteomic data in HC, SLE, and RA.
Figure 2
Figure 2
Differential analysis in protein expression levels between SLE and HC or RA. (A) The heatmap for the expression of PBMC proteins in SLE, RA, and HC. The expression of each proteins was normalized by Z score normalization. (B) Venn diagram summarising the differential and overlapping proteins between SLE and HC or RA (fold change(FC) > 1.5 or < 0.67, unpaired two-sided Student’s t-tests, P < 0.05). (C) Plots of fold changes of differentially expressed proteins in SLE vs. RA only, SLE vs. HC only, and SLE vs. both. (D) The enrichment score for 36 KEGG pathways by GSVA in SLE, RA, and HC. The brown and green nodes represent upregulation and downregualtion state of pathway, respectively (moderated t-test, P < 0.05). (E) The differentially activated KEGG pathways between SLE vs. RA and SLE vs. HC. The blue and purple bands represent the activated pathways of SLE vs. RA and SLE vs. HC, respectively; and the gray bands represent the unactivated pathway. (F) GSEA of complement and coagulation cascades gene sets were significantly differentially enriched between SLE and HC or RA (permutation test, P < 0.05).
Figure 3
Figure 3
PBMC proteomic data for SLE disease exacerbation. (A) PBMC proteomics profiles of STEM analysis. STEM analysis was applied to obtain the protein expression profiles across HC, SLE_I, and SLE_A. Profile ID was shown at the top left corner of the profile, and significance (P value) was shown at the bottom left corner of the profile. Red lines in each profile represent the expression pattern of proteins across HC, SLE_I, and SLE_A (permutation test, P < 0.05). (B) Heatmap for the expression of proteins in profile 10 along with disease exacerbation. (C) The function analysis of profile 10 in Metascape platform (P < 0.01).
Figure 4
Figure 4
Identification of potential biomarker combinations for the disease diagnosis and assessing disease exacerbation of SLE patients. (A) The workflow of POC-SLE, including 1000 bootstrap sampling iterations RFA and OPLS-DA. The PCA plot for distinguishing SLE and HC (B), SLE and RA (E), and SLE_A and SLE_I (H). The VIP value of potential biomarker combinations for discriminating SLE and HC (C), SLE and RA (F), SLE_A and SLE_I (I). ROC curve of the biomarker combination for disease diagnosis to differentiate SLE and HC (D), SLE and RA (G); ROC curve of the biomarker combination for assessing disease exacerbation to distinguish SLE_A and SLE_I (J).
Figure 5
Figure 5
Validation of disease diagnosis and assessing disease exacerbation biomarker combinations of SLE patients. ROC curves for the disease diagnosis of distinguishing SLE from HC (A) and SLE from RA (B). ROC curve for the assessing disease exacerbation of distinguishing SLE_A from SLE_I (C). ROC curves for distinguishing SLE_A from SLE_I using anti-DNA (D), C3 (E), and C4 (F). (G) Correlation plot of clinical parameters with biomarkers. Each square represents a correlation. A darker background indicates a lower P value, as determined by Spearman correlation. The size of the dot in each square represents the magnitude of the correlation, with a bigger dot representing higher correlation. Blue and orange dots indicate negative correlation and positive correlation, respectively.
Figure 6
Figure 6
UMAP visualization for PBMC scRNAseq and Violin plots of scRNAseq data for SLE vs. HC and active SLE vs. inactive SLE. (A) Two-dimensional integrated UMAP visualization of PBMC cells combined from 46 SLE patient and 21 HC donors. PBMC were divided into clusters based on the expression of canonical genes. (B-F) Violin plots showing the differented expression profile of five SLE disease diagnosis related genes identified between SLE and HC; (G–J) Violin plots showing the differented expression profile of four assessing disease exacerbation related genes identified between active SLE and inactive SLE (Wilcoxon rank sum test, P < 0.05). Red dot presents for HC or inactive SLE, and green dot presents for SLE or active SLE. *P < 0.05, **P < 0.01, ***P < 0.001, ****P < 0.0001, ns, not significant.

References

    1. Banchereau R, Hong S, Cantarel B, Baldwin N, Baisch J, Edens M, et al. . Personalized immunomonitoring uncovers molecular networks that stratify lupus patients. Cell (2016) 165(3):551–65. doi: 10.1016/j.cell.2016.03.008 - DOI - PMC - PubMed
    1. Tsokos GC. Systemic lupus erythematosus. N Engl J Med (2011) 365(22):2110–21. doi: 10.1056/NEJMra1100359 - DOI - PubMed
    1. Vanarsa K, Soomro S, Zhang T, Strachan B, Pedroza C, Nidhi M, et al. . Quantitative planar array screen of 1000 proteins uncovers novel urinary protein biomarkers of lupus nephritis. Ann rheumatic Dis (2020) 79(10):1349–61. doi: 10.1136/annrheumdis-2019-216312 - DOI - PMC - PubMed
    1. Mejia-Vilet JM, Zhang XL, Cruz C, Cano-Verduzco ML, Shapiro JP, Nagaraja HN, et al. . Urinary soluble Cd163: A novel noninvasive biomarker of activity for lupus nephritis. J Am Soc Nephrol JASN (2020) 31(6):1335–47. doi: 10.1681/asn.2019121285 - DOI - PMC - PubMed
    1. Enocsson H, Wirestam L, Dahle C, Padyukov L, Jönsen A, Urowitz MB, et al. . Soluble urokinase plasminogen activator receptor (Supar) levels predict damage accrual in patients with recent-onset systemic lupus erythematosus. J Autoimmun (2020) 106:102340. doi: 10.1016/j.jaut.2019.102340 - DOI - PubMed

Publication types