

The European Union One Health 2021 Zoonoses Report
- PMID: 36524203
- PMCID: PMC9745727
- DOI: 10.2903/j.efsa.2022.7666
The European Union One Health 2021 Zoonoses Report
Abstract
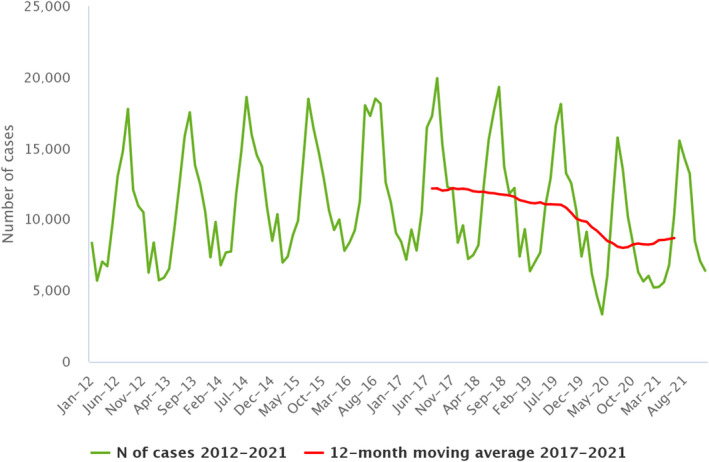
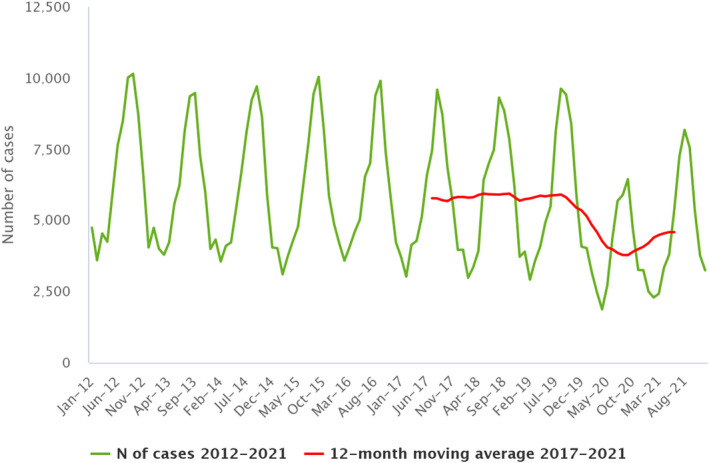
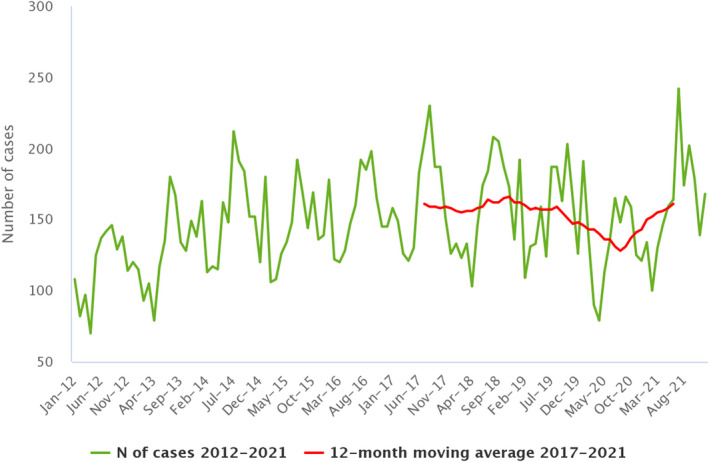
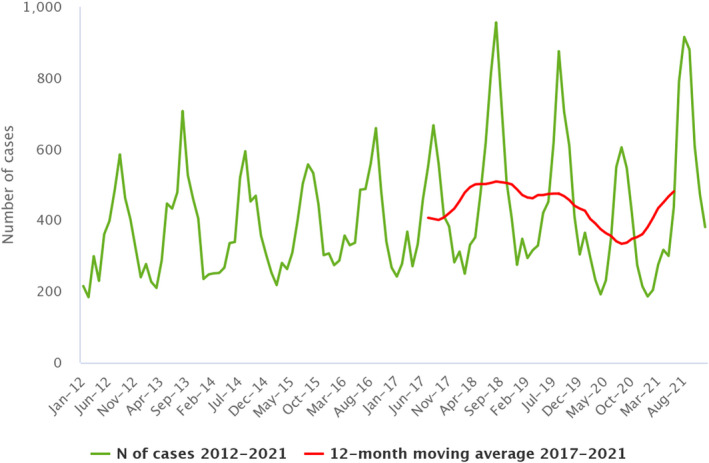
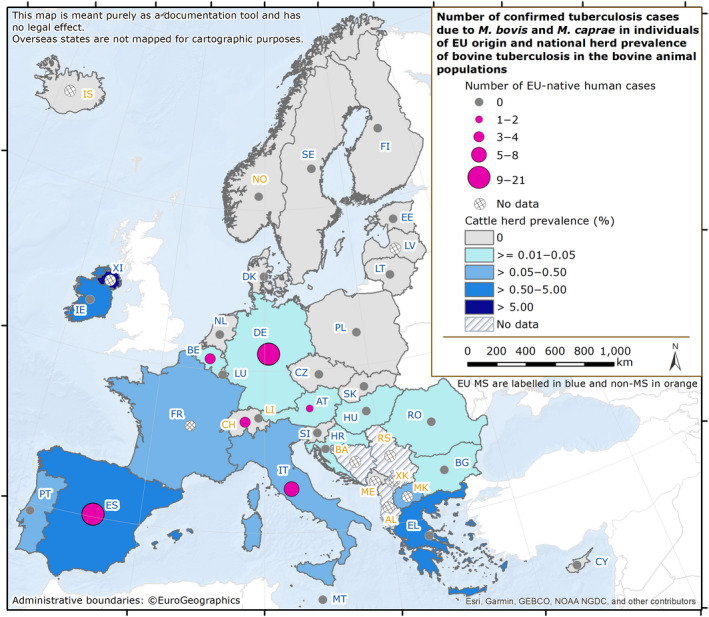
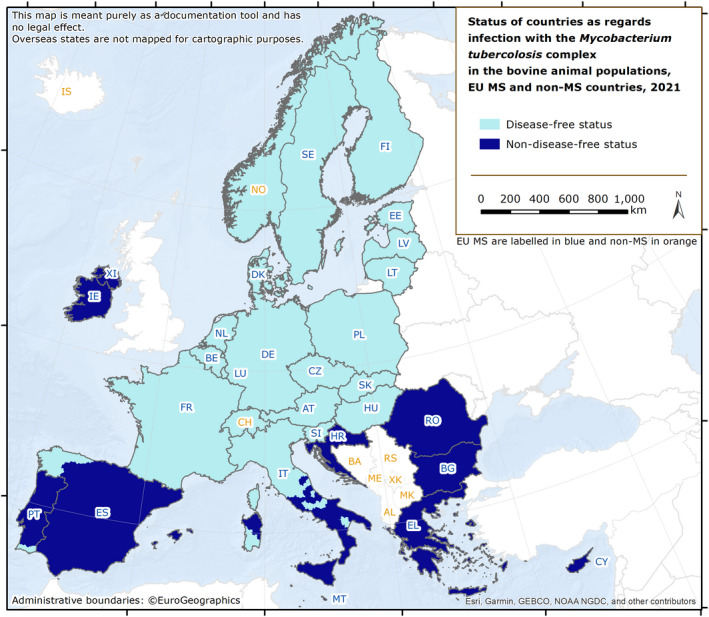
This report of the European Food Safety Authority and the European Centre for Disease Prevention and Control presents the results of zoonoses monitoring and surveillance activities carried out in 2021 in 27 MSs, the United Kingdom (Northern Ireland) and nine non-MSs. Key statistics on zoonoses and zoonotic agents in humans, food, animals and feed are provided and interpreted historically. In 2021, the first and second most reported zoonoses in humans were campylobacteriosis and salmonellosis, respectively. Cases of campylobacteriosis and salmonellosis increased in comparison with 2020, but decreased compared with previous years. In 2021, data collection and analysis at the EU level were still impacted by the COVID-19 pandemic and the control measures adopted in the MSs, including partial or total lockdowns. Sixteen MSs and the United Kingdom (Northern Ireland) achieved all the established targets in poultry populations for reduction in Salmonella prevalence for the relevant serovars. Salmonella samples from carcases of various animal species and samples for Campylobacter quantification from broiler carcases were more frequently positive when performed by the competent authorities than when own-checks were conducted. Yersiniosis was the third most reported zoonosis in humans, followed by Shiga toxin-producing Escherichia coli (STEC) and Listeria monocytogenes infections. L. monocytogenes and West Nile virus infections were the most severe zoonotic diseases, with the most hospitalisations and highest case fatality rates. Overall, MSs reported more foodborne outbreaks and cases in 2021 than in 2020. S. Enteritidis remained the most frequently reported causative agent for foodborne outbreaks. Salmonella in 'eggs and egg products' and in 'mixed foods' were the agent/food pairs of most concern. Outbreaks linked to 'vegetables and juices and products thereof' rose considerably compared with previous years. This report also provides updates on brucellosis, Coxiella burnetii (Q fever), echinococcosis, rabies, toxoplasmosis, trichinellosis, tuberculosis due to Mycobacterium bovis or M. caprae, and tularaemia.
Keywords: Campylobacter; Listeria; Salmonella; foodborne outbreaks; monitoring; parasites; zoonoses.
© 2022 European Food Safety Authority and European Centre for Disease Prevention and Control.
Figures
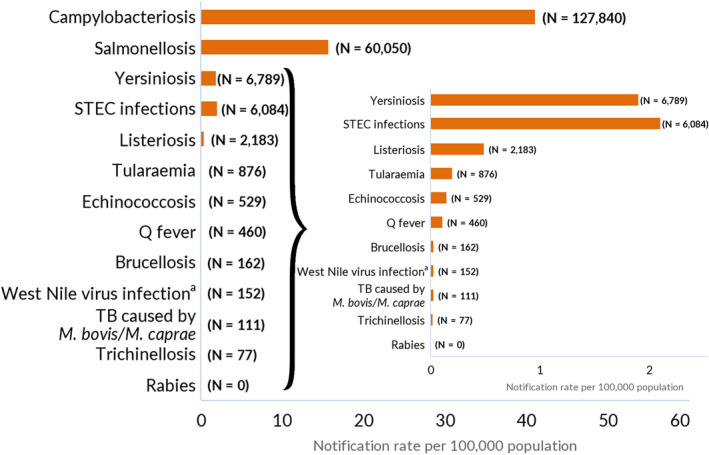
Data on congenital toxoplasmosis are not shown since 2021 data are not available yet.
Note: The total number of confirmed cases is indicated in parentheses at the end of each bar.
(a) Regarding West Nile virus infection, the total number of locally acquired cases was used (includes probable and confirmed cases).
Source: Austria, Cyprus, Czechia, Denmark, Estonia, Finland, France, Germany, Hungary, Ireland, Italy, Latvia, Luxembourg, Malta, the Netherlands, Poland, Romania, Slovenia and Sweden.
Source: Austria, Belgium, Cyprus, Czechia, Denmark, Estonia, Germany, Greece, Finland, France, Hungary, Ireland, Italy, Luxembourg, Latvia, Malta, the Netherlands, Poland, Portugal, Romania, Sweden, Slovenia and Slovakia.
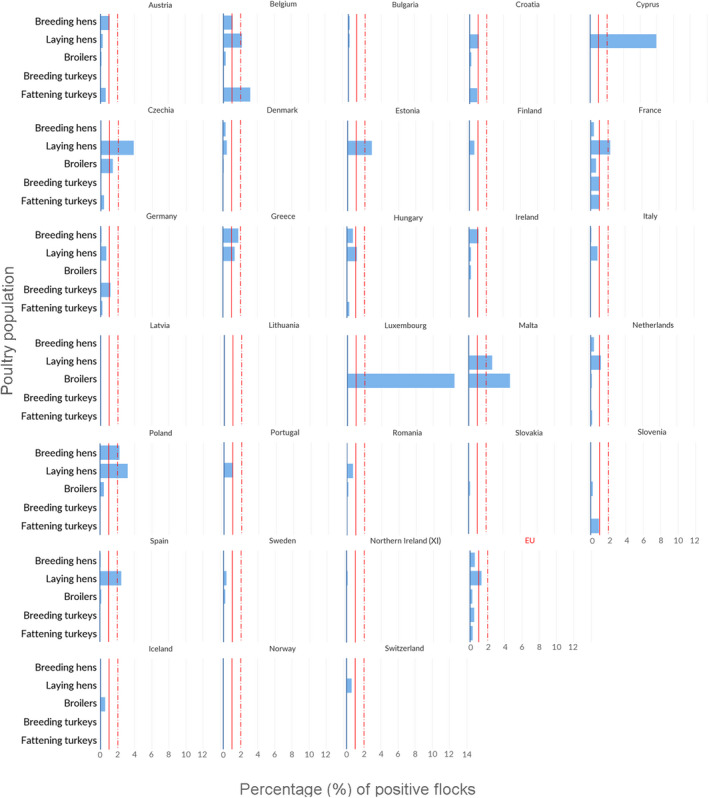
Vertical bars indicate the target to be reached, which was set at 1% for all poultry populations with the exception of laying hens, for which it was 2%.
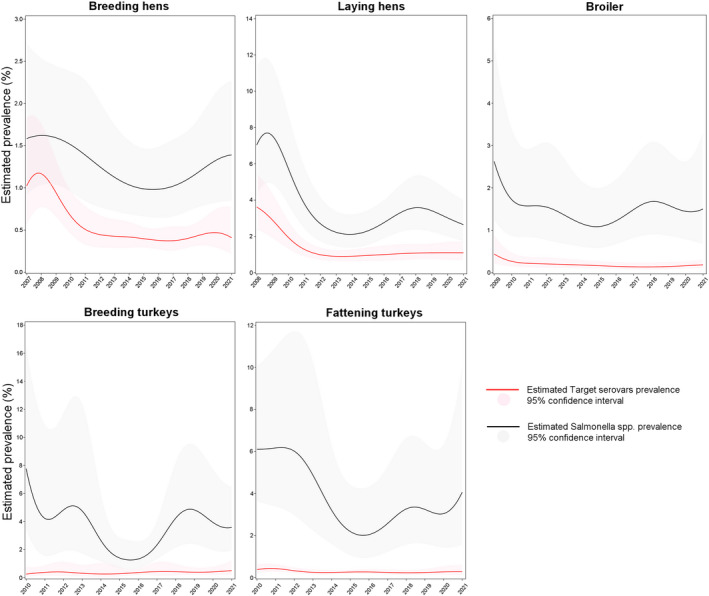
Source: Austria, Belgium, Czechia, Germany, Denmark, Estonia, Greece, Finland, Hungary, Ireland, Italy, Latvia, Malta, the Netherlands, Portugal, Sweden and Slovakia.
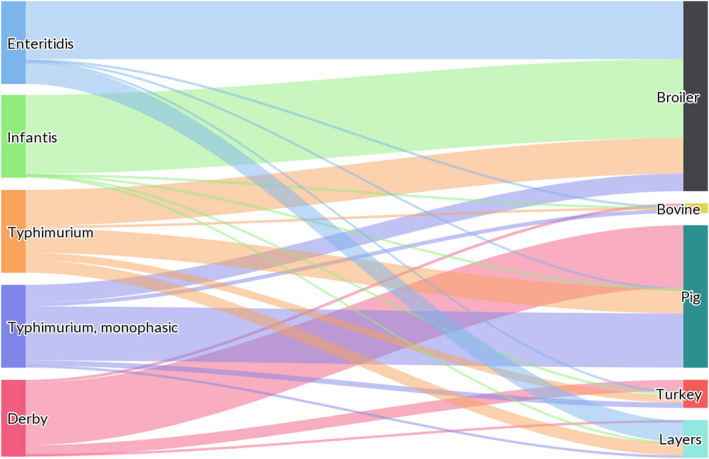
The left side of the diagram shows the five most commonly reported Salmonella serovars involved in human salmonellosis cases acquired in the EU: S. Enteritidis (blue), S. Infantis (green), S. Typhimurium (orange), monophasic S. Typhimurium (1,4,[5],12:i:‐) (violet) and S. Derby (magenta). Animal and food data from the same source were merged: ‘broiler’ includes isolates from broiler flocks and broiler meat, ‘bovine' includes isolates from bovines for meat production and from bovine meat, ‘pig’ includes isolates from fattening pigs and pig meat, ‘turkey’ includes isolates from fattening turkey flocks and turkey meat and ‘layers’ includes isolates from laying hen flocks and eggs. The right side shows the five sources considered (broilers, bovines, pigs, turkeys and layers). The width of the coloured bands linking the sources and serovars is proportional to the percentage of isolates of each serovar from each source.
Source: Austria, Belgium, Czechia, Cyprus, Denmark, Estonia, Finland, France, Germany, Greece, Hungary, Ireland, Italy, Latvia, Lithuania, Malta, Netherlands, Poland, Romania, Slovakia, Slovenia and Sweden.
Source: Austria, Cyprus, Denmark, Estonia, Finland, France, Germany, Greece, Ireland, Italy, Lithuania, Luxembourg, Malta, Netherlands, Poland, Romania, Slovenia and Sweden.
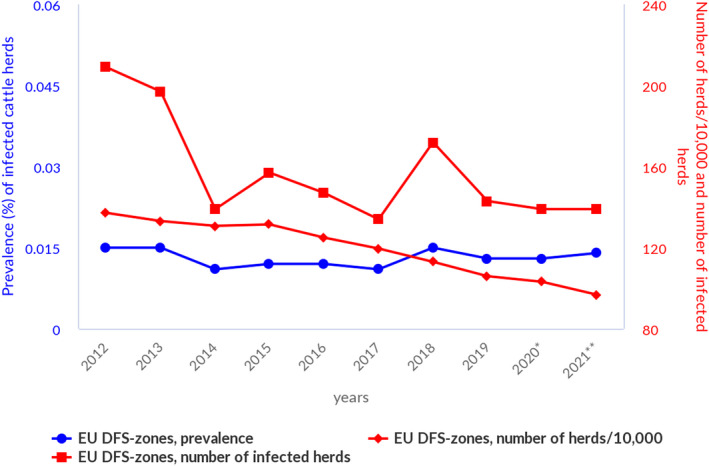
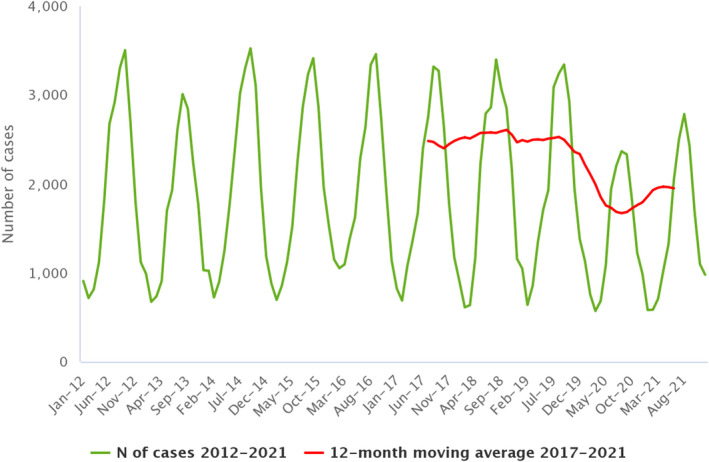
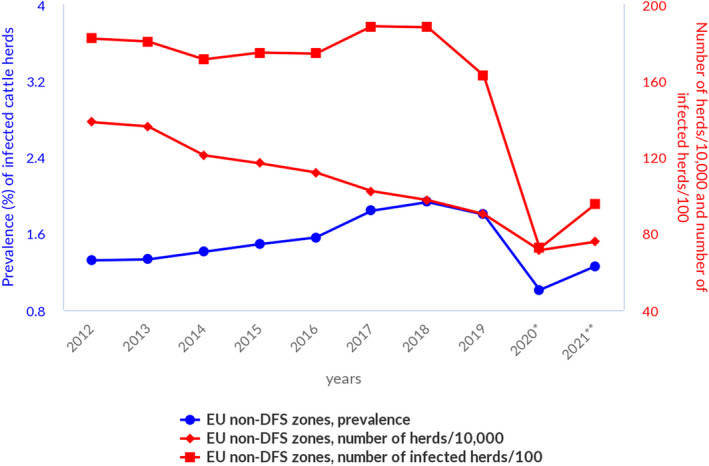
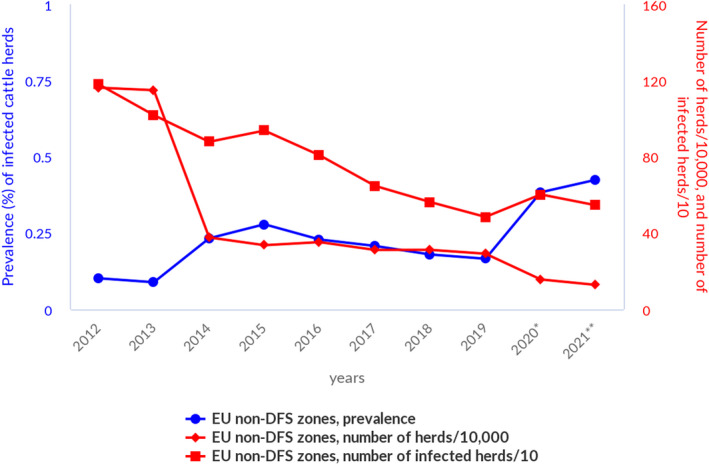
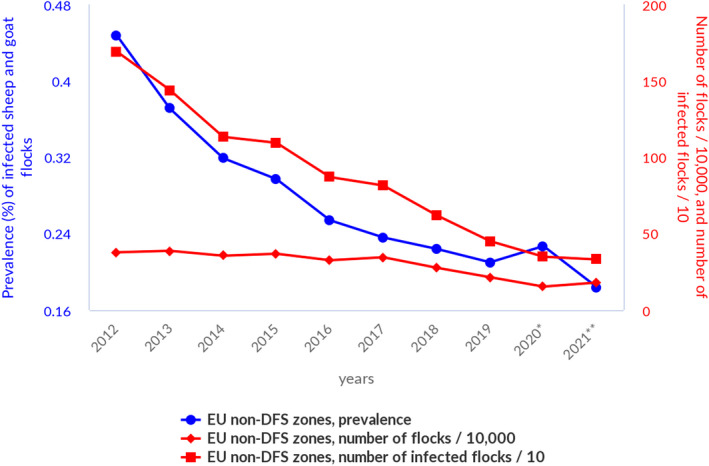
(*): In contrast to years 2012–2019, the year 2020 does not include United Kingdom data. Since 1 February 2020, the United Kingdom has withdrawn from the EU and has become a third country. (**): In accordance with the agreement on the withdrawal of the United Kingdom from the EU, and in particular with the Protocol on Ireland/Northern Ireland, the European Union requirements on data sampling also apply to Northern Ireland.
(*): In contrast to years 2012–2019, the year 2020 does not include the United Kingdom data. Since 1 February 2020, the United Kingdom has withdrawn from the EU and has become a third country. No data were reported from Bulgaria. (**): In accordance with the agreement on the withdrawal of the United Kingdom from the EU, and in particular with the Protocol on Ireland/Northern Ireland, the European Union requirements on data sampling also apply to Northern Ireland.
Source: Austria, Cyprus, Czechia, Estonia, Finland, France, Germany, Greece, Hungary, Ireland, Italy, Lithuania, Latvia, Malta, Netherlands, Poland, Portugal, Romania, Slovakia, Slovenia and Sweden.
Source: Austria, Cyprus, Czechia, Estonia, Finland, France, Germany, Greece, Hungary, Ireland, Italy, Latvia, Lithuania, Luxembourg, Malta, Poland, Portugal, Romania, Slovakia, Slovenia, Spain and Sweden.
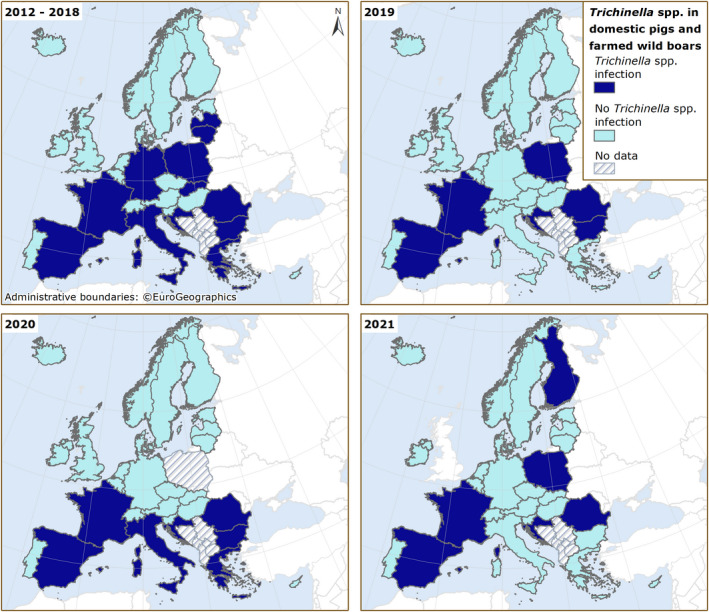
These distribution maps have been built based on data from reports (EFSA and ECDC (European Food Safety Authority and European Centre for Disease Prevention Control), 2015a,b, 2016, 2017).In 2021, Bulgaria did not report data on pigs NRCHC.
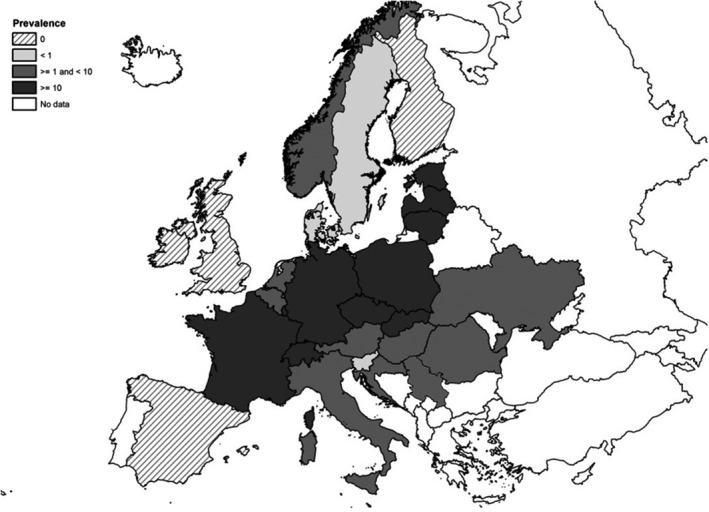
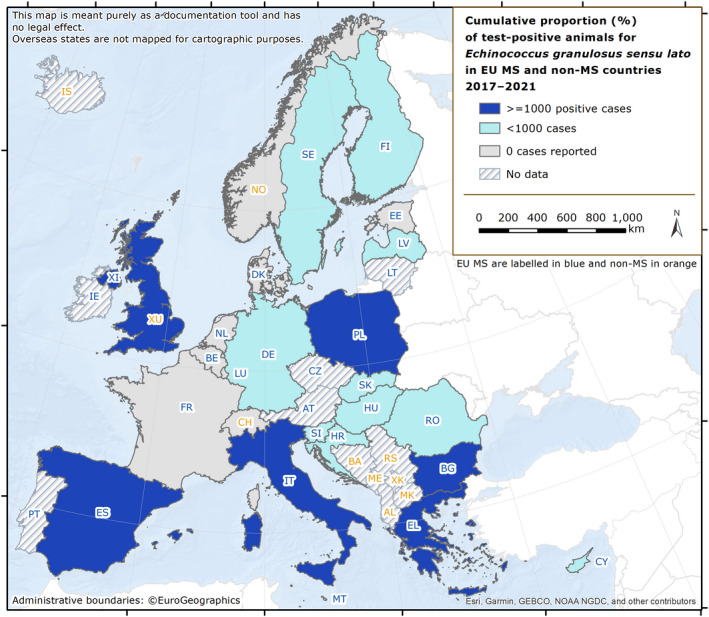
Intermediate hosts included on the map are cattle, deer, goats, horses, moose, mouflons, pigs, reindeer, sheep, water buffalos and wild boars. It should be stressed that pigs are intermediate hosts for both E. multilocularis and E. granulosus s.l. For this reason, data from pigs were excluded from co‐endemic countries – Poland, Romania, Slovakia and Slovenia – where Echinococcus species information was not reported.Spain (N = 302,433), Italy, (N = 248,530), United Kingdom (N = 71,861), Greece (N = 53,140), Bulgaria (N = 12,214), Poland (N = 2,630) and Slovakia (N = 995) were the countries with the highest endemicity for E. granulosus s.l. in the EU in 2017–2021.
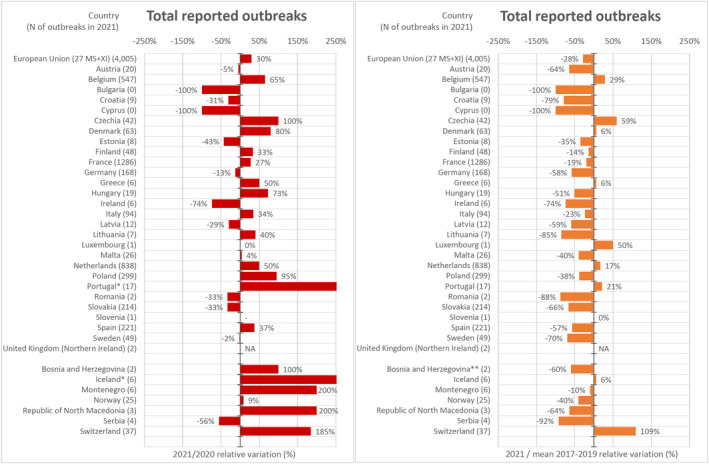
* 2021/2020 relative variation for Portugal was 325% and for Iceland was 500%. ** The mean annual total of FBOs reported by Bosnia and Herzegovina was calculated considering only the years 2017–2018, since no FBO data were reported in 2019.
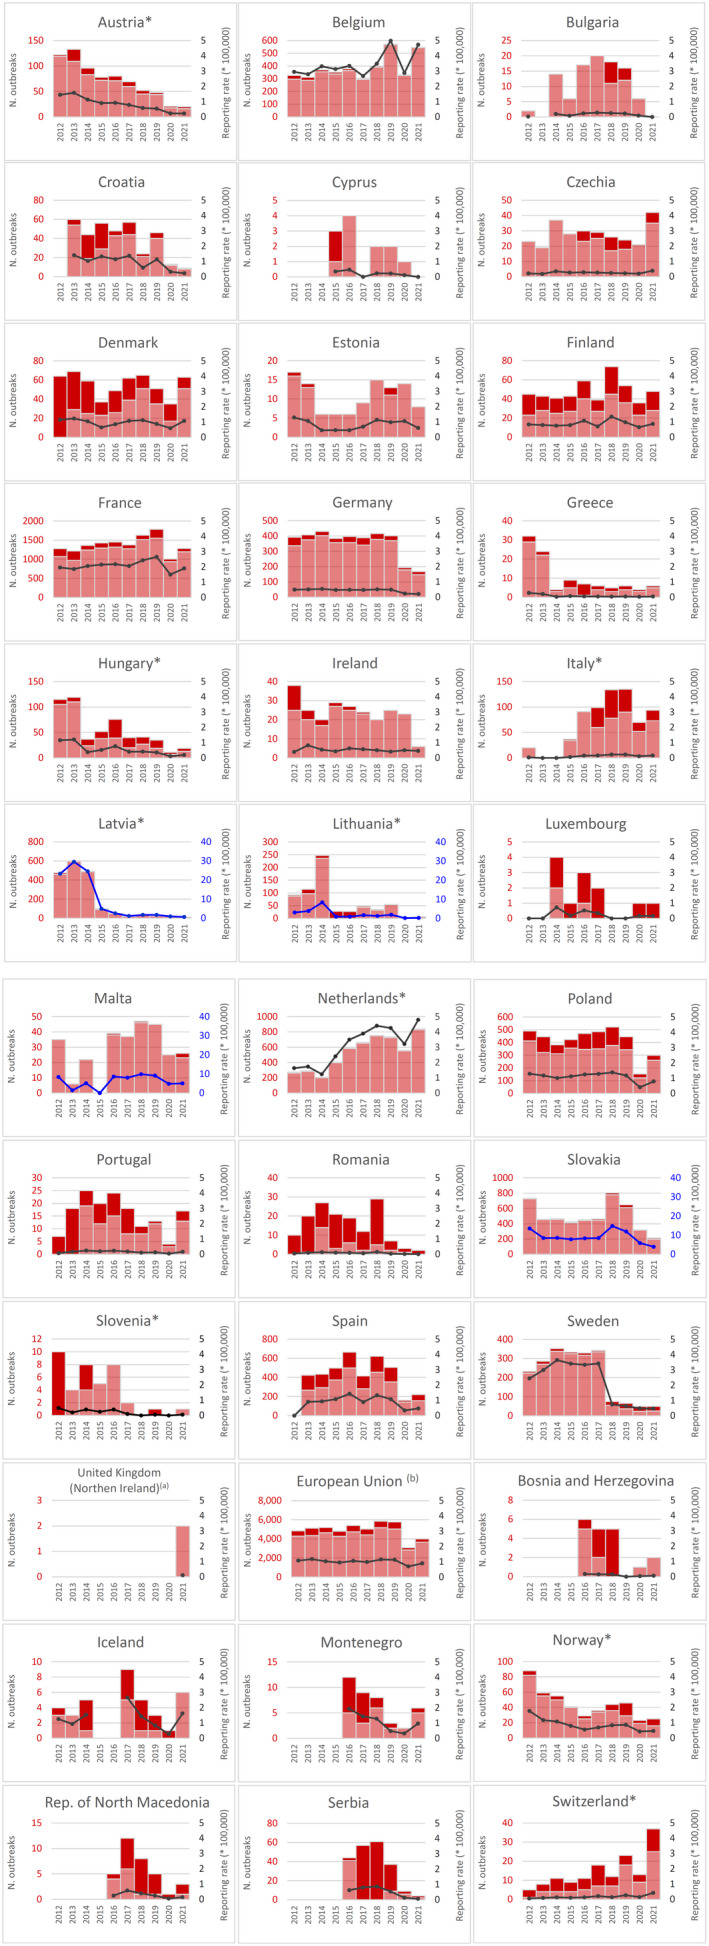
Note: * indicates countries with a statistically significant trend (p < 0.05) over the period. Dark red and light red show strong‐ and weak‐evidence outbreaks, respectively. Black dots and lines show FBO reporting rates. The dots, lines and secondary Y‐axis in blue showing the outbreak reporting rates have been used for Latvia, Lithuania, Malta and Slovakia, in order to draw attention to a scale that is different to that of the other countries. (a): Data on FBOs from the United Kingdom (Northern Ireland) are taken into account for 2021. In accordance with the agreement on the withdrawal of the United Kingdom from the EU, and in particular with the Protocol on Ireland/Northern Ireland, the EU requirements on data sampling are also applicable to Northern Ireland. (b): Data on FBOs from the United Kingdom are taken into account for 2017–2019, because the United Kingdom was an EU MS, but it became a third country on 1 February 2020.
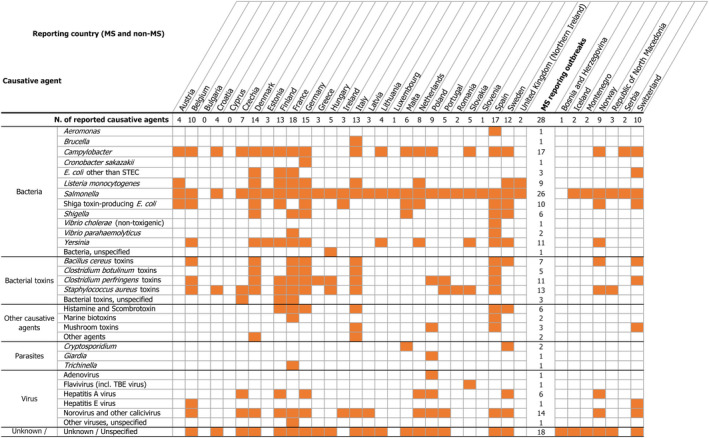
The table may be read by column (country) or by row (causative agent). The number at the end of each row is the number of countries reporting a given causative agent for outbreaks in 2021, while the number at the top of each column indicates the number of causative agents identified in outbreaks by a given country in 2021. ‘Escherichia coli’ other than STEC includes Enteroinvasive E. coli (EIEC), Enterotoxigenic E. coli (ETEC) and E. coli, unspecified. ‘Bacillus toxins’ include Bacillus cereus, Bacillus cereus enterotoxins. ‘Staphylococcus aureus toxins’ include staphylococcal enterotoxins. ‘Norovirus (and other calicivirus)’ include norovirus (Norwalk‐like virus) and calicivirus unspecified. ‘Marine biotoxins’ include ciguatoxin and other unspecified marine toxins. ‘Other agents’ include atropine and lectin.
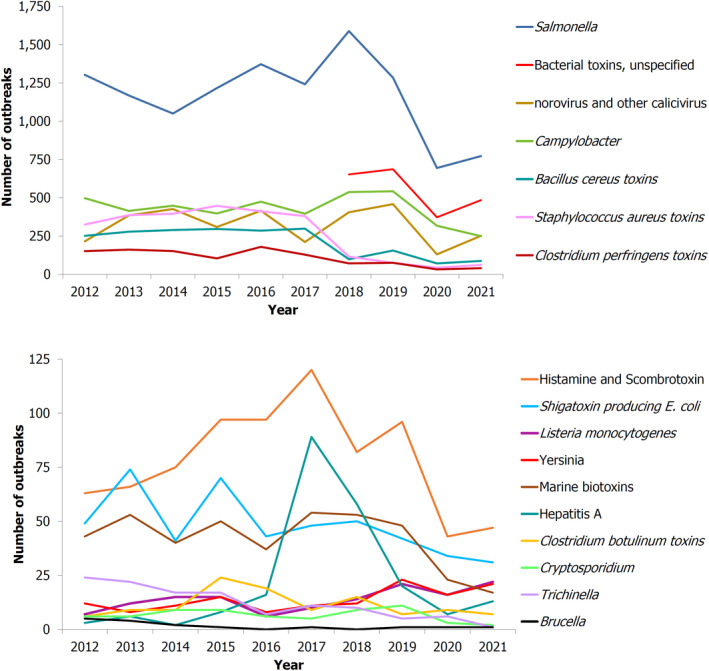
Note: Outbreaks reported by the United Kingdom are included for the years 2012–2019. However, data from United Kingdom (Northern Ireland) are taken into account for 2021. In accordance with the agreement on the withdrawal of the United Kingdom from the EU, and in particular with the Protocol on Ireland/Northern Ireland, the EU requirements on data sampling are also applicable to Northern Ireland.
‘Marine biotoxins’ include ciguatoxin, muscle‐paralysing toxin, okadaic acid.
‘Norovirus (and other calicivirus)’ include norovirus (Norwalk‐like virus), sapovirus (Sapporo‐like virus) and calicivirus unspecified.
‘Other bacterial agents’ include Aeromonas, Arcobacter, Cronobacter sakazakii, E. coli other than STEC, Enterococcus, Francisella, Leptospira, Shigella, Streptococcus, non‐toxigenic Vibrio cholerae, Vibrio parahaemolyticus and other unspecified bacterial agents.
Source: Austria, Czechia, Denmark, Estonia, Finland, Germany, Hungary, Ireland, Italy, Latvia, Luxembourg, Malta, Poland, Romania, Slovakia, Slovenia and Sweden.
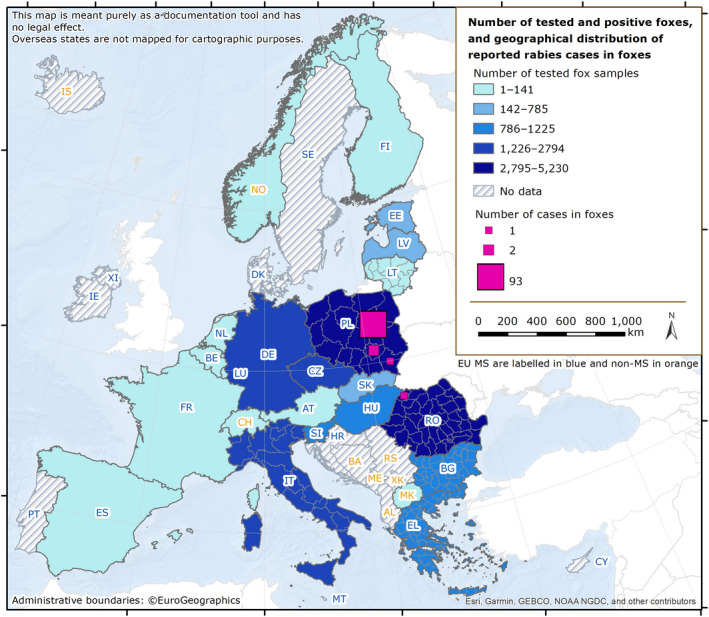
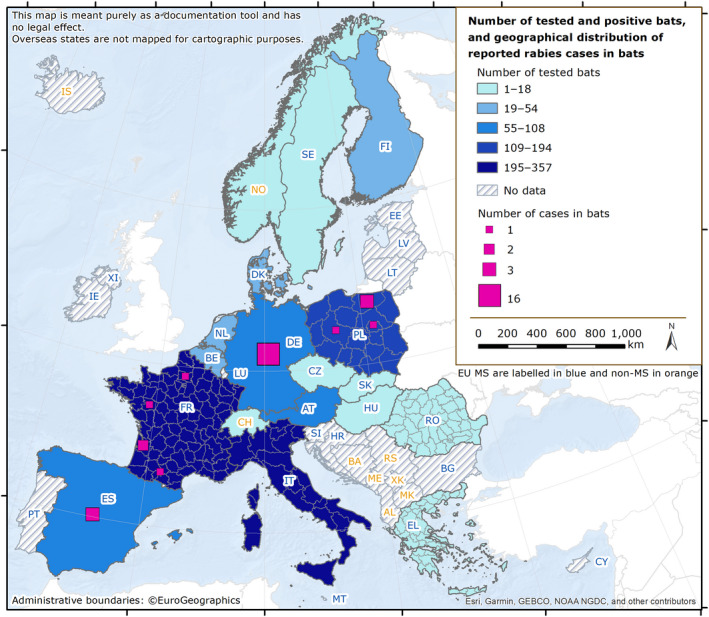
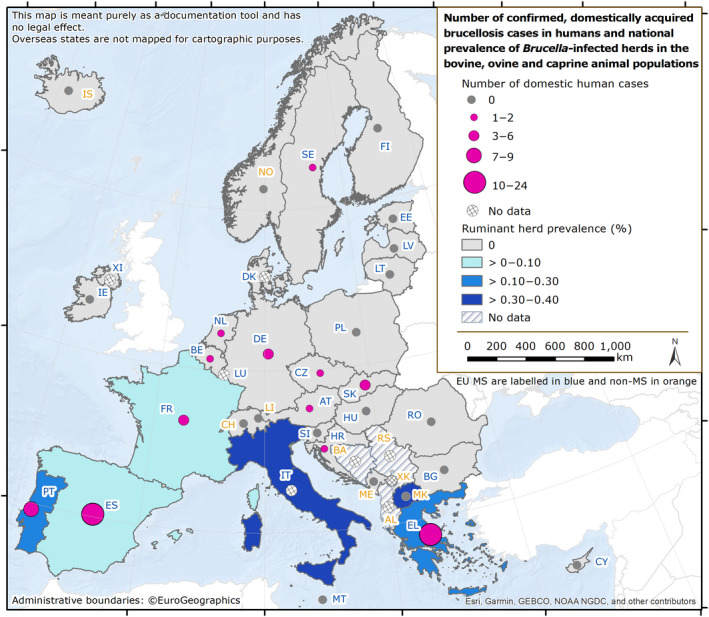
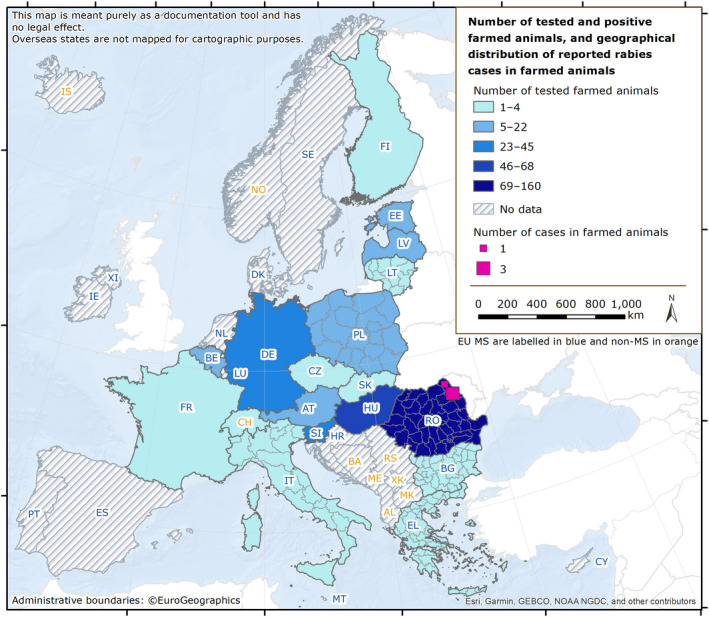
For Germany and Spain, the geographical distribution of reported cases was not provided.
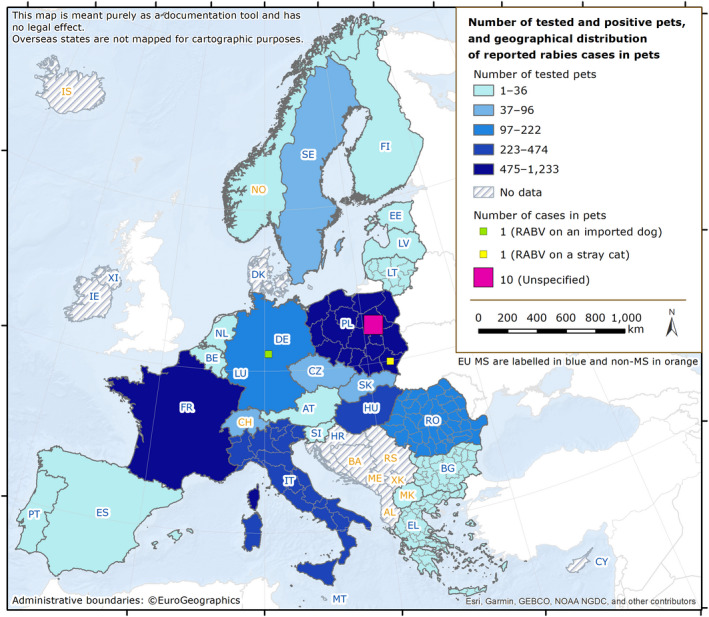
For Germany, the geographical distribution of the reported case was not provided.
Source: Data from Cyprus, Czechia, Estonia, Finland, France, Germany, Greece, Hungary, Ireland, Latvia, Lithuania, Malta, the Netherlands, Poland, Portugal, Romania, Slovakia, Slovenia and Sweden. Austria, Belgium, Bulgaria, Croatia, Denmark, Italy, Luxembourg and Spain did not report data at the level of detail required for the analysis.
Source: Austria, Belgium, Bulgaria, Cyprus, Czechia, Estonia, Greece, Spain, Finland, France, Hungary, Ireland, Italy, Lithuania, Luxembourg, Latvia, Malta, Netherlands, Poland, Portugal, Romania, Sweden, Slovenia, Slovakia.
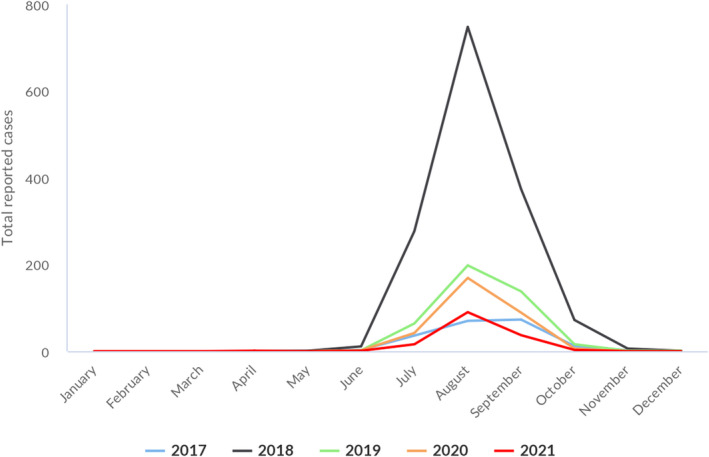
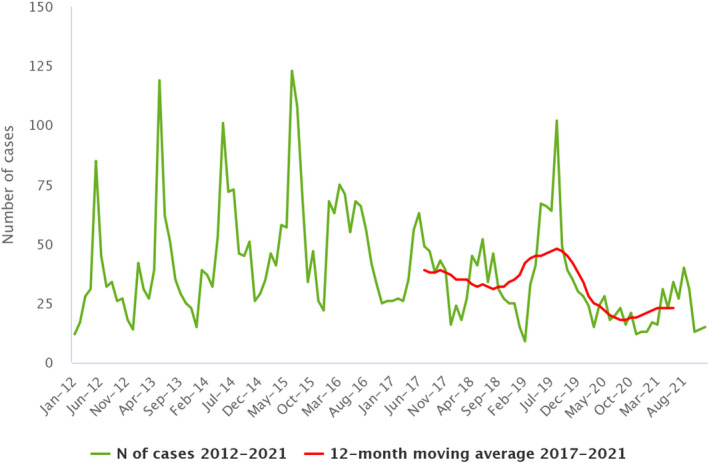
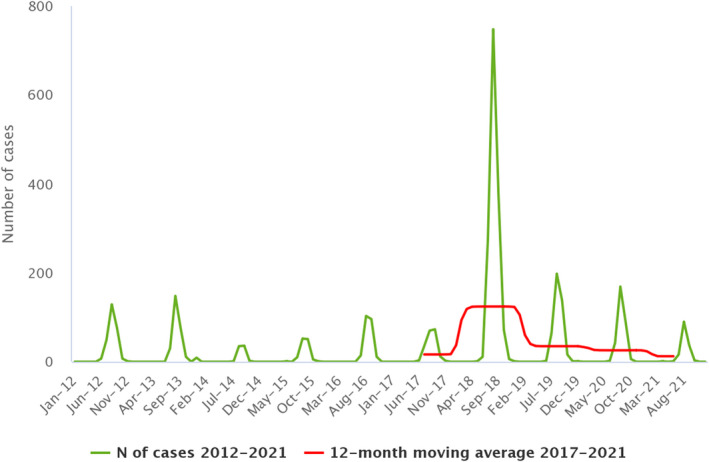
The data set includes only locally acquired WNF cases and only countries that consistently reported cases (or reported zero cases) over the whole reporting period (last 5 years) and to the level of detail required for trend analysis (not aggregated).
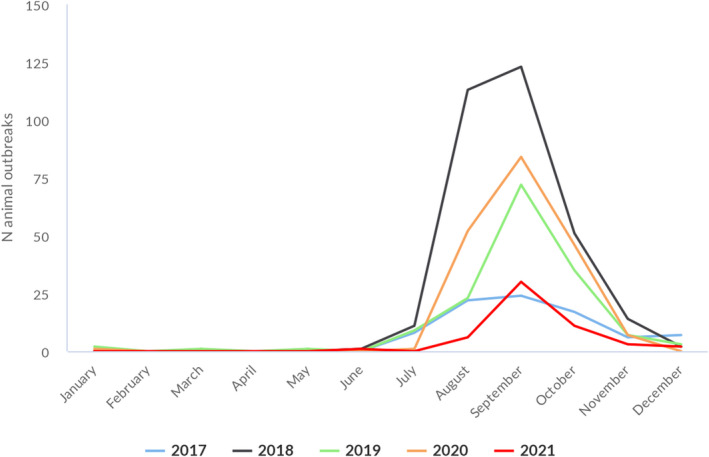
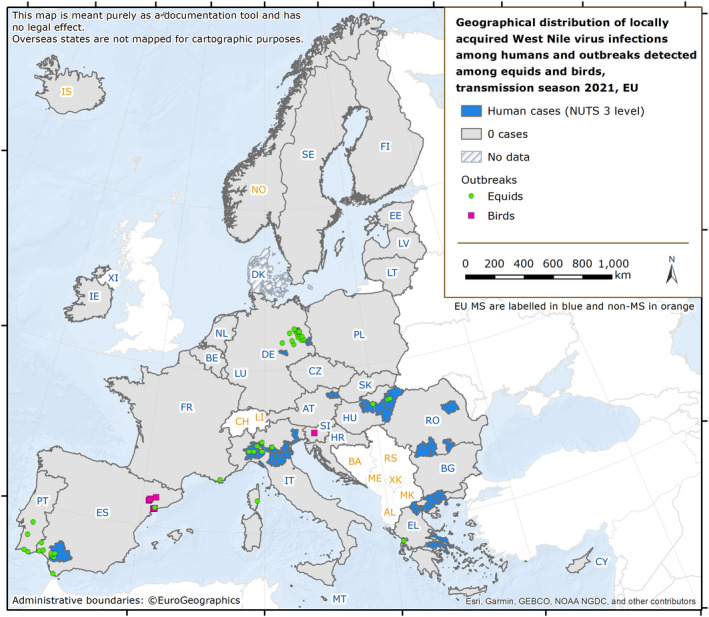
Data source: ADIS for animal outbreaks. Outbreaks in birds or equids that were not notified to ADIS are not included.
The dataset includes only locally acquired WNF cases and only countries that consistently reported cases (or reported zero cases) over the whole reporting period (last 5 years) and to the level of detail required for trend analysis (not aggregated).
Source: Austria, Cyprus, Czechia, Estonia, Finland, France, Germany, Greece, Hungary, Ireland, Latvia, Luxembourg, Malta, Poland, Romania, Slovakia, Slovenia, Spain and Sweden. Belgium, Bulgaria, Croatia, Denmark, Italy, Lithuania, the Netherlands and Portugal did not report data to the level of detail required for the analysis.
References
-
- Adamse P, Van Egmond H, Noordam M, Mulder P and De Nijs M, 2014. Tropane alkaloids in food: poisoning incidents. Quality Assurance and Safety of Crops & Foods, 6, 15–24. 10.3920/QAS2013.0314 - DOI
-
- Alban L, Pozio E, Boes J, Boireau P, Boué F, Claes M, Cook AJ, Dorny P, Enemark HL, van der Giessen J, Hunt KR, Howell M, Kirjusina M, Nöckler K, Rossi P, Smith GC, Snow L, Taylor MA, Theodoropoulos G, Vallée I, Viera‐Pinto MM and Zimmer IA, 2011. Towards a standardised surveillance for Trichinella in the European Union. Prev Vet Med, 99, 148–160. 10.1016/j.prevetmed.2011.02.008 - DOI - PubMed
LinkOut - more resources
Full Text Sources