. 2022 Dec;34(5):1876-1886.
doi: 10.1017/S0954579422000761. Epub 2022 Dec 16.

The estimation of environmental and genetic parental influences

Affiliations

The estimation of environmental and genetic parental influences

Jared V Balbona et al. Dev Psychopathol. 2022 Dec.

Abstract

Parents share half of their genes with their children, but they also share background social factors and actively help shape their child's environment - making it difficult to disentangle genetic and environmental causes of parent-offspring similarity. While adoption and extended twin family designs have been extremely useful for distinguishing genetic and nongenetic parental influences, these designs entail stringent assumptions about phenotypic similarity between relatives and require samples that are difficult to collect and therefore are typically small and not publicly shared. Here, we describe these traditional designs, as well as modern approaches that use large, publicly available genome-wide data sets to estimate parental effects. We focus in particular on an approach we recently developed, structural equation modeling (SEM)-polygenic score (PGS), that instantiates the logic of modern PGS-based methods within the flexible SEM framework used in traditional designs. Genetically informative designs such as SEM-PGS rely on different and, in some cases, less rigid assumptions than traditional approaches; thus, they allow researchers to capitalize on new data sources and answer questions that could not previously be investigated. We believe that SEM-PGS and similar approaches can lead to improved insight into how nature and nurture combine to create the incredible diversity underlying human behavior.

Keywords: genetic nurture; heritability; nature and nurture; parental effects; vertical transmission.


Conflict of interest statement

Conflict of interest. None.

Figures

Figure 1.
Figure 1.
The co-occurrence of genetic transmission and vertical transmission will necessarily result in passive gene–environment covariance. In this example, highly educated parents provide to their child not only genes conducive to higher education but also a rearing environment that values and prioritizes education. This environment may include parental activities such as reading to the child, assisting with homework, or encouraging a positive attitude toward schooling. Thus, the offspring’s environment is influenced by the parental genes, causing the offspring’s genes and environment to be correlated with one another rather than independent – a phenomenon termed “passive GE correlation” (or more recently, “genetic nurture”) in the behavioral genetics literature.
Figure 2.
Figure 2.
An illustration of how extended twin family designs build upon the classical twin design framework. The classical twin design (shown above in blue) compares covariances between identical/monozygotic (MZ) and fraternal/dizygotic (DZ) twins’ traits in order to estimate three sources of trait variation: (1) additive genetic factors, which are shared completely by identical twins and 50% by fraternal twins; (2) common/shared environmental factors, which are completely shared by both identical and fraternal twin pairs; and (3) unique/nonshared environmental factors, which are definitionally unique to each individual. By adding in twins’ offspring (shown in pink), the model becomes a Children of Twins design, in which vertical transmission and genetic nurture are estimable. Finally, incorporating the twins’ partners (shown in green), provides additional information on vertical transmission/genetic nurture and allows for the effects of assortative mating to be fully accounted for, avoiding a potentially large source of bias; in lieu of the twins’ partners this information can also be obtained by modeling data from the twins’ parents.
Figure 3.
Figure 3.
Schematic of the Kong et al. approach (adapted from Kong et al., 2018) For each parents-offspring trio in their sample, Kong et al. constructed four PGSs (each illustrated above as semi-ellipses): Two from the portion of the genome that parents transmitted to their child (depicted using solid colors) and two from the portion of the genome that parents did not transmit to their children (depicted as striped). Both the transmitted and nontransmitted PGS’s directly influence the parental traits, which in turn have an effect on the offspring’s phenotype via vertical transmission/genetic nurture. However, only the two transmitted PGSs – which together form the offspring’s full PGS – have a direct effect on the offspring trait that is not mediated by the familial environment. Thus, by comparing the transmitted and nontransmitted PGSs’ associations with the offspring’s phenotype, researchers can estimate the relative magnitudes of genetic nurture and direct genetic effects.
Figure 4.
Figure 4.
Assortative mating increases the phenotypic variance in a population and will lead to correlated genotypes within and between mates. (a) Adapted from Kong et al. (2018). For heritable traits, assortative mating implies that mates have correlated genotypes. Therefore, a single generation of assortment (i.e., in the offspring’s parental generation) will lead to covariances between parents’ genotypes, such that the genes inherited from one parent will covary with the genes inherited from the other parent. If assortment has occurred for more than one generation (i.e., in both the parental and grandparental generations and perhaps before), the genes inherited from one parent will also be correlated with the other genes inherited from that same parent. For example, the genes originally passed down from one’s maternal grandmother will be correlated with those from their maternal grandfather, both of which are later transmitted to the offspring by their mother. (b) For a random mating population, quantitative traits – in this example, hue from blue to red – will adopt a normal distribution over time, such that most people will fall somewhere in the middle of the trait’s distribution with few individuals on the extremes. Conversely, the variation in traits under assortative mating will increase because alleles of similar effects will tend to congregate in the same genomes. At the extreme, as illustrated here, trait distributions can become bimodal over time (although assortative mating this extreme is probably rare).
Figure 5.
Figure 5.
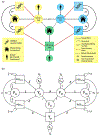
SEM-PGS utilizes many of the same constructs used in extended twin family designs and obtains its estimates via path tracing. (a) As shown, many of the elements of the SEM-PGS models are also common to extended twin family designs. As with extended twin family designs, SEM-PGS models each individual’s additive genetic effects, their familial environmental effects, and the covariance between the two (i.e., genetic nurture). Both approaches also model the effects of the individuals’ unique/nonshared environments and use data on partners (in this case, the offspring’s parents) to account for assortative mating. Of course, they differ from extended twin family designs in their utilization of measured genetic data – specifically their use of transmitted (shown as solid colors) and nontransmitted (shown as striped) PGSs as hypothesized sources of phenotypic variation. (b) SEMs can be depicted using path diagrams, such as the one shown above, in which hypothesized relationships between observed variables are shown. In path diagrams, single-headed arrows signify causal relationships from one variable to another, with their associated path coefficients (e.g., δ above) being akin to partial regression coefficients. Double-headed arrows, meanwhile, signify covariances between two variables, or variances when connecting a variable to itself. To determine expected (co)variances between two variables using a path diagram, one must identify all ‘legitimate’ paths – that is, paths which abide by a given set of rules (described in Balbona et al., 2021 and elsewhere) – that connect the two variables (for expected covariances) or that connect a variable to itself (for expected variances). For example, in examining the covariance between PGSNT,p and Yo, one of the legitimate paths would be PGSNT,P → Yp → Fo → Yo, one of the genetic nurture paths. Another path would be PGSNT,P → Yp → Ym → PGST,p → Yo, illustrating how assortative mating induces a correlation between nontransmitted alleles and the offspring trait via the transmitted alleles.

References

    1. Balbona JV, Kim Y, & Keller MC (2021). Estimation of parental effects using polygenic scores. Behavior Genetics. 10.1007/s10519-020-10032-w - DOI - PMC - PubMed
    1. Boker S, Neale M, Maes H, Wilde M, Spiegel M, Brick T, Spies J, Estabrook R, Kenny S, Bates T, Mehta P, & Fox J (2011). OpenMx: An open source extended structural equation modeling framework. Psychometrika, 76(2), 306–317. 10.1007/s11336-010-9200-6 - DOI - PMC - PubMed
    1. Cloninger CR, Rice J, & Reich T (1979). Multifactorial inheritance with cultural transmission and assortative mating. II. A general model of combined polygenic and cultural inheritance. American Journal of Human Genetics, 31(2), 176–198. - PMC - PubMed
    1. Cooper B (2001). Nature, nurture and mental disorder: Old concepts in the new millennium. The British Journal of Psychiatry, 178(S40), s91–s101. 10.1192/bjp.178.40.s91 - DOI - PubMed
    1. Copeland WE, Alaie I, Jonsson U, & Shanahan L (2021). Associations of childhood and adolescent depression with adult psychiatric and functional outcomes. Journal of the American Academy of Child & Adolescent Psychiatry, 60(5), 604–611. 10.1016/j.jaac.2020.07.895 - DOI - PMC - PubMed