. 2023 Apr;66(4):754-767.
doi: 10.1007/s00125-022-05851-x. Epub 2022 Dec 16.

Empagliflozin protects mice against diet-induced obesity, insulin resistance and hepatic steatosis

Affiliations

Empagliflozin protects mice against diet-induced obesity, insulin resistance and hepatic steatosis

Bernhard Radlinger et al. Diabetologia. 2023 Apr.

Abstract

Aims/hypothesis: Sodium-glucose cotransporter 2 (SGLT2) inhibitors are widely used in the treatment of type 2 diabetes, heart failure and chronic kidney disease. Their role in the prevention of diet-induced metabolic deteriorations, such as obesity, insulin resistance and fatty liver disease, has not been defined yet. In this study we set out to test whether empagliflozin prevents weight gain and metabolic dysfunction in a mouse model of diet-induced obesity and insulin resistance.

Methods: C57Bl/6 mice were fed a western-type diet supplemented with empagliflozin (WDE) or without empagliflozin (WD) for 10 weeks. A standard control diet (CD) without or with empagliflozin (CDE) was used to control for diet-specific effects. Metabolic phenotyping included assessment of body weight, food and water intake, body composition, hepatic energy metabolism, skeletal muscle mitochondria and measurement of insulin sensitivity using hyperinsulinaemic-euglycaemic clamps.

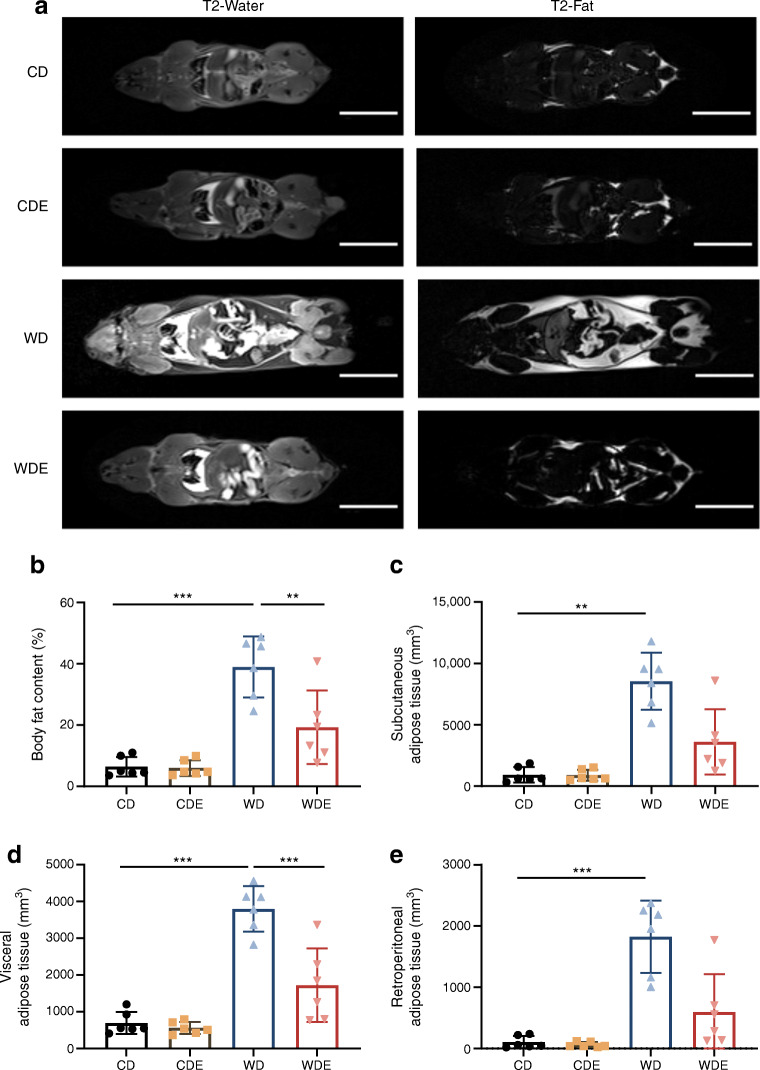
Results: Mice fed the WD were overweight, hyperglycaemic, hyperinsulinaemic and insulin resistant after 10 weeks. Supplementation of the WD with empagliflozin prevented these metabolic alterations. While water intake was significantly increased by empagliflozin supplementation, food intake was similar in WDE- and WD-fed mice. Adipose tissue depots measured by MRI were significantly smaller in WDE-fed mice than in WD-fed mice. Additionally, empagliflozin supplementation prevented significant steatosis found in WD-fed mice. Accordingly, hepatic insulin signalling was deteriorated in WD-fed mice but not in WDE-fed mice. Empagliflozin supplementation positively affected size and morphology of mitochondria in skeletal muscle in both CD- and WD-fed mice.

Conclusions/interpretation: Empagliflozin protects mice from diet-induced weight gain, insulin resistance and hepatic steatosis in a preventative setting and improves muscle mitochondrial morphology independent of the type of diet.

Keywords: Empagliflozin; Insulin resistance; Obesity; SGLT2 inhibition; Skeletal muscle mitochondria; Steatosis; Western-type diet.


Figures

Fig. 1
Fig. 1
Characteristics of mice during the study. (a) Body weight of mice over the course of the study (mean ± SEM, n=16 [WD=15]). Two-way repeated measures ANOVA was used (p for diet effects, p<0.0001; p for diet × time interaction, p<0.0001). ***p<0.001 WD vs WDE; p<0.01 CD vs CDE at week 10. (b) Blood glucose levels during the study (mean ± SEM, n=16 [WD=15]). Two-way repeated measures ANOVA was used (p for diet effects <0.0001; p for diet × time interaction <0.0502). *p<0.05 WD vs WDE at week 10. (cf) Plasma insulin (n=5–9) (c), glucagon (n=4–9) (d), β-hydroxybutyrate (n=8) (e) and adiponectin (n=8–10) (f) levels at week 10. (g, h) Daily food intake in CD and CDE mice (g) and WD and WDE mice (h) (n=4). (i, j) Daily water intake in CD and CDE mice (i) and WD and WDE mice (j) (n=4). Unless otherwise specified, data are presented as mean ± SD. Kruskal–Wallis test was performed for (cf). Two-way ANOVA was performed for (a, b) and (gj). Bars and asterisks (*p<0.05) indicate respective post hoc analysis. The key applies to (a, b and gj). BSL, baseline
Fig. 2
Fig. 2
MRI analysis of total body fat and fat distribution in mice. (a) Representative coronal sections of 3T MRI studies. Water- and fat-separated images generated by the T2-Weighted Dixon Turbo Spin Echo sequence are shown. Scale bar, 20 mm. (b) Quantification of body fat content as per cent of total body volume (also calculated from MRI sequences) (n=6). (ce) Different adipose tissue compartments in mm3: subcutaneous (c) (n=6); visceral (d) (n=6) and retroperitoneal (e) fat depot (n=6). Data are presented as mean ± SD. ANOVA was performed for (b, d). Kruskal–Wallis test was performed for (c, e). Bars and asterisks (**p<0.01, ***p<0.001) indicate respective post hoc analysis
Fig. 3
Fig. 3
Hyperinsulinaemic–euglycaemic clamp studies. (a) GIR at steady-state euglycaemic clamp conditions (n=5 or 6). (b) GIR per total body weight adjusted for insulin concentration at clamp conditions (n=5 or 6). (c) GIR per lean body weight adjusted for insulin concentration at clamp conditions (n=3–5). (d) Correlation of GIR (unadjusted for body weight, μmol/min) and body weight (n=23). (e, f) Blood glucose at baseline (beginning of clamp study) (e) and at hyperinsulinaemic–euglycaemic conditions (f) (n=5 or 6). (g) Plasma insulin levels at clamp conditions (n=5 or 6). (h, i) Total (h) (n=5 or 6) and lean (i) (n=3–5) bodyweight. Data are presented as mean ± SD. ANOVA was performed for (ac) and (ei). Bars and asterisks (*p<0.05, **p<0.01) indicate respective post hoc analysis
Fig. 4
Fig. 4
Histological and metabolic assessments of liver specimen after 10 week of diets. (a) Representative H&E stains of liver sections after 10 weeks of respective diets. Scale bar, 100 μm. (b) Mean steatosis score assessed in a blinded manner (n=7 or 8). (c) Liver triacylglycerol content (n=10). (d) Representative western blots of hepatic insulin signalling. (e, f) Corresponding densitometry of p-Akt/tAkt (e) (n=9) and insulin receptor (f) (n=9). See ESM Figs 4 and 5 for full-length western blots. Data are presented as mean ± SD. Kruskal–Wallis test was performed for (b, c, e). ANOVA was performed for (f). Bars and asterisks (*p<0.05, **p<0.01, ***p<0.001) indicate respective post hoc analysis
Fig. 5
Fig. 5
Liver expression analysis of key factors of hepatic insulin sensitivity and fatty acid metabolism. (ae) Pdk4 (a) (n=10), Adipor1 (b) (n=10), Cpt1a (c) (n=10), Pparγ (d) (n=10) and Cd36 (e) (n=10) mRNA levels. (f) Glycogen content of liver samples (n=10). (gi) Pepck (g) (n=10), G6pc (h) (n=10) and Gck (i) (n=10) mRNA levels. Data are presented as mean ± SD. Kruskal–Wallis test was performed for (a, ce, g, h). ANOVA was performed for (b, f, i). Bars and asterisks (*p<0.05, **p<0.01, ***p<0.001) indicate respective post hoc analysis
Fig. 6
Fig. 6
Mitochondrial biogenesis and morphology in skeletal muscle. (a) Citrate synthase activity. (bd) Pgc1α (b) (n=15), Nrf1 (c) (n=10) and Tfam (d) (n=10) mRNA expression levels. (eh) Quantification of mitochondrial area in different fibre types and different subcellular location in skeletal muscle fibres. (e) (n=785–1370); type I fibres and intramyocellular location (f) (n=812–1213); type II fibres and subsarcolemmal location (g) (n=81–457); and type I fibres and subsarcolemmal location (h) (n=0–15). (i) Representative TEM sections of different skeletal muscle fibre types. Different size and morphological features of mitochondria of different subcellular compartments (intramyocellular/subsarcolemmal) are best seen in type II fibres in WDE-fed mice. Scale bar, 500 nm. Data are presented as mean ± SD (ad) and as boxplots (10th–25th percentiles, median and 75th–90th percentiles are shown) (eh). ANOVA was performed for (ac). Kruskal–Wallis test was performed for (dg). Bars and asterisks (*p<0.05, **p<0.01, ***p<0.001) indicate respective post hoc analysis

References

    1. GBD 2015 Obesity Collaborators. Afshin A, Forouzanfar MH, et al. Health effects of overweight and obesity in 195 countries over 25 years. N Engl J Med. 2017;377(1):13–27. doi: 10.1056/NEJMoa1614362. - DOI - PMC - PubMed
    1. World Health Organization (2021) Obesity and overweight. https://www.who.int/news-room/fact-sheets/detail/obesity-and-overweight. Accessed 5 Oct 2021
    1. Heymsfield SB, Wadden TA. Mechanisms, pathophysiology, and management of obesity. N Engl J Med. 2017;376(3):254–266. doi: 10.1056/NEJMra1514009. - DOI - PubMed
    1. Lingvay I, Sumithran P, Cohen RV, le Roux CW (2021) Obesity management as a primary treatment goal for type 2 diabetes: time to reframe the conversation. Lancet S0140-6736(21)01919-X. 10.1016/S0140-6736(21)01919-X - PubMed
    1. Tentolouris A, Vlachakis P, Tzeravini E, Eleftheriadou I, Tentolouris N. SGLT2 inhibitors: a review of their antidiabetic and cardioprotective effects. Int J Environ Res Public Health. 2019;16(16):2965. doi: 10.3390/ijerph16162965. - DOI - PMC - PubMed

Publication types

LinkOut - more resources