. 2022 Dec 28;144(51):23505-23515.
doi: 10.1021/jacs.2c10198. Epub 2022 Dec 16.

Dual-Color Optical Recording of Bioelectric Potentials by Polymer Electrochromism

Affiliations

Dual-Color Optical Recording of Bioelectric Potentials by Polymer Electrochromism

Yuecheng Zhou et al. J Am Chem Soc. .

Abstract

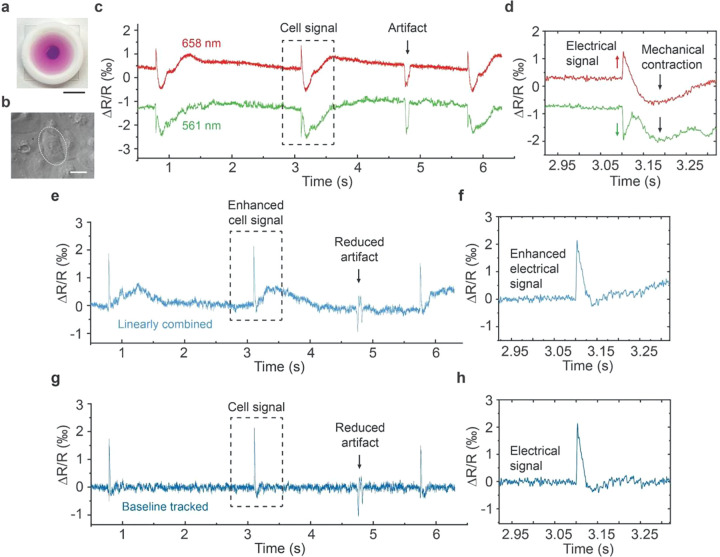
Optical recording based on voltage-sensitive fluorescent reporters allows for spatial flexibility of measuring from desired cells, but photobleaching and phototoxicity of the fluorescent labels often limit their sensitivity and recording duration. Voltage-dependent optical absorption, rather than fluorescence, of electrochromic materials, would overcome these limitations to achieve long-term optical recording of bioelectrical signals. Electrochromic materials such as PEDOT:PSS possess the property that an applied voltage can either increase or decrease the light absorption depending on the wavelength. In this work, we harness this anticorrelated light absorption at two different wavelengths to significantly improve the signal detection. With dual-color detection, electrical activity from cells produces signals of opposite polarity, while artifacts, mechanical motions, and technical noises are uncorrelated or positively correlated. Using this technique, we are able to optically record cardiac action potentials with a high signal-to-noise ratio, 10 kHz sampling rate, >15 min recording duration, and no time-dependent degradation of the signal. Furthermore, we can reliably perform multiple recording sessions from the same culture for over 25 days.


Conflict of interest statement

The authors declare no competing financial interest.

Figures

Figure 1
Figure 1
Dual-color ElectroChromic Recording (ECORE) using PEDOT:PSS thin films. (a and b) A PEDOT:PSS thin film at (a) + 300 mV potential (oxidized state, blue color) and (b) −300 mV potential (reduced state, purple color) and the respective molecular structures. Scale bar = 5 mm. (c) Ultraviolet–visible (UV–vis) spectra of a 90 nm-thick PEDOT:PSS film under different applied voltages from +600 to −700 mV with a 100 mV step. (d) Absorbances at 561 nm (green) and 658 nm (red) change in opposite directions as a function of applied voltage. (e) Schematic drawing of a cell cultured on a PEDOT:PSS thin film. Two probing lasers with overlapping optical paths are total-internally reflected at the interface. The light reflection, R, is sensitive to the spectral shift induced by cell electrical activities. (f) When a train of 1 mV square wave voltages is applied to the PEDOT:PSS film using a potentiostat (top panel), the corresponding reflectance changes, ΔR/R, of the two channels (561 nm in green, 658 nm in red) change in opposite directions (bottom panel). The arrows indicate the direction of the optical response. (g) Zoom-in traces of the 561 nm channel (green) shows a signal-to-noise ratio (SNR) of ∼180 and the 658 nm channel (red) shows an SNR of ∼90. (h) Artifacts (likely dust particles) result in the same-direction spikes in the two channels, which is in contrast to opposite-direction changes in response to electrical signals.
Figure 2
Figure 2
Characterization of the dual-color ECORE. (a) Measured and modeled reflectance R at two color channels with respect to the thickness of PEDOT:PSS thin film. (b) Measured and modeled absolute value of fractional reflectance change |ΔR/R| of PEDOT:PSS thin film in response to a 1 mV, 1 Hz applied square-wave potential with respect to different film thicknesses. (c) Measured and modeled reflectance R with respect to different incident angles. (d) Measured and modeled absolute value of fractional reflectance change |ΔR/R| in response to a 1 mV, 1 Hz applied square-wave potential with respect to different incident angles. (e) Measured reflectance R at different bias potentials. (f) Measured absolute value of fractional reflectance change |ΔR/R| in response to a 1 mV, 1 Hz applied square-wave potential at different bias potentials. (g) Measured open-circuit potential, Eopen, with respect to the Ag/AgCl reference electrode, of PEDOT:PSS thin films at four different conditions: (1) freshly made film (day −1); (2) films exposed to culture medium for 1–13 days; (3) films coated with Matrigel and then exposed to culture medium for 1–13 days; (4) films coated with Matrigel and then plated with cardiomyocyte cells for 1–13 days; Day 0 indicates the day when cells were seeded or cell culture media was added to the film. (h) Stabilized Eopen under different conditions. All error bars indicate two standard deviations.
Figure 3
Figure 3
Dual-color ECORE of cardiomyocyte action potentials. (a) Photo of a cell culture device for ECORE measurement. Scale bar = 10 mm. (b) Monolayer of cardiomyocytes cultured on a PEDOT:PSS thin film at 11 days after seeding. The cell circled with a dashed line is selected for recording with dual-color ECORE. Scale bar = 50 μm. (c) ECORE recording traces from the 561 nm channel (green) and the 658 nm channel (red). The cell signal is composed of electrical signals from cell action potentials (sharp spikes) followed by the mechanical signals from cell contraction (slower waves). The electrical signals appear in opposite polarity in two channels, while the mechanical contractions and an artifact signal appear in the same polarity. (d) Zoomed-in cell signals in the dash-line box in (c). (e) Linearly combined trace from two recording channels shows enhanced electrical signal and reduced baseline shift due to cell mechanical contraction. (f) Zoomed-in cell signals in the dashed box in e. (g) Baseline tracking algorithm was applied to flatten the baseline without affecting the electrical signals. (h) Zoomed-in electrical signals in the dash-line box in (g).
Figure 4
Figure 4
Simultaneous ECORE and patch clamp recording. (a) Illustration of simultaneous ECORE (single channel) and patch clamp recording. Inset: the probing laser spot and patch clamp pipet are focused onto the same cell. Scale bar = 50 μm. (b) Synchronized recordings from patch clamp (intracellular action potentials) and from ECORE (extracellular action potentials). (c) Zoomed-in intracellular and extracellular action potentials show that the extracellular spikes are time aligned to the sharp depolarization phase of the intracellular action potentials (dashed line).
Figure 5
Figure 5
Stable and long-term recording of hiPSC-cardiomyocytes. (a) Fifteen minute dual-color recording (combined trace is shown) at 10 kHz frequency shows a stable recording of rhythmic action potentials from a cardiomyocyte at 13-day post seeding. (b) Zoomed-in traces at 1, 5, 10 and 15 min show that the optical signal amplitude does not decay over the long recording period. (c–e) Recording traces from the same culture at 11, 18, and 25 days after seeding on the PEDOT:PSS thin film. (f) Measured signal-to-noise ratios on different days. The signal-to-noise ratio is computed based on the average spike size over the standard deviation of the background noise at a 25 ms period. The error bar indicates two standard deviations.

References

    1. Colatsky T.; et al. The Comprehensive in Vitro Proarrhythmia Assay (CiPA) initiative - Update on progress. J. Pharmacol. Toxicol. Methods 2016, 81, 15–20. 10.1016/j.vascn.2016.06.002. - DOI - PubMed
    1. Adam Y.; et al. Voltage imaging and optogenetics reveal behaviour-dependent changes in hippocampal dynamics. Nature 2019, 569, 413–417. 10.1038/s41586-019-1166-7. - DOI - PMC - PubMed
    1. Musk E.; An integrated brain-machine interface platform with thousands of channels. J. Med. Internet. Res. 2019, 21 (10), e16194.10.2196/16194. - DOI - PMC - PubMed
    1. Scanziani M.; Häusser M. Electrophysiology in the age of light. Nature 2009, 461, 930–939. 10.1038/nature08540. - DOI - PubMed
    1. Wilt B. A.; et al. Advances in light microscopy for neuroscience. Annu. Rev. Neurosci. 2009, 32, 435–506. 10.1146/annurev.neuro.051508.135540. - DOI - PMC - PubMed

Publication types