. 2022 Dec 16;8(50):eabp8293.
doi: 10.1126/sciadv.abp8293. Epub 2022 Dec 16.

In vivo characterization of glutamine metabolism identifies therapeutic targets in clear cell renal cell carcinoma

Affiliations

In vivo characterization of glutamine metabolism identifies therapeutic targets in clear cell renal cell carcinoma

Akash K Kaushik et al. Sci Adv. .

Abstract

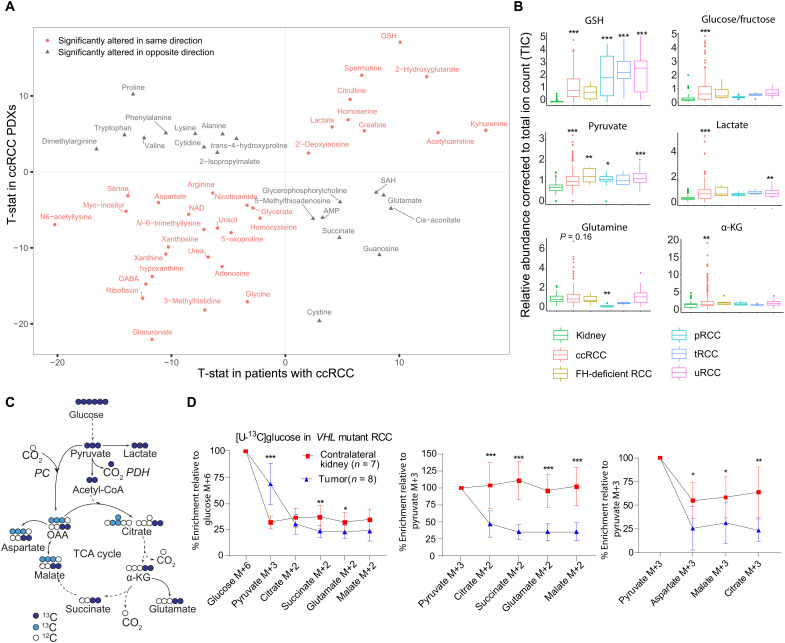
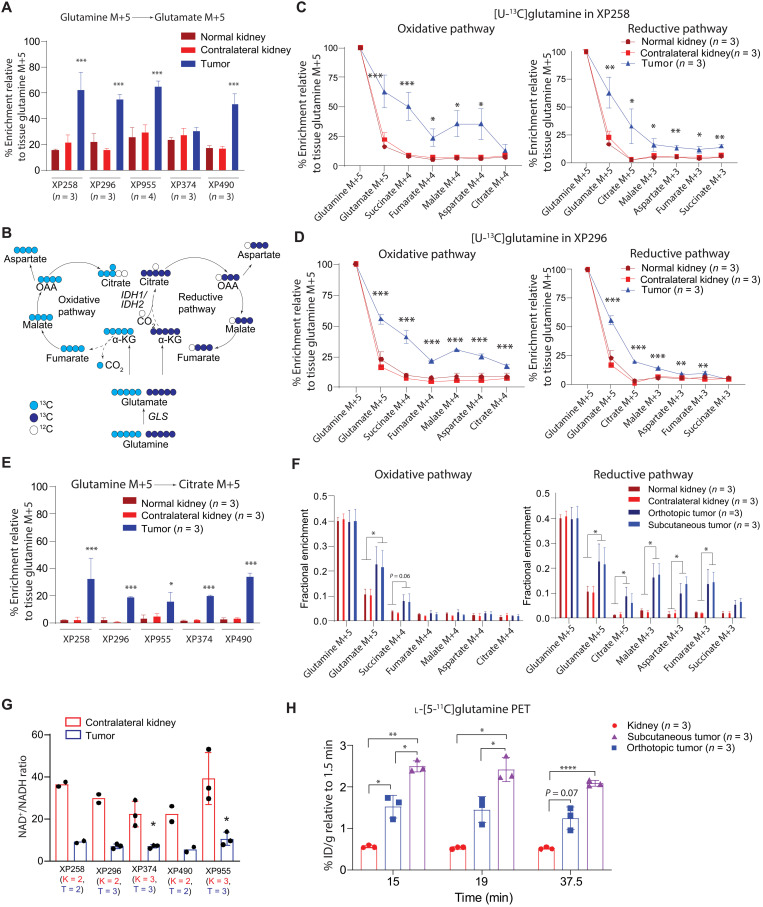
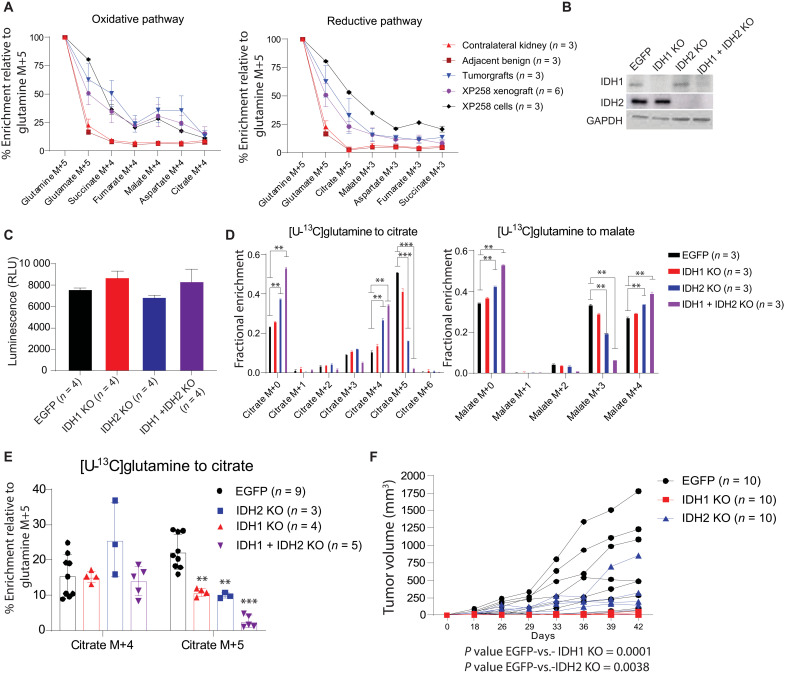
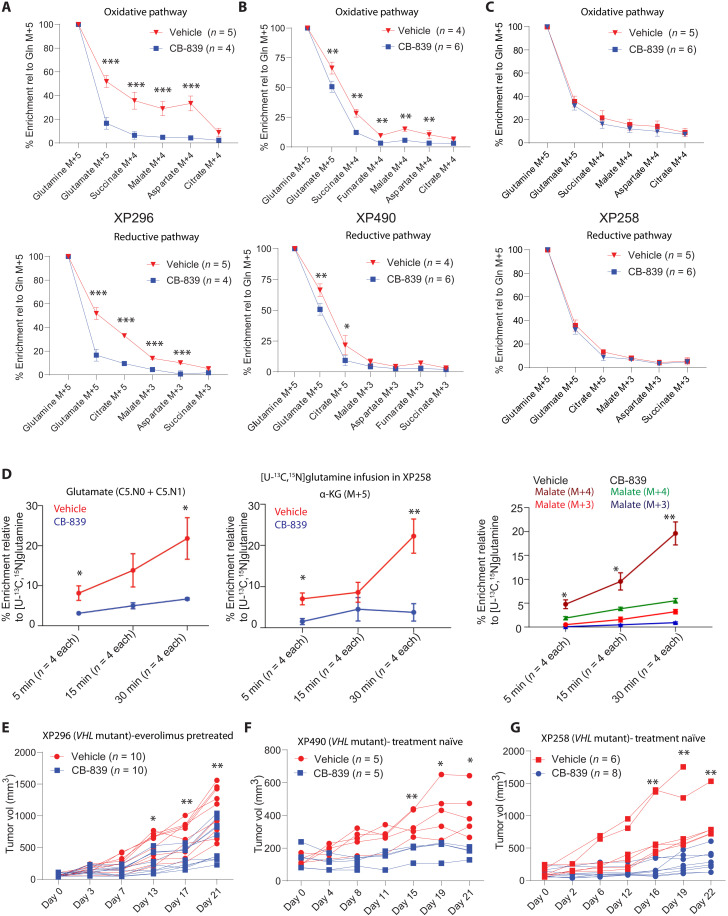
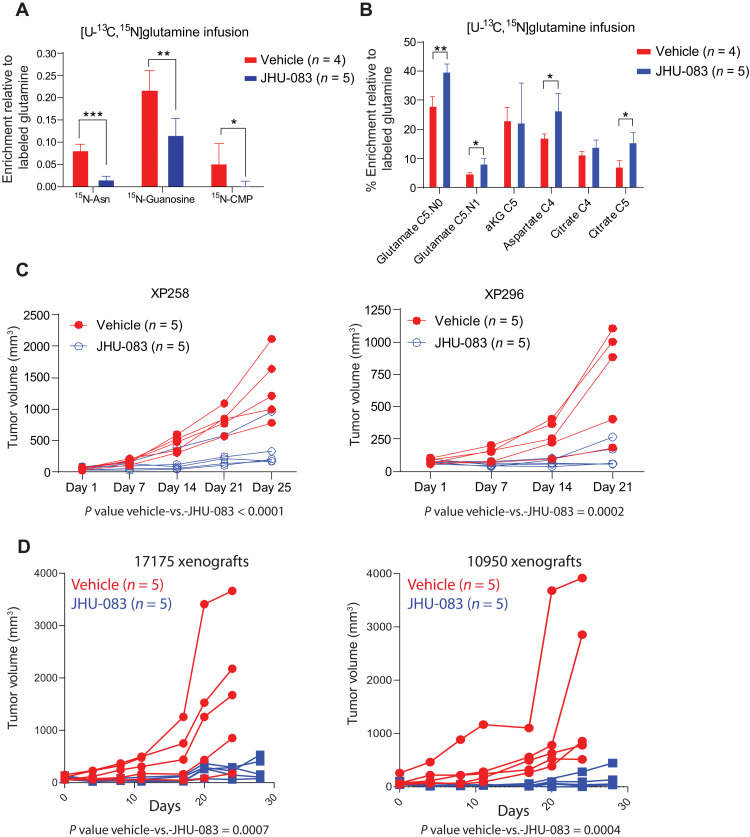
Targeting metabolic vulnerabilities has been proposed as a therapeutic strategy in renal cell carcinoma (RCC). Here, we analyzed the metabolism of patient-derived xenografts (tumorgrafts) from diverse subtypes of RCC. Tumorgrafts from VHL-mutant clear cell RCC (ccRCC) retained metabolic features of human ccRCC and engaged in oxidative and reductive glutamine metabolism. Genetic silencing of isocitrate dehydrogenase-1 or isocitrate dehydrogenase-2 impaired reductive labeling of tricarboxylic acid (TCA) cycle intermediates in vivo and suppressed growth of tumors generated from tumorgraft-derived cells. Glutaminase inhibition reduced the contribution of glutamine to the TCA cycle and resulted in modest suppression of tumorgraft growth. Infusions with [amide-15N]glutamine revealed persistent amidotransferase activity during glutaminase inhibition, and blocking these activities with the amidotransferase inhibitor JHU-083 also reduced tumor growth in both immunocompromised and immunocompetent mice. We conclude that ccRCC tumorgrafts catabolize glutamine via multiple pathways, perhaps explaining why it has been challenging to achieve therapeutic responses in patients by inhibiting glutaminase.


Figures

Fig. 1.
Fig. 1.. ccRCC tumorgrafts recapitulate metabolic signatures of human ccRCC.
(A) Correlation plot of metabolites altered in both ccRCC tumorgrafts and human tumors. In both studies, differential metabolites between tumor and kidney were calculated using Student’s t test and false discovery rate (FDR)–corrected (Q < 0.05). T-statistic (T-stat) was used as a surrogate for z score to generate the correlation plot using ggplot in R. Positive T-stat values indicate metabolite elevation in tumors, and negative T-stat values indicate metabolite depletion in tumors. Red circles are metabolites altered in the same direction in tumorgrafts and human ccRCC, and gray triangles are metabolites altered in opposite directions. PDX, patient-derived xenograft; AMP, adenosine monophosphate; SAH, S-adenosylhomocysteine. (B) Box plots of relative abundance of metabolites in RCC tumorgrafts of different histological types, including ccRCC, FH-deficient RCC, papillary RCC (pRCC), translocation RCC (tRCC), and unclassified RCC (uRCC). One-way analysis of variance (ANOVA) coupled with pairwise t test in R software was used to calculate statistical significance, and P values were FDR-corrected. (C) Illustration of carbon flow from [U-13C]glucose. Pyruvate fuels the TCA cycle via PDH (dark blue circles) and pyruvate carboxylase (PC) (light blue circles). (D) Plots showing percent enrichment of metabolites relative to [U-13C]glucose (left), and the ratio of M+2 (middle) or M+3 (right) TCA cycle metabolites relative to pyruvate M+3 as surrogates of PDH and PC activity, respectively. Eight mice bearing three distinct orthotopic tumorgrafts (XP258, n = 3; XP374, n = 3; XP490, n = 2) were infused with [U-13C]glucose for 3 hours. M is the mass of the unlabeled metabolite. P values were calculated using Student’s t test. P values: *P < 0.05, **P < 0.01,***P < 0.001.
Fig. 2.
Fig. 2.. Glutamine is a carbon source for the TCA cycle in ccRCC tumorgrafts.
(A) Relative glutamate M+5 in tumors and kidneys from mice infused with [U-13C]glutamine. One-way ANOVA was used to assess statistical significance. (B) Oxidative and reductive carbon flow from glutamine (light and dark blue circles, respectively). (C and D) TCA cycle labeling in XP258 (C) and XP296 (D) tumorgrafts, adjacent kidney (labeled as normal kidney), and contralateral kidney. The experiment was conducted in at least three mice per tumorgraft. One-way ANOVA coupled with a pairwise t test was used to assess significance of 13C enrichment between tissues. (E) Enrichment of citrate M+5 across all models. The experiment was conducted in a minimum of three mice per model. One-way ANOVA coupled with a pairwise t test was used to assess statistical significance of 13C enrichment in citrate M+5 between tissues. (F) TCA cycle intermediate labeling in orthotopic tumors, subcutaneous tumors, and kidneys. Data are from three mice implanted with both orthotopic and subcutaneous XP955 tumorgrafts. One-way ANOVA was used to assess the statistical significance of 13C enrichment. (G) NAD+/NADH ratios in tumorgrafts and kidneys. The number (n) of kidneys (K) and tumors (T) are indicated. Student’s t test was used to assess the significance. (H) 11C signal relative to 1.5 min (time of maximal signal in the kidney) in kidney and tumors. One-way ANOVA was used to determine statistical significance. P values: *P < 0.05, **P < 0.01, ***P < 0.001,**** P < 0.0001.
Fig. 3.
Fig. 3.. IDH1 and IDH2 regulate reductive carboxylation and ccRCC growth.
(A) Percent enrichment of 13C relative to [U-13C]glutamine in TCA cycle from orthotopic XP258–derived orthotopic tumorgrafts, cell lines, and subcutaneous xenografts. Tumor-bearing mice were infused with [U-13C]glutamine for 5 hours, and XP258 cells were labeled in culture with [U-13C]glutamine for 4 hours. (B) Western blot showing the abundance of IDH1 and IDH2 in single- and double-knockout (IDH1 + IDH2 KO) cells generated using lentiviral CRISPR-Cas9. Enhanced green fluorescent protein (EGFP) is a control cell line with a guide RNA targeting EGFP. (C) Viable cell content in EGFP, IDH1 KO, IDH2 KO, and IDH1 + IDH2 KO XP258 cells assessed using Promega CellTiter-Glo. RLU, relative light unit. (D) Fractional enrichment of 13C-labeled isotopologues of citrate and malate in cells after 4 hours of culture with [U-13C]glutamine. One-way ANOVA was used to assess the significance of 13C enrichment in citrate and malate (n = 3). (E) Percentage enrichment of citrate M+4 and citrate M+5 relative to [U-13C]glutamine in EGFP, IDH1 KO, IDH2 KO, and IDH1 + IDH2 KO XP258 tumors. Mice were infused with [U-13C]glutamine for 5 hours. Data are from three or more xenografts generated subcutaneously in NOD-SCID mice. One-way ANOVA with a pairwise t test was used to determine the statistical significance. (F) Growth of EGFP, IDH1 KO, and IDH2 KO subcutaneous XP258 xenografts in NOD-SCID mice (n = 10, each cell line). P values were calculated using a mixed-effect two-way ANOVA that assessed the significance of differences in tumor growth over time between EGFP versus IDH1 KO and EGFP versus IDH2 KO tumors. P values: **P < 0.01, ***P< 0.001.
Fig. 4.
Fig. 4.. CB-839 variably decreases glutamine metabolism and ccRCC growth.
(A) Percent enrichment of 13C-labeled TCA cycle intermediates relative to [U-13C]glutamine in the oxidative (top) and reductive (bottom) pathway in XP296 tumorgraft–bearing mice treated with CB-839 (200 mg/kg) or vehicle for 21 days. Student’s t test was used to assess the statistical significance of 13C enrichment between CB-839– and vehicle-treated tumors (n ≥ 4). (B) Similar to (A) but for XP490 tumorgrafts. (C) Similar to (A) but for XP258 tumorgrafts. (D) Percent enrichment of glutamate M+5 or M+6 {as either [U-13C]glutamate or [U-13C, 15N]glutamate}, M+5 α-KG and M+4 or M+3 malate in XP258 xenografts from CB-839– and vehicle-treated animals infused with [U-13C, 15N]glutamine for 5, 15, and 30 min. Student’s t test was used to calculate the P values. (E) Spider plot of growth of subcutaneous XP296 tumorgrafts in NOD-SCID mice treated twice daily with CB-839 (200 mg/kg) or vehicle. Treatment was started when tumors reached 100 to 200 mm3. Data are plotted from two independent experiments. The Student’s t test was used to calculate the statistical significance of tumor growth at each time point (n = 10, each treatment arm). (F) Similar to (E) but for XP490 tumorgrafts. (G) Similar to (E) but for XP258 tumorgrafts. P values: *P < 0.05, **P < 0.01, ***P < 0.001.
Fig. 5.
Fig. 5.. JHU-083 decreases glutamine-dependent nitrogen metabolism and ccRCC growth.
(A) Percent enrichment of 15N-labeled asparagine (Asn), guanosine, and cytidine monophosphate (CMP) relative to [U-13C,15N]glutamine in XP258 tumorgrafts treated with JHU-083 (1.83 mg/kg) or vehicle for 5 days. Student’s t test was used to assess the statistical significance of 15N enrichment between JHU-083– and vehicle-treated tumors (n ≥ 4). (B) Percent enrichment of 13C-labeled TCA cycle intermediates relative to [U-13C, 15N]glutamine in XP258 tumorgrafts treated with JHU-083 and vehicle in (A). Student’s t test was used to assess the statistical significance of 13C enrichment between JHU-083– and vehicle-treated tumors (n ≥ 4). (C) Left: Spider plot of growth of subcutaneous XP258 tumorgrafts in NOD-SCID mice treated with JHU-083 (1.83 mg/kg) or vehicle for 25 days (5-days-on and 2-days-off treatment). Treatment was started when tumors reached ~50 mm3. P values were calculated using a mixed-effect two-way ANOVA that assessed the significance of differences in tumor growth over time between vehicle and JHU-083 in both xenografts. Right: The same as left but for XP296 tumorgrafts treated with JHU-083 (1.83 mg/kg) and vehicle for 21 days. (D) Growth curves of tumors in C57BL/6 mice generated from 17175 (right) and 10950 (left) cell lines treated with JHU-083 and vehicle. Mice were treated with JHU-083 (0.915 mg/kg) or vehicle for 21 days or more. P values were calculated using a mixed-effect two-way ANOVA that assessed the significance of differences in tumor growth over time between vehicle and JHU-083 in both xenografts. P values: *P < 0.05, **P < 0.01, ***P < 0.001.

Comment in

  • Targeting glutamine use in RCC.
    Wang M. Wang M. Nat Rev Nephrol. 2023 Mar;19(3):151. doi: 10.1038/s41581-023-00684-2. Nat Rev Nephrol. 2023. PMID: 36694057 No abstract available.

References

    1. W. M. Linehan, L. S. Schmidt, D. R. Crooks, D. Wei, R. Srinivasan, M. Lang, C. J. Ricketts,The metabolic basis of kidney cancer. Cancer Discov. 9,1006–1021 (2019). - PubMed
    1. X. Ma, K. Yang, P. Lindblad, L. Egevad, K. Hemminki,VHL gene alterations in renal cell carcinoma patients: Novel hotspot or founder mutations and linkage disequilibrium. Oncogene 20,5393–5400 (2001). - PubMed
    1. Cancer Genome Atlas Research Network ,Comprehensive molecular characterization of clear cell renal cell carcinoma. Nature 499,43–49 (2013). - PMC - PubMed
    1. D. Tarade, M. Ohh,The HIF and other quandaries in VHL disease. Oncogene 37,139–147 (2018). - PubMed
    1. G. L. Semenza, B. H. Jiang, S. W. Leung, R. Passantino, J. P. Concordet, P. Maire, A. Giallongo,Hypoxia response elements in the aldolase A, enolase 1, and lactate dehydrogenase A gene promoters contain essential binding sites for hypoxia-inducible factor 1. J. Biol. Chem. 271,32529–32537 (1996). - PubMed