. 2022 Dec 23;7(78):eadd3330.
doi: 10.1126/sciimmunol.add3330. Epub 2022 Dec 16.

Notch-dependent cooperativity between myeloid lineages promotes Langerhans cell histiocytosis pathology

Affiliations

Notch-dependent cooperativity between myeloid lineages promotes Langerhans cell histiocytosis pathology

Egle Kvedaraite et al. Sci Immunol. .

Abstract

Langerhans cell histiocytosis (LCH) is a potentially fatal neoplasm characterized by the aberrant differentiation of mononuclear phagocytes, driven by mitogen-activated protein kinase (MAPK) pathway activation. LCH cells may trigger destructive pathology yet remain in a precarious state finely balanced between apoptosis and survival, supported by a unique inflammatory milieu. The interactions that maintain this state are not well known and may offer targets for intervention. Here, we used single-cell RNA-seq and protein analysis to dissect LCH lesions, assessing LCH cell heterogeneity and comparing LCH cells with normal mononuclear phagocytes within lesions. We found LCH discriminatory signatures pointing to senescence and escape from tumor immune surveillance. We also uncovered two major lineages of LCH with DC2- and DC3/monocyte-like phenotypes and validated them in multiple pathological tissue sites by high-content imaging. Receptor-ligand analyses and lineage tracing in vitro revealed Notch-dependent cooperativity between DC2 and DC3/monocyte lineages during expression of the pathognomonic LCH program. Our results present a convergent dual origin model of LCH with MAPK pathway activation occurring before fate commitment to DC2 and DC3/monocyte lineages and Notch-dependent cooperativity between lineages driving the development of LCH cells.


Conflict of interest statement

Competing interests: The authors declare no competing interests.

Figures

Fig. 1
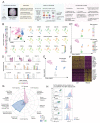
Fig. 1. Multi-omic deconstruction of LCH cells lesions into myeloid cell components reveal LCH core signature.
(A) Schematic illustration of the study design. (B) Protein expression data from index-sort presented in a tSNE plot with color-coded PhenoGraph clusters; cell identities shown are based on protein level expression of signature markers presented in expression plots. (C) scRNA-seq data presented in a UMAP plot with color-coded PhenoGraph clusters (RNA clusters, upper panel) and further annotated taking protein derived cell identities into account (Cell identity, lower panel); Cell identities: mregDC, pDC, other, DC1, pre-DC, DC3, Myeloid – the remaining cells from the DC cluster 4, Mono, LCH (also see Fig. S1 for gating and backgating). (D) Violin plots showing relative expression level of selected key DEGs in the RNA-data-based-cell-clusters. (E) 2. LCH cells (pink) and other mononuclear myeloid cells (blue) highlighted in a UMAP. (F) Heatmap showing relative expression levels of the top 400 DEGs between LCH cells and other mononuclear myeloid cells; high to low expression indicated as yellow to dark purple. (G) Ingenuity pathway analysis of DEGs in LCH cells (pink) and other mononuclear myeloid cells (blue), displayed as a spider web plot showing log (p value) and Z score for each pathway, calculated using DEGs expressed at significantly higher or lower levels in LCH cells compared to other mononuclear myeloid cells; dashed circle indicates significance level at P<0.05. (H) Gating strategy for extracellular flow cytometry of lesional cells; histograms showing mean fluorescence intensity of expression of the indicated markers on LCH cells (pink) and other mononuclear myeloid cells (blue).
Fig. 2
Fig. 2. LCH cell heterogeneity, cross-data set validation, and BRAFV600E validation.
(A) LCH cells subjected to PhenoGraph clustering (indicated as LCH cluster) based on gene expression data, presented in a UMAP. (B) LCH cells subjected to CMAP analysis using DC2 and DC3/Mono signatures in the two LCH clusters; cells polarized towards DC2 and DC3/Mono (red and light green arrow, respectively) from both clusters boxed separately. (C) Cells polarized towards DC2 (red) and DC3/Mono (light green) from (B) plotted back onto a UMAP from (A). Distribution of DC2-polarized and DC3/Mono-polarized LCH cells in the two LCH clusters assessed using chi2 test. (D) Heatmap showing the relative expression level of the top 200 DEGs between the DC2-polarized and DC3/Mono-polarized LCH cells and mean expression level from the respective signature shown on the RNA-data-based-cell-clusters 4 and 6 from Fig 1C, representing DC and Monos, respectively; high to low expression indicated as yellow to dark purple. (E) Schematic illustration of cross-data set validation pipeline. (F) Integrated 10X and Smart-seq2 data sets presented in a UMAP with annotations for samples from 10X, Smart-seq2 LCH cells (indicated as Reference LCH cells), 10X SNN clusters containing Reference LCH cells (A, B and C, indicated as LCH clusters), and cells from the two LCH clusters 0 and 1 (indicated as Reference LCH). (G) Integrated LCH cells only, from 10X and Smart-seq2 data presented in a UMAP with annotations for 10X SNN clusters (0, 2 and 1, indicated as LCH clusters), and cells from the two Smart-seq2 LCH clusters 0 and 1 (indicated as Reference LCH). (H) LCH cells from 10X data set subjected to CMAP analysis using DC2 and DC3/Mono signatures in clusters 0, 2 and 1; cells polarized to DC2 and DC3/Mono (red and light green arrow, respectively) boxed separately. (I) Cells polarized towards DC2 (red) and DC3/Mono (light green) from (H) plotted back onto a UMAP from (D). Distribution of DC2-poralized and DC3/Mono-polarized LCH cells in the 10X LCH_0 and LCH_1 clusters assessed using chi2 test. (J) Heatmap showing relative expression level of the top 600 DEGs in 10X LCH clusters LCH_0 (red) and LCH_1 (blue); high to low expression indicated as yellow to dark purple. (K) Ingenuity pathway analysis of DEGs between the two LCH clusters (red and blue), significant Z score is indicated by arrow direction for genes expressed at a higher (up) or lower (down) level. (L) Gating strategy for LCH cells and other lesional mononuclear myeloid cells (left) and ratio of BRAFV600E to wild type cells detected by ddPCR in bulk sorted lesional cells from four patients: Mono/DC3-like (CD14+ LCH cells), DC2-like (CD14-HLA-DQ+ and CD14-HLA-DQ++ LCH cells), and non-LCH cells (HLA-DR+Lin-CD1a-CD207-) (right, see also Fig. S7 for ddPCR controls).
Fig. 3
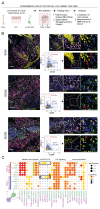
Fig. 3. LCH subpopulation spatial distribution and receptor-ligand interactions.
(A) Schematic illustration of experimental approach. (B) LCH cells (pink mask, upper panels) from skin, bone and lymph node tumors identified based on CD207 expression using Imaris, and two LCH subpopulations defined in FlowJo gating on MHC-II positive (DC2-like LCH cells, red mask, lower panels) and CD44 positive (Mono/DC3-like LCH cells, blue mask, lower panels) cellular units, backgated onto the original images. MHC-II is presented in white, CD44 in green, CD207 in pink, and nuclei (upper panels) in blue; CK, CD20, CD15 in yellow; scale bar indicates 100 μm. (C) Dot plot of ligand-receptor interactions in LCH_0 (DC2-like) and LCH_1 (Mono/DC3-like) and other lesional cells performed on Smartseq-2 data; P values are indicated by circle size, scale on the right; the means of the average expression level of interacting molecule 1 (green, below) in cell population 1 (violet, left) and interacting molecule 2 (violet, below) in cell population 2 (violet, left) are indicated by color, scale on the right.
Fig. 4
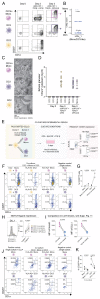
Fig. 4. Lineage specific requirements for LCH program and DC2 capacity to promote Langerin induction on DC3 and monocytes through Notch signaling.
(A) In vitro blood CD14+Mono, DC2, DC3; at day 0 and day 3, cultured with GM-CSF/TGFβ +/-OP9-DLL4 (D4). (B) LCH cells from Mono/DC3-like (LCH_1) cluster subjected to CMAP analysis towards Mono and DC3 signatures, obtained from cells cultured under notch ligation conditions (+OP9-D4 from H) (see Fig. S10). (C) Electron microscopy on in vitro culture from indicated sources in GM-CSF/TGFβ condition for DC2 and GM-CSF/TGFβ +OP9-DLL4 for DC3 and monocytes; Tennis racket-shaped Birbeck granules encircled. (D) Quantification of Birbeck granules; 0 was replaced with 0.1 for visualization purpose on log scale. (E) Schematic illustration of co-culture experimental design, including HLA-A2-based lineage tracing (first column), culture conditions (second column), and gating strategy after excluding dead cells (third column). (F) Levels of CD1a and CD207 on cocultured FACS-sorted DC2 and monocytes (first column, first row), DC2 and DC3 (first column, second row) presented separately (second and third column), and single culture of monocytes (first row, forth column) and DC3 (second row, forth column). (G) Percentage of CD207high cells among monocytes and DC3 in single culture or in co-culture with DC2 (indicated as “co-culture”). (H) Representative histograms (left) and quantification of NOTCH ligand DLL1 expression on CD207low and CD207high cells in indicated cell populations (DC2,DC3, Mono) from co-cultures (indicated as “in co-culture”) or in single monocyte positive control culture with OP9-DLL4. (I) Notch1 and DLL1 MFI, calculated by subtracting isotype signal (i.e. marker MFI minus isotype MFI) in lesional LCH cells and CD14+ myeloid cells (for gating and details see Fig. S11). (J) Levels of CD1a and CD207 on FACS-sorted monocytes (first row) and DC3 (second row), cultured alone (first and forth column) or in a co-o-cultured with DC2 (second and third column), with NOTCH ligand OP9-DLL4 as positive control (first column), and NOTCH inhibitor γ-secretase (GSI) (third column). (K) Percentage of CD207high cells among monocytes and DC3 in co-culture with DC2 with no inhibition and with NOTCH inhibitor γ-secretase (+ GSI). Statistical differences were assessed using ANOVA with Šídák’s multiple comparisons test in (G, K) and paired t test in (H, I), adjusted P value is specified for (G, K) and P value for (H, I).
Fig. 5
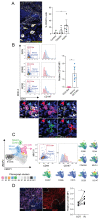
Fig. 5. Levels of MMP inducer CD147 in LCH subsets in the lesions.
(A) LCH cells identified based on CD207 expression using ImageJ, quantified as percentage of total cells (based on number of nuclei) per image and compared between the images from controls, and LCH outside and inside the tumor. CD207 is presented in white, nuclei in blue, cell segment border in yellow; scale bar indicates 100μm; yellow data point indicates control skin. Statistical evaluation using Kruskal-Wallis test with Dunn’s multiple comparisons. (B) Geometric MFI of CD147 expression and comparison between the subpopulations DC2-like LCH cells (MHC-II positive; red gates, histograms, and arrow heads) and Mono/DC3-like LCH cells (CD44 positive; blue gates, histograms, and arrow heads), defined by FlowJo gating on CD207 positive cellular units from (A). MHC-II is presented in white, CD44 in green, CD207 in pink, nuclei in blue, and CD147 in red; scale bar indicates 10μm. Statistical evaluation using Wilcoxon matched-pairs signed rank test. (C) Unsupervised cell clustering performed using PhenoGraph and UMAP on nuclei segmented cellular units and cell identities established based on median intensity of marker expression presented in plots, from high expression (red) to low (blue). Geometric MFI of CD147 measured in the two subpopulations: DC2-like LCH cells (MHC-II positive, red) and Mono/DC3-like LCH cells (CD44 positive, blue), as defined by FlowJo gating on LCH cells (PhenoGraph cluster #1, pink). (D) MFI of CD147 expression and comparison between CD207 high (IN) and CD207 low (OUT) areas inside lesion, relating values to the mean of CD147 MFI of CD207 low (OUT) of each organ. CD207 is presented in pink, nuclei in blue, and CD147 in red; dashed line shows IN and OUT border; scale bar indicates 100μm. Statistical evaluation using Wilcoxon matched-pairs signed rank test. P values: * p<0.05.

References

    1. Guilliams M, et al. Dendritic cells, monocytes and macrophages: a unified nomenclature based on ontogeny. Nat Rev Immunol. 2014;14:571–578. - PMC - PubMed
    1. Kvedaraite E, Ginhoux F. Human dendritic cells in cancer. Sci Immunol. 2022;7:eabm9409. - PubMed
    1. Cytlak U, et al. Differential IRF8 Transcription Factor Requirement Defines Two Pathways of Dendritic Cell Development in Humans. Immunity. 2020:1–27. - PMC - PubMed
    1. Dutertre C-A, et al. Single-Cell Analysis of Human Mononuclear Phagocytes Reveals Subset-Defining Markers and Identifies Circulating Inflammatory Dendritic Cells. Immunity. 2019 doi: 10.1016/j.immuni.2019.08.008. - DOI - PubMed
    1. Bourdely P, et al. Transcriptional and Functional Analysis of CD1c+ Human Dendritic Cells Identifies a CD163+ Subset Priming CD8+CD103+ T Cells. Immunity. 2020 doi: 10.1016/j.immuni.2020.06.002. - DOI - PMC - PubMed

Publication types