

Discovery of genomic loci associated with sleep apnea risk through multi-trait GWAS analysis with snoring
- PMID: 36525587
- PMCID: PMC9995783
- DOI: 10.1093/sleep/zsac308
Discovery of genomic loci associated with sleep apnea risk through multi-trait GWAS analysis with snoring
Abstract
Study objectives: Despite its association with severe health conditions, the etiology of sleep apnea (SA) remains understudied. This study sought to identify genetic variants robustly associated with SA risk.
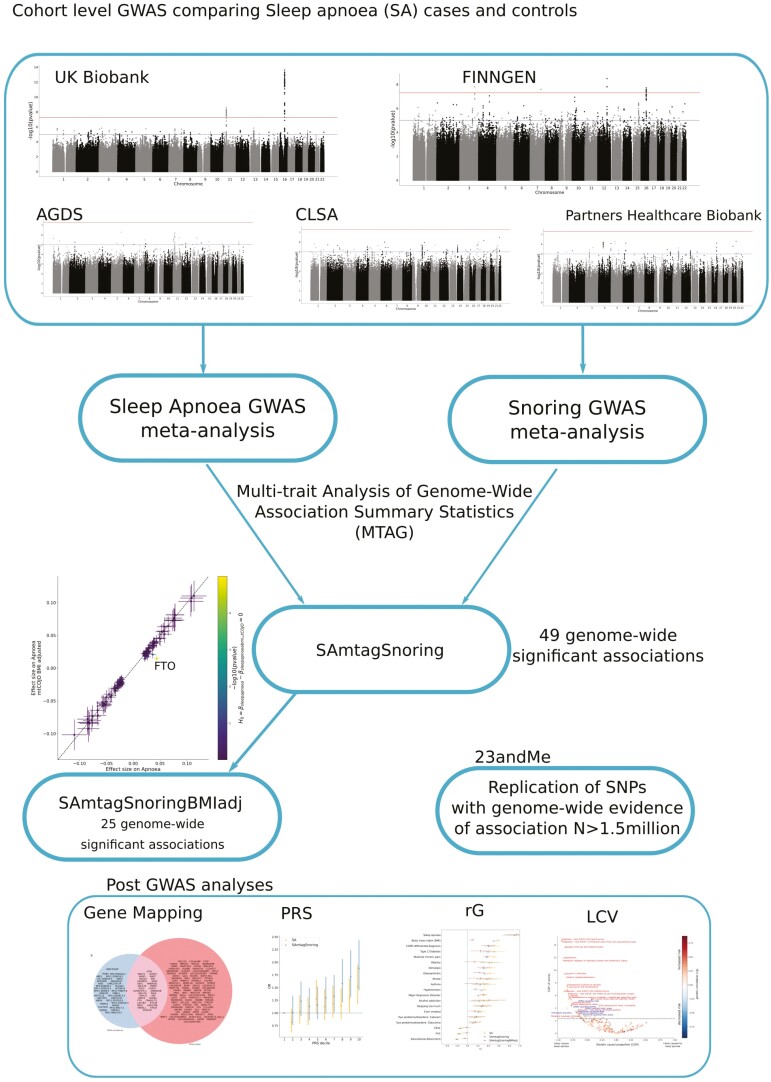
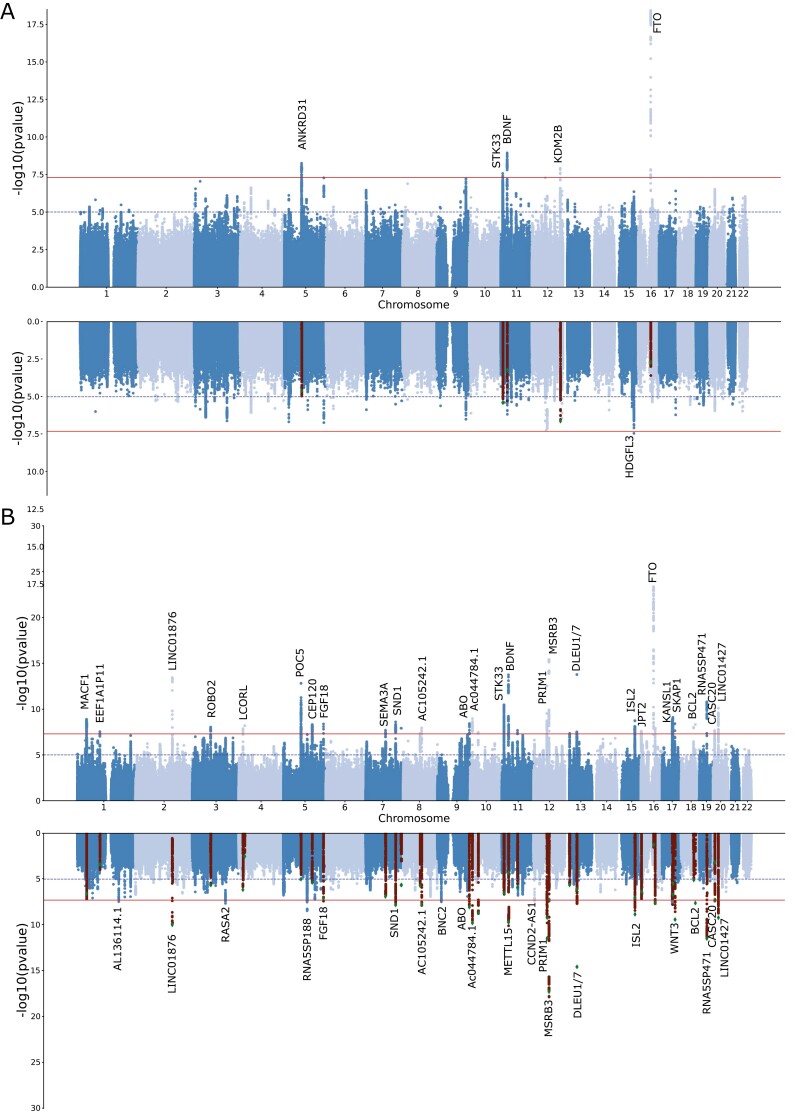
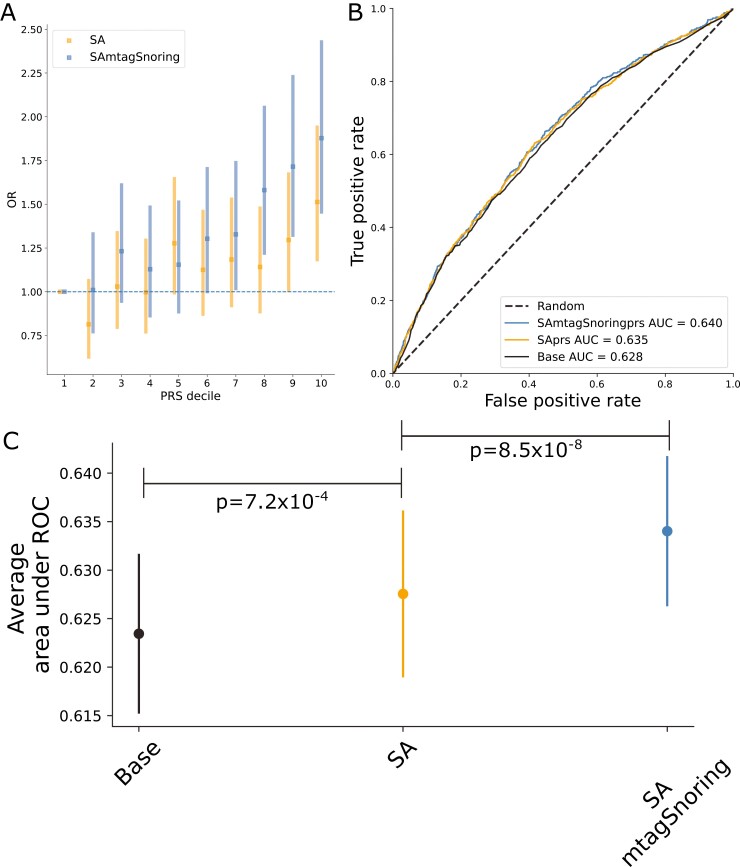
Methods: We performed a genome-wide association study (GWAS) meta-analysis of SA across five cohorts (NTotal = 523 366), followed by a multi-trait analysis of GWAS (multi-trait analysis of genome-wide association summary statistics [MTAG]) to boost power, leveraging the high genetic correlation between SA and snoring. We then adjusted our results for the genetic effects of body mass index (BMI) using multi-trait-based conditional and joint analysis (mtCOJO) and sought replication of lead hits in a large cohort of participants from 23andMe, Inc (NTotal = 1 477 352; Ncases = 175 522). We also explored genetic correlations with other complex traits and performed a phenome-wide screen for causally associated phenotypes using the latent causal variable method.
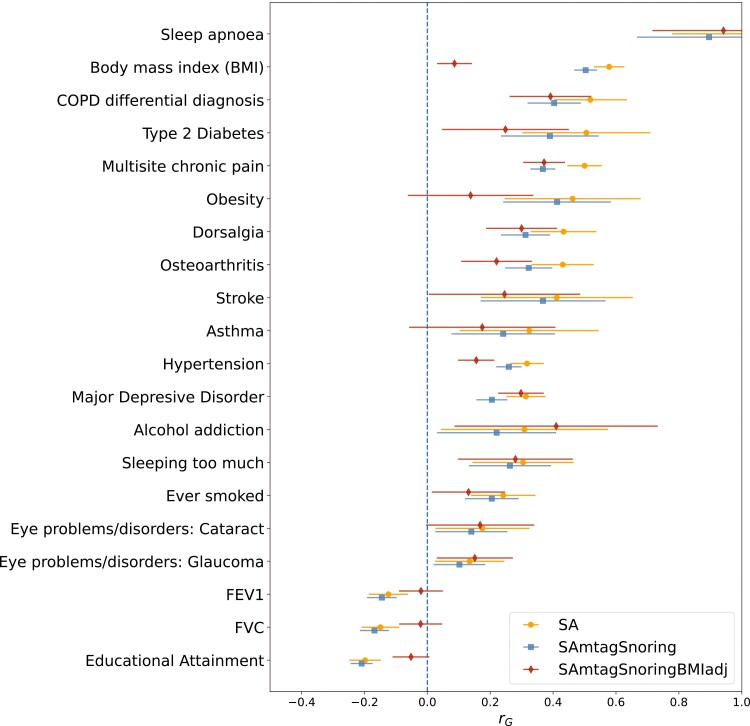
Results: Our SA meta-analysis identified five independent variants with evidence of association beyond genome-wide significance. After adjustment for BMI, only one genome-wide significant variant was identified. MTAG analyses uncovered 49 significant independent loci associated with SA risk. Twenty-nine variants were replicated in the 23andMe GWAS adjusting for BMI. We observed genetic correlations with several complex traits, including multisite chronic pain, diabetes, eye disorders, high blood pressure, osteoarthritis, chronic obstructive pulmonary disease, and BMI-associated conditions.
Conclusion: Our study uncovered multiple genetic loci associated with SA risk, thus increasing our understanding of the etiology of this condition and its relationship with other complex traits.
Keywords: GWAS; genetics; sleep apnea; snoring.
© Sleep Research Society 2022. Published by Oxford University Press on behalf of the Sleep Research Society.
Figures
Comment in
-
Overcoming the underdiagnosis of obstructive sleep apnea to empower genetic association analyses.Sleep. 2023 Mar 9;46(3):zsac312. doi: 10.1093/sleep/zsac312. Sleep. 2023. PMID: 36521025 Free PMC article. No abstract available.
References
-
- Lévy P, et al. . Obstructive sleep apnoea syndrome. Nat Rev Dis Primers. 2015;1:15015. - PubMed
-
- Veasey SC. Encyclopedia of Neuroscience. In: Squire LR, ed., Sleep Apnea, Vol 2009. Cambridge, MA: Academic Press; 2009:975–981.
