. 2023 Feb 13;41(2):252-271.e9.
doi: 10.1016/j.ccell.2022.11.016. Epub 2022 Dec 15.

Hyaluronan driven by epithelial aPKC deficiency remodels the microenvironment and creates a vulnerability in mesenchymal colorectal cancer

Affiliations

Hyaluronan driven by epithelial aPKC deficiency remodels the microenvironment and creates a vulnerability in mesenchymal colorectal cancer

Anxo Martinez-Ordoñez et al. Cancer Cell. .

Abstract

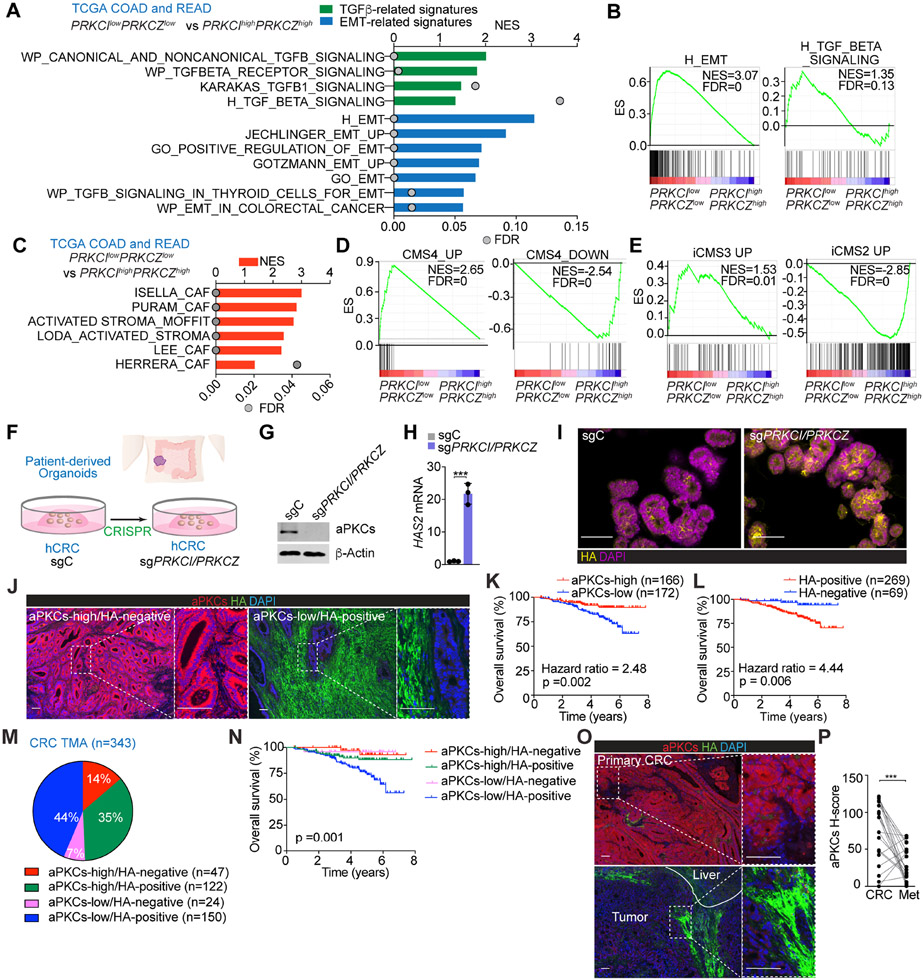
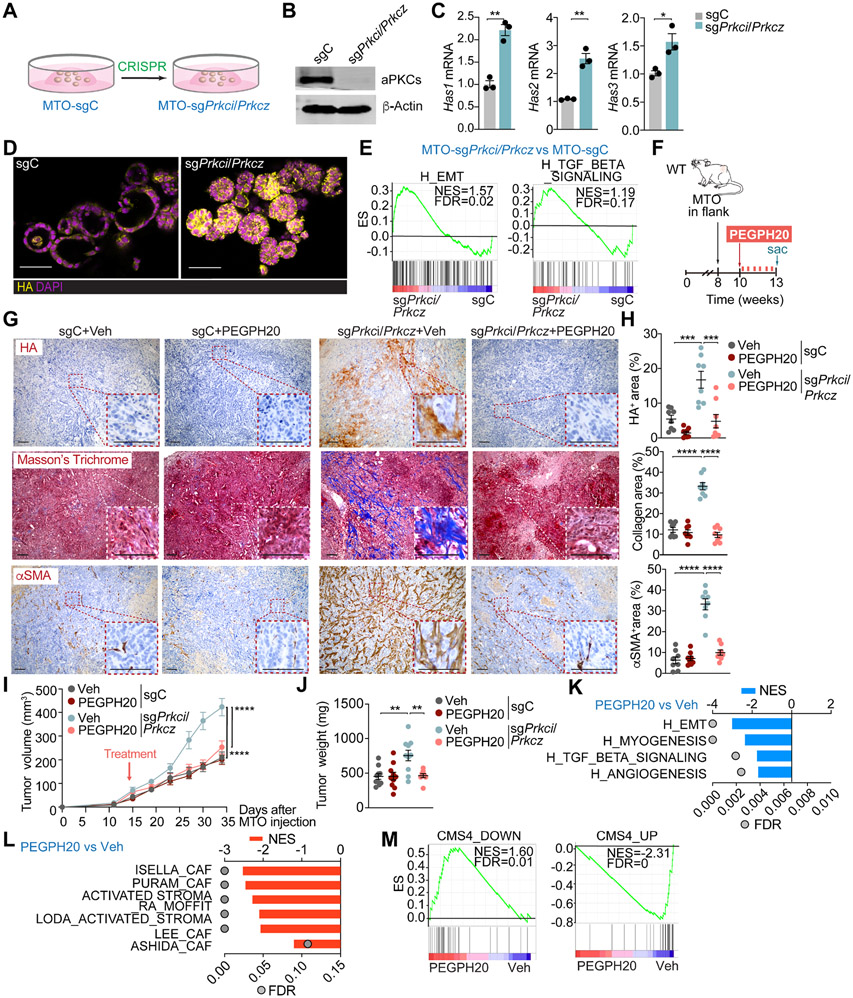
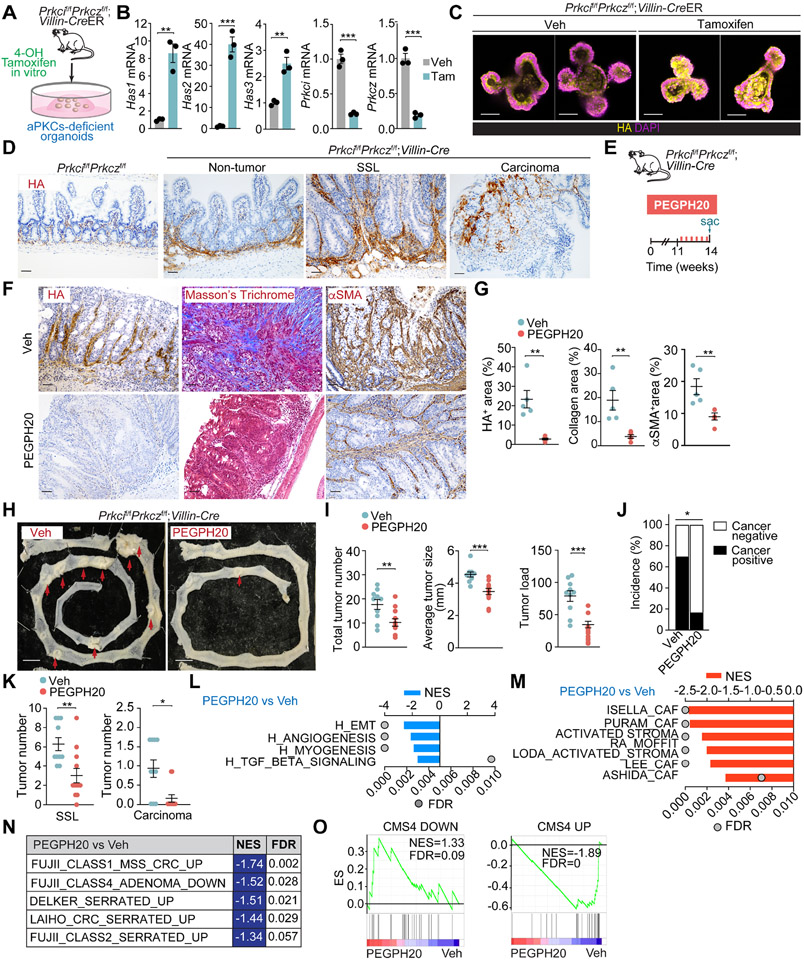
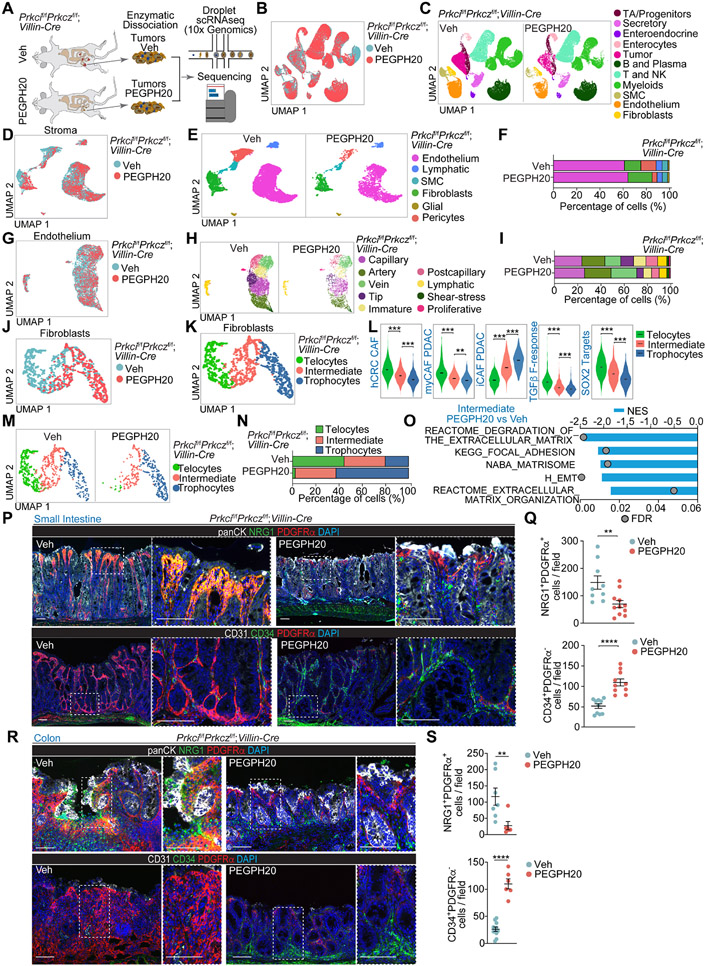
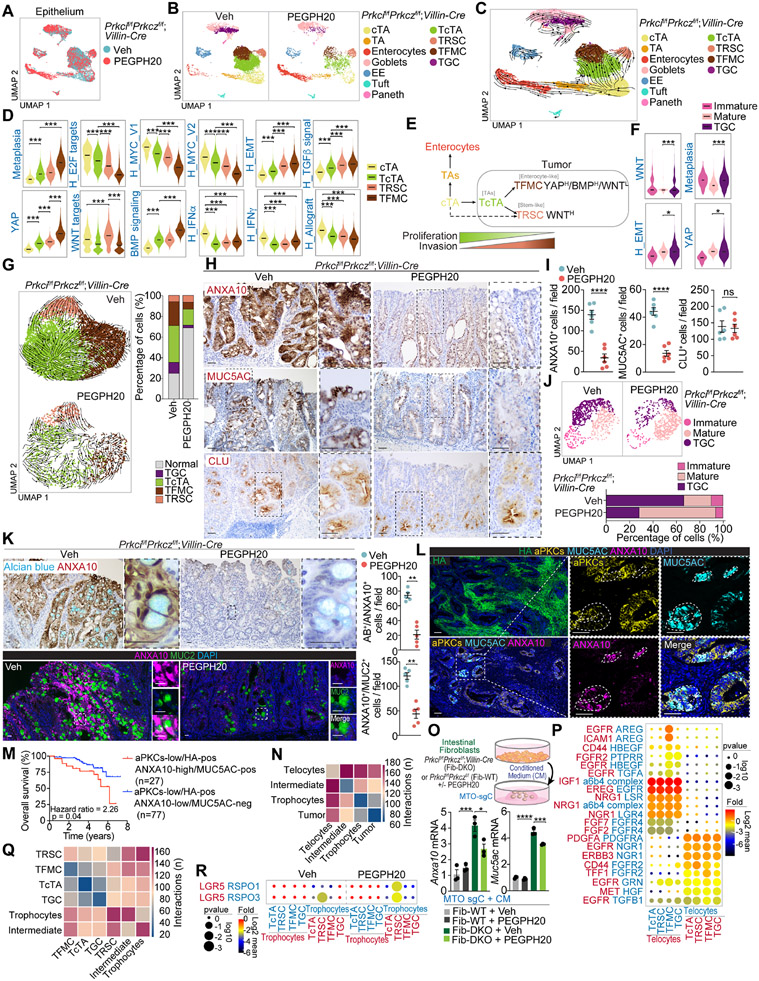
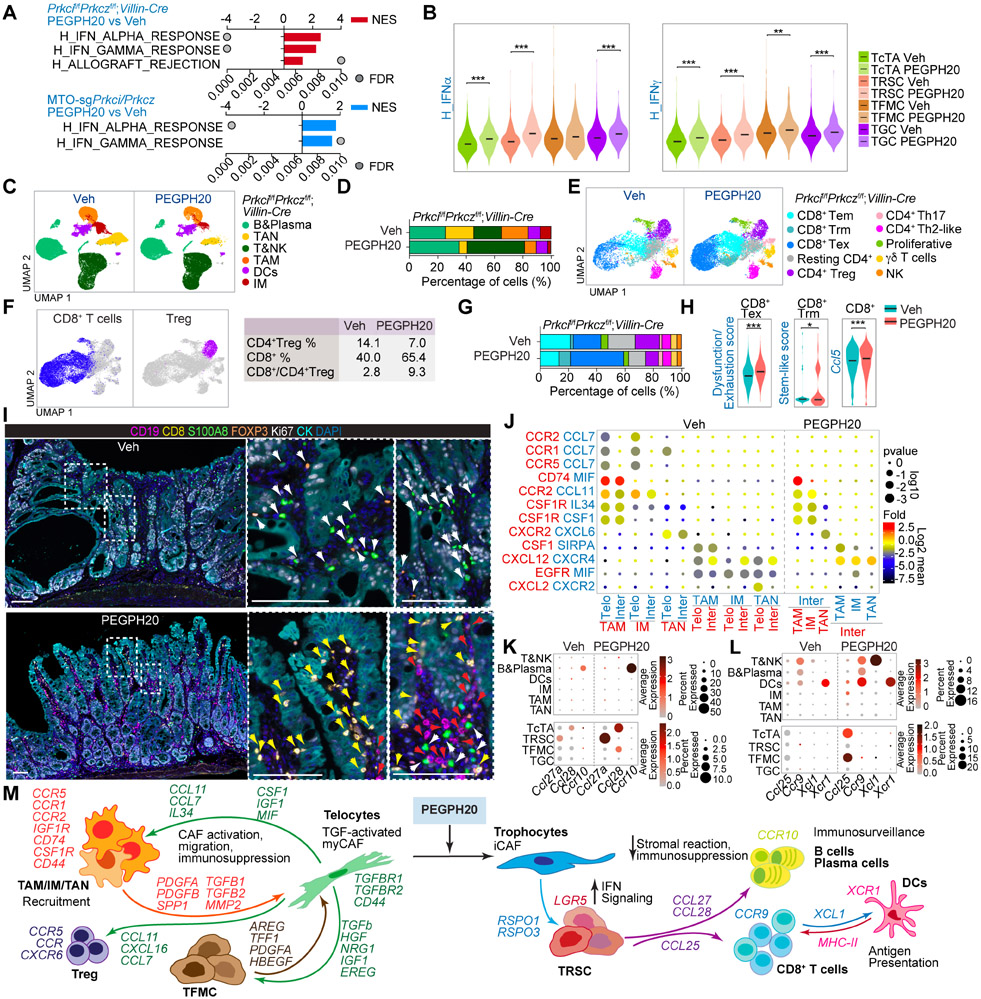
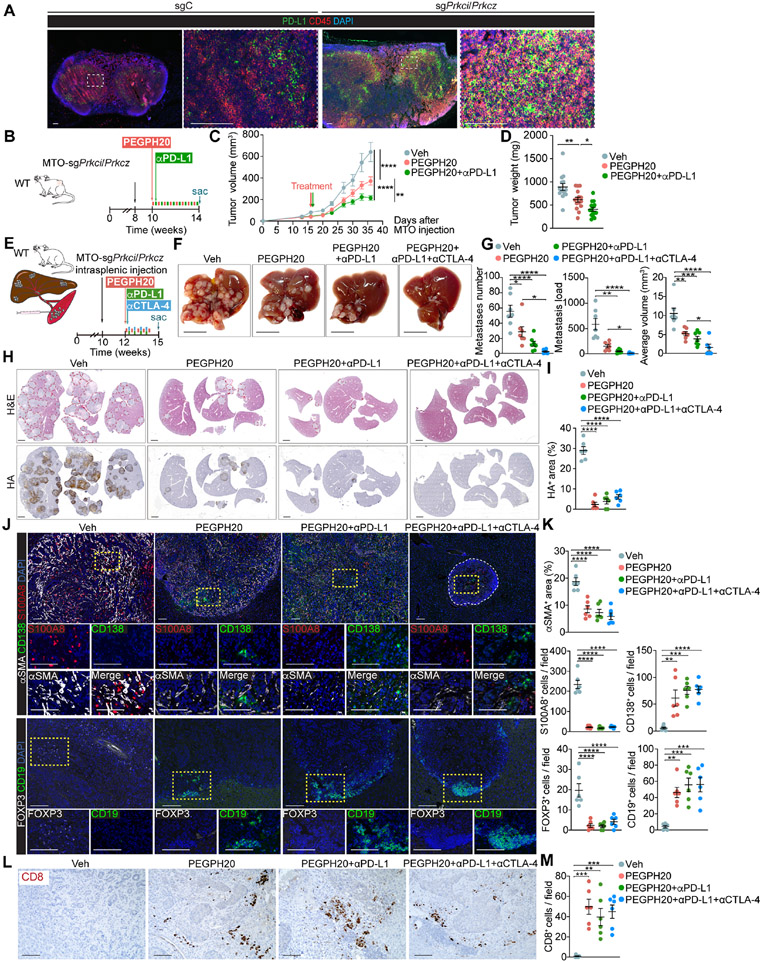
Mesenchymal colorectal cancer (mCRC) is microsatellite stable (MSS), highly desmoplastic, with CD8+ T cells excluded to the stromal periphery, resistant to immunotherapy, and driven by low levels of the atypical protein kinase Cs (aPKCs) in the intestinal epithelium. We show here that a salient feature of these tumors is the accumulation of hyaluronan (HA) which, along with reduced aPKC levels, predicts poor survival. HA promotes epithelial heterogeneity and the emergence of a tumor fetal metaplastic cell (TFMC) population endowed with invasive cancer features through a network of interactions with activated fibroblasts. TFMCs are sensitive to HA deposition, and their metaplastic markers have prognostic value. We demonstrate that in vivo HA degradation with a clinical dose of hyaluronidase impairs mCRC tumorigenesis and liver metastasis and enables immune checkpoint blockade therapy by promoting the recruitment of B and CD8+ T cells, including a proportion with resident memory features, and by blocking immunosuppression.

Keywords: aPKC; colorectal cancer; hyaluronan; immune checkpoint therapy; immunosuppression; inflammation; liver metastasis; mesenchymal; stroma; tumor microenvironment.


Conflict of interest statement

Declaration of interests A.M.-O., A.D., Y.N., J.M., and M.T.D.-M. are co-inventors of Weill Cornell Medicine patent applications covering methods for treating mesenchymal colorectal cancer. J.M., M.T.D.-M., and D.S. are co-founders of Zelambio.

Figures

Figure 1.
Figure 1.. aPKC-low levels correlate with HA-deposition and poor prognosis in human CRC
(A) GSEA of transcriptomic data from TCGA CRC patients according to PRKCI/PRKCZ expression. (B) GSEA plots of the indicated gene signatures from TCGA CRC patients according to PRKCI/PRKCZ expression. (C) GSEA of transcriptomic data from TCGA CRC patients according to PRKCI/PRKCZ expression using stroma-related signatures. (D and E) GSEA plots of the indicated gene signatures in TCGA CRC patients according to PRKCI/PRKCZ expression. (F) Experimental design of PRKCI and PRKCZ editing in patient-derived organoids (PDOs) from CRC. (G) Immunoblot of indicated proteins in sgPRKCI/PRKCZ and sgC PDOs (n=3 biological replicates). (H) qPCR of HAS2 in sgPRKCI/PRKCZ and sgC PDOs. Unpaired t-test. Data shown as mean ± SEM (n=3 biological replicates). ***p < 0.001. (I) Immunofluorescence (IF) for HA (yellow) in sgPRKCI/PRKCZ and sgC PDOs. Scale bars, 50 μm (J) IF for aPKCs (red) and HA (green) in a human cohort of CRC samples (n=390). Scale bars, 100 μm. (K and L) Kaplan-Meier curve for overall survival of CRC patients according to aPKCs (K) and HA (L) expression. Log-rank tests. (M and N) Pie chart of relative distribution of CRC patients according to aPKCs/HA expression (M) and Kaplan-Meier curve for overall survival. Log-rank test (N). (O and P) IF for aPKCs (red) and HA (green) (O) and quantification (P) in primary CRC samples and metastatic counterparts (n=21, paired). Paired t-test. ***p < 0.001. Scale bars, 100 μm. See also Figure S1.
Figure 2.
Figure 2.. Targeting HA disrupts the desmoplastic response and impairs mesenchymal tumorigenesis
(A) Experimental design of Prkci and Prkcz editing in mouse tumor organoids (MTO). (B) Immunoblot analysis of indicated proteins in MTO-sgPrkci/Prkcz and MTO-sgC (n=3 biological replicates). (C) qPCR of indicated genes in MTO-sgPrkci/Prkcz and MTO-sgC (n=3 biological replicates). Unpaired t-test. Data shown as mean ± SEM. *p < 0.05, **p< 0.01. (D) IF for HA (yellow) in MTO-sgPrkci/Prkcz and MTO-sgC. Scale bars, 50 μm. (E) GSEA plots of the indicated gene set signatures for MTO-sgPrkci/Prkcz versus MTO-sgC (n=3 biological replicates). (F-J) Subcutaneous injection of MTO-sgPrkci/Prkcz and MTO-sgC in WT mice. Mice were treated twice a week with Veh or PEGPH20 0.0375 mg/kg for 3 weeks (MTO: sgC Veh n=10, sgC PEGPH20-treated n=10, sgPrkci/Prkcz Veh n=10, and sgPrkci/Prkcz PEGPH20-treated n=8). Experimental design (F); Immunohistochemistry (IHC) for HA, Masson’s trichrome, and αSMA staining (G); quantification, one-way ANOVA and post hoc Tukey’s test, data shown as mean ± SEM, (n=8), ***p < 0.001, ****p < 0.0001 (H); tumor volume, two-way ANOVA and post hoc Tukey’s test, data shown as mean ± SEM, ****p < 0.0001 (I) and tumor weight, one-way ANOVA and post hoc Tukey’s test, data shown as mean ± SEM, **p< 0.01 (J). Scale bars, 100 μm. Sac: sacrificed. (K and L) GSEA from Quant-seq on MTO-sgPrkci/Prkcz PEGPH20-treated tumors (n=4) versus Veh (n=3) using compilation H (MSigDB) (K) and stroma-related signatures (L). (M) GSEA plots of the indicated gene signatures for MTO-sgPrkci/Prkcz PEGPH20-treated tumors (n=4) versus Veh (n=3). See also Figure S2.
Figure 3.
Figure 3.. Targeting HA represses mesenchymal intestinal CRC
(A) Experimental design for tamoxifen treatment in organoids from Prkcif/fPrkczf/f;Villin-CreER mice. (B) qPCR of indicated genes in tamoxifen- or Veh-treated organoids (n= 3 biological replicates). Unpaired t-test. Data shown as mean ± SEM. **p< 0.01, ***p < 0.001. (C) IF for HA (yellow) of Veh****- or tamoxifen-treated organoids. Scale bars, 50 μm. (D) IHC for HA of small intestinal sections from Prkcif/fPrkczf/f and Prkcif/fPrkczf/f;Villin-Cre mice. Scale bars, 50 μm. (E-K) Prkcif/fPrkczf/f;Villin-Cre mice (male and female, 11-week-old) treated with Veh (n=10) or PEGPH20 (n=12), 0.0375 mg/kg for 3 weeks. Experimental design (E); IHC HA, Masson’s trichrome, and αSMA (F); staining quantification, unpaired t-test, data shown as mean ± SEM (n=5), **p< 0.01 (G); macroscopic images of small intestinal tumors (H); total tumor number, tumor size, and tumor load in small intestine, unpaired t-test and Mann-Whitney test, data shown as mean ± SEM, **p< 0.01, ***p < 0.001 (I); quantification of cancer incidence, chi-square, *p < 0.05 (J); and sessile serrated lesions (SSL) and carcinoma quantification of tumors, Mann-Whitney test, data shown as mean ± SEM, *p < 0.05, **p< 0.01 (K). Scale bars, 50 μm (F), 10 mm (H). The red arrow denotes tumors >5mm (H). Sac: sacrificed. (L-N) GSEA of transcriptomic data from Quant-seq on PEGPH20-treated tumors versus Veh (n=3) using compilation H (MSigDB) (L), stroma-related signatures (M) and serrated-related signatures (N). (O) GSEA plots of the indicated gene signatures for PEGPH20-treated tumors versus Veh (n=3). See also Figure S3.
Figure 4.
Figure 4.. Remodeling of the mesenchymal intestinal tumor stroma by PEGPH20 treatment
(A) Experimental design and workflow of scRNAseq. Small intestinal tumors from Veh (n=5) and PEGPH20-treated mice (n=3) were dissected and digested into single-cell suspensions for sequencing. (B and C) Uniform manifold approximation and projection (UMAP) of tumor cells colored by treatment (B) and by the major cellular compartments (C). (D and E) UMAP of stromal cells colored by treatment (D) and by the major stromal cell type (E). (F) Stromal-cell-type percentage relative to the total stromal cells count per treatment. (G and H) UMAP of endothelial cells colored by treatment (G) and by endothelial cell type (H). (I) Endothelial-cell-type percentage relative to the total stromal cells count per treatment. (J and K) UMAP of fibroblast colored by treatment (J) and by fibroblast cell type (K). (L) Violin plots for the indicated gene signatures in the fibroblast cell types. The top and bottom of the violin plots represent the minimal and maximal values, and the width is based on the kernel density estimate of the data, scaled to have the same width for all clusters. Horizontal lines represent median values. Unpaired t-test, **p< 0.01, ***p < 0.001. (M and N) UMAP of fibroblast colored by fibroblast cell type (M) and fibroblast-cell-type percentage relative to the total fibroblast count per treatment (N). (O) Significantly enriched extracellular matrix (ECM)-related signatures in intermediate fibroblast treated with PEGPH20 versus Veh. (P and Q) PDGFRα staining (red) with NRG1 (green) and panCK (white), CD34 staining (green) with PDFGRα (red) and CD31 (white) (P), and quantification, unpaired t-test, data shown as mean ± SEM, **p< 0.01, ****p < 0.0001 (Q) in Veh- and PEGPH20-treated small intestine tumors (n=5). (R and S) PDGFRα staining (red) with NRG1 (green) and panCK (white), CD34 staining (green) with PDFGRα (red) and CD31 (white) (R), and quantification, unpaired t-test and Mann-Whitney test, data shown as mean ± SEM, **p< 0.01, ****p < 0.0001 (S) in Veh- and PEGPH20-treated colon tumors (n=3). Scale bars, 100 μm. See also Figures S4 and S5.
Figure 5.
Figure 5.. scRNA-seq reveals a complex heterogeneity and hierarchy maintained by HA in tumor epithelial cells
(A and B) UMAP of epithelial cells colored by treatment (A) and by epithelial cell type (B). (C) RNA velocities visualized on the UMAP projection in (B). (D) Violin plots for the indicated gene signatures in cycling transient amplifying (cTAs), tumor cTAs (TcTAs), tumor revival stem cells (TRSCs), and tumor fetal metaplastic cells (TFMCs). The top and bottom of the violin plots represent the minimal and maximal values, and the width is based on the kernel density estimate of the data, scaled to have the same width for all clusters. Horizontal lines represent median values. Unpaired t-test. ***p < 0.001. (E) Scheme showing that cTAs can differentiate to TcTA and conserve epithelial cancer cell hierarchical heterogeneity. (F) Violin plots for the indicated gene signatures in immature goblet cells, mature goblet cells, and tumor goblet cells (TGC). The top and bottom of the violin plots represent the minimal and maximal values, and the width is based on the kernel density estimate of the data, scaled to have the same width for all clusters. Horizontal lines represent median values. Unpaired t-test. *p < 0.05, ***p < 0.001. (G) RNA velocities in tumor epithelial cells for each treatment and tumor-cell-type percentage relative to the total tumoral cells count per treatment. (H and I) IHC for ANXA10, MUC5AC and CLU (H), and quantification, unpaired t-test, data shown as mean ± SEM, ****p < 0.0001 (I) in PEGPH20-treated tumors (n=5). Scale bars, 50 μm. ns: not significant. (J) UMAP of goblet cells colored by goblet cell type and goblet-cell-type percentage relative to the total goblet cells count per treatment. (K) IHC for ANXA10 with alcian blue, IF for ANXA10 (magenta) and MUC2 (green), and quantification in Veh- and PEGPH20-treated tumors (n=5). Mann-Whitney test, data shown as mean ± SEM, **p < 0.01. Scale bars, 25 μm. (L) IF for HA (green), aPKCs (yellow), MUC5AC (cyan), and ANXA10 (magenta) in Veh- and PEGPH20-treated tumors (n=5). Scale bars, 100 μm. (M) Kaplan-Meier curve for 8-year overall survival of TCGA CRC patients according to aPKCs/HA/ANXA10/MUC5AC expression. Log-rank test. (N) CellphoneDB analysis of the number of ligand-receptor interactions between tumor epithelial cells and fibroblast. (O) Anxa10 and Muc5ac mRNA levels of MTO-sgC stimulated by conditioned medium (CM) of indicated intestinal fibroblasts with or without PEGPH20 (2.5 μg/ml) for 3 days (n=3). Schematic representation and qPCR. One-way ANOVA and post hoc Tukey’s test, data shown as mean ± SEM, *p < 0.05, ***p < 0.001, ****p < 0.0001. (P) Dot plot for ligand-receptor pairs of growth factors between telocytes and tumor epithelial in Veh-treated tumors. (Q and R) CellphoneDB analysis of the number of ligand-receptor interactions between tumor epithelial cells and fibroblast cell types (Q) and dot plot for ligand-receptor pairs of Lgr5 and Rspo co-factors between trophocyte and tumor epithelial in Veh- and PEGPH20-treated tumors (R). See also Figures S6 and S7.
Figure 6.
Figure 6.. HA induces immunosuppression and impairs immunosurveillance in mesenchymal intestinal tumors
(A) GSEA of transcriptomic data from Quant-seq on Prkcif/fPrkczf/f;Villin-Cre PEGPH20-treated tumors versus Veh (n=3) (top), and MTO-sgPrkci/Prkcz PEGPH20-treated tumors (n=4) versus Veh (n=3) (bottom) using compilation H (MSigDB). (B) Violin plots for the indicated gene signatures in TcTAs, TRSCs, TFMCs, and TGCs treated with Veh or PEGPH20. The top and bottom of the violin plots represent the minimal and maximal values, and the width is based on the kernel density estimate of the data, scaled to have the same width for all clusters. Horizontal lines represent median values. Unpaired t-test, **p < 0.01, ***p < 0.001. (C and D) UMAP of all immune cells colored by the major immune cell type (C) and immune-cell-type percentage relative to the total immune cells count per treatment (D). (E and F) UMAP of all T cells colored by the T cell type (E) and canonical lineage marker expression for CD8+T cell and CD4+Treg (left) showing the percentage of CD4+Treg, CD8+T, and CD8+T:CD4+Treg ratio per treatment (right) (F). (G) T-cell-type percentage relative to the total T cells count per treatment. (H) Violin plots for the indicated gene signatures in CD8+T cells treated with Veh or PEGPH20. The top and bottom of the violin plots represent the minimal and maximal values, and the width is based on the kernel density estimate of the data, scaled to have the same width for all clusters. Horizontal lines represent median values. Unpaired t-test, *p < 0.05, ***p < 0.001. (I) Seven-color overlay image for the indicated protein staining in Veh- and PEGPH20-treated tumors (n=3). Scale bars, 100 μm. The white arrows denote CD4+Treg and myeloid cells; the yellow arrows mark CD8+T cells and the red arrows point to B cells. (J) CellphoneDB analysis of ligand-receptor pairs of cytokines between telocytes, intermediate and myeloid cells in Veh- or PEGPH20-treated tumors. (K and L) Dot plot of ligand-receptor pairs of Ccl27a/Ccl28-Ccr10 (K) and Ccl25-Ccr9 and Xcl1-Xcr1 (L) between tumor epithelial cells and immune cells in Veh- or PEGPH20-treated tumors. (M) Predicted regulatory crosstalk between tumor epithelial cells, fibroblasts, and the immune system in Veh- or PEGPH20-treated tumors. See also Figure S8.
Figure 7.
Figure 7.. The combination therapy of PEGPH20 with anti-PDL1 improves the response of mesenchymal CRC tumors
(A) IF for PD-L1 (green) and CD45 (red) of tumor-draining lymph nodes in MTO-sgC and MTO-sgPrkci/Prkcz. Scale bars, 100 μm. (B-D) Subcutaneous injection of MTO-sgPrkci/Prkcz in WT mice treated twice a week with PEGPH20 (0.0375 mg/kg) and αPD-L1 (5 mg/kg) for 4 weeks (n:Veh= 14, PEGPH20-treated=15 and PEGPH20-treated with αPD-L1=15). Experimental design (B); tumor volume, two-way ANOVA and post hoc Tukey’s test, data shown as mean ± SEM, **p < 0.01, ****p < 0.0001 (C); tumor weight, one-way ANOVA and post hoc Tukey’s test, data shown as mean ± SEM, *p < 0.05, **p < 0.01 (D). Sac: sacrificed. (E-M) Intrasplenic injection of MTO-sgPrkci/Prkcz in WT mice. Mice were treated twice a week with Veh or PEGPH20 0.0375 mg/kg and/or αPD-L1 (5 mg/kg) and/or αCTLA-4 (100 μg/dose) for 2.5 weeks (n: Veh-treated =7, PEGPH20-treated=7, PEGPH20 and αPD-L1-treated =7, and PEGPH20 and αCTLA-4-treated=6). Experimental design (E); macroscopic images of liver metastasis tumors (F); total metastases number, tumor load, and average tumor volume, one-way ANOVA and post hoc Tukey’s test, data shown as mean ± SEM, *p < 0.05, **p < 0.01, ***p < 0.001, ****p < 0.0001 (G); H&E staining and IHC for HA (H) and quantification, one-way ANOVA and post hoc Tukey’s test, data shown as mean ± SEM, (n=4), ****p < 0.0001 (I); IF for αSMA (white), CD138 (green) and S100A8 (red), IF for FOXP3 (white) and CD19 (green) (J), and staining quantification, one-way ANOVA and post hoc Tukey’s test, data shown as mean ± SEM, **p < 0.01, ***p < 0.001, ****p < 0.0001 (K); CD8 staining (L) and quantification, one-way ANOVA and post hoc Tukey’s test, data shown as mean ± SEM, (n=3), **p < 0.01, ***p < 0.001 (M); in liver metastases (n=5). Scale bars, 10 mm (F), 2 mm (H), 100 μm (J, L). The red line denotates liver metastases (H). Sac: sacrificed. See also Figure S9.

References

    1. Siegel RL, Miller KD, Goding Sauer A, Fedewa SA, Butterly LF, Anderson JC, Cercek A, Smith RA, and Jemal A (2020). Colorectal cancer statistics, 2020. CA Cancer J Clin 70, 145–164. 10.3322/caac.21601. - DOI - PubMed
    1. Martini G, Dienstmann R, Ros J, Baraibar I, Cuadra-Urteaga JL, Salva F, Ciardiello D, Mulet N, Argiles G, Tabernero J, and Elez E (2020). Molecular subtypes and the evolution of treatment management in metastatic colorectal cancer. Ther Adv Med Oncol 12, 1758835920936089. 10.1177/1758835920936089. - DOI - PMC - PubMed
    1. Huyghe JR, Harrison TA, Bien SA, Hampel H, Figueiredo JC, Schmit SL, Conti DV, Chen S, Qu C, Lin Y, et al. (2021). Genetic architectures of proximal and distal colorectal cancer are partly distinct. Gut 70, 1325–1334. 10.1136/gutjnl-2020-321534. - DOI - PMC - PubMed
    1. Missiaglia E, Jacobs B, D'Ario G, Di Narzo AF, Soneson C, Budinska E, Popovici V, Vecchione L, Gerster S, Yan P, et al. (2014). Distal and proximal colon cancers differ in terms of molecular, pathological, and clinical features. Ann Oncol 25, 1995–2001. 10.1093/annonc/mdu275. - DOI - PubMed
    1. Overman MJ, McDermott R, Leach JL, Lonardi S, Lenz HJ, Morse MA, Desai J, Hill A, Axelson M, Moss RA, et al. (2017). Nivolumab in patients with metastatic DNA mismatch repair-deficient or microsatellite instability-high colorectal cancer (CheckMate 142): an open-label, multicentre, phase 2 study. Lancet Oncol 18, 1182–1191. 10.1016/S1470-2045(17)30422-9. - DOI - PMC - PubMed

Publication types

Substances