. 2023 Jan 9;41(1):88-105.e8.
doi: 10.1016/j.ccell.2022.11.015. Epub 2022 Dec 15.

KMT2D deficiency drives lung squamous cell carcinoma and hypersensitivity to RTK-RAS inhibition

Affiliations

KMT2D deficiency drives lung squamous cell carcinoma and hypersensitivity to RTK-RAS inhibition

Yuanwang Pan et al. Cancer Cell. .

Abstract

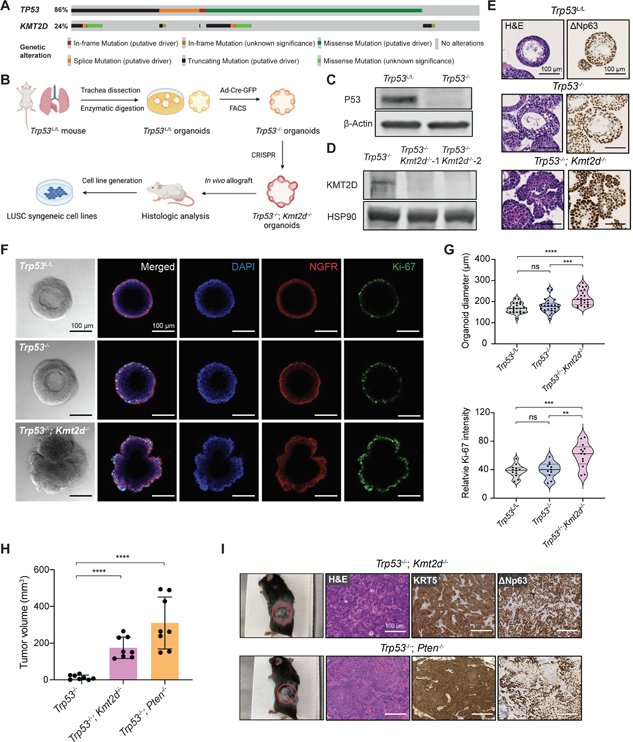
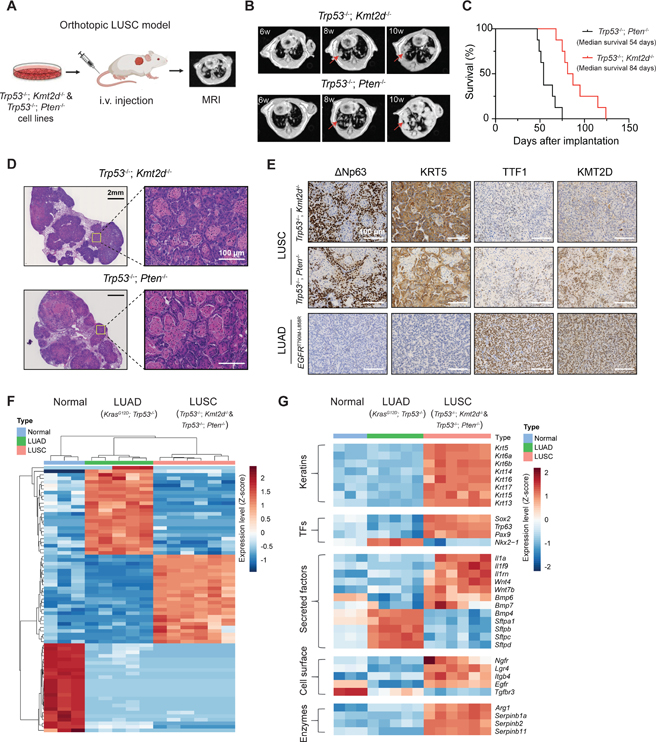
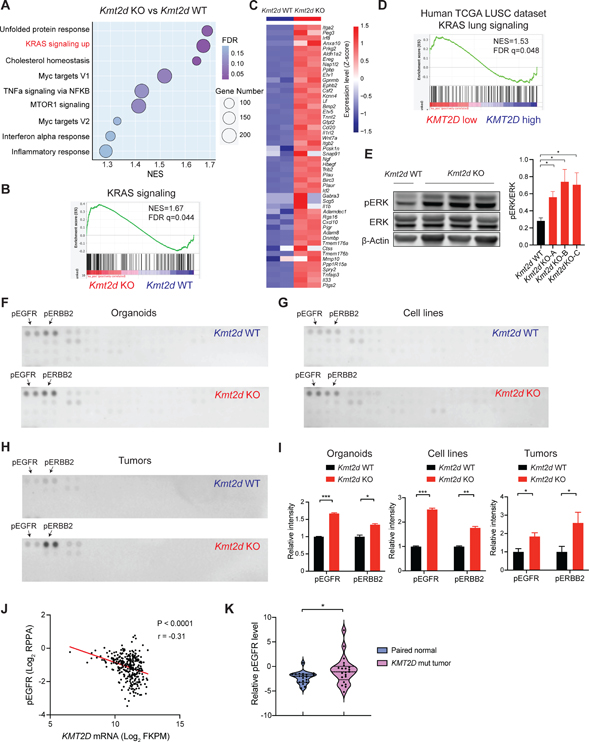
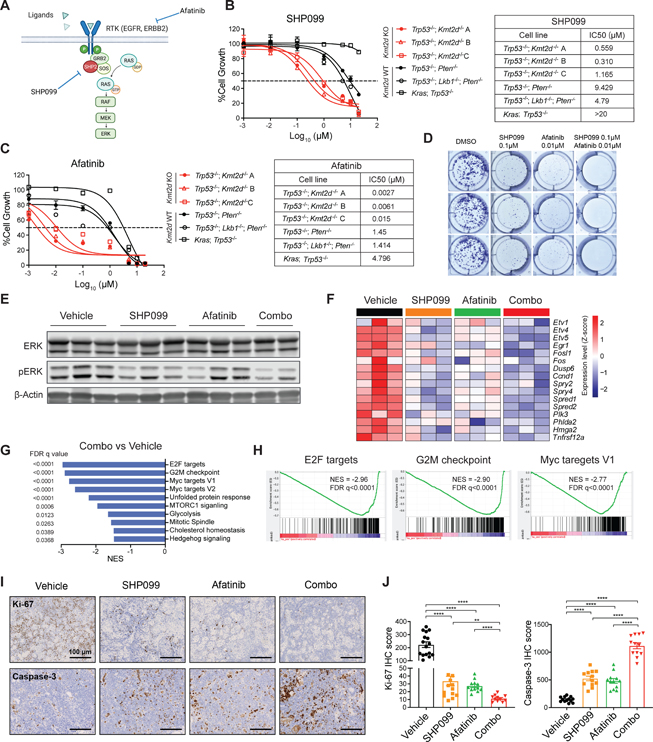
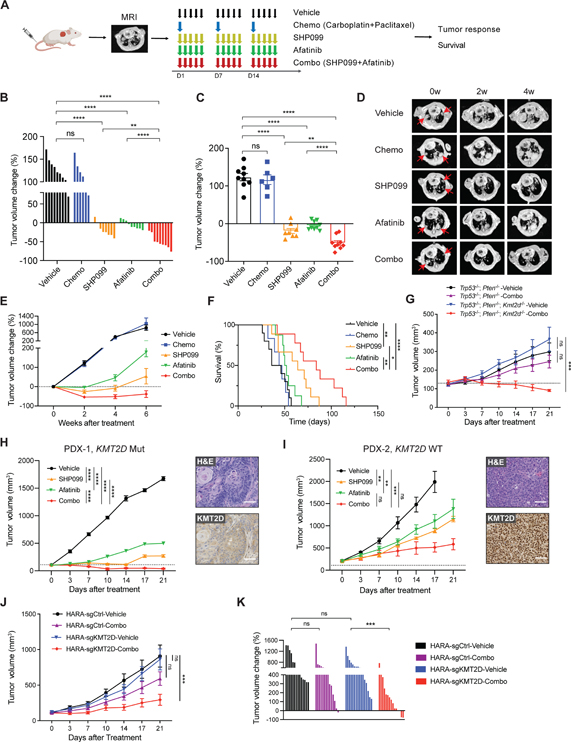
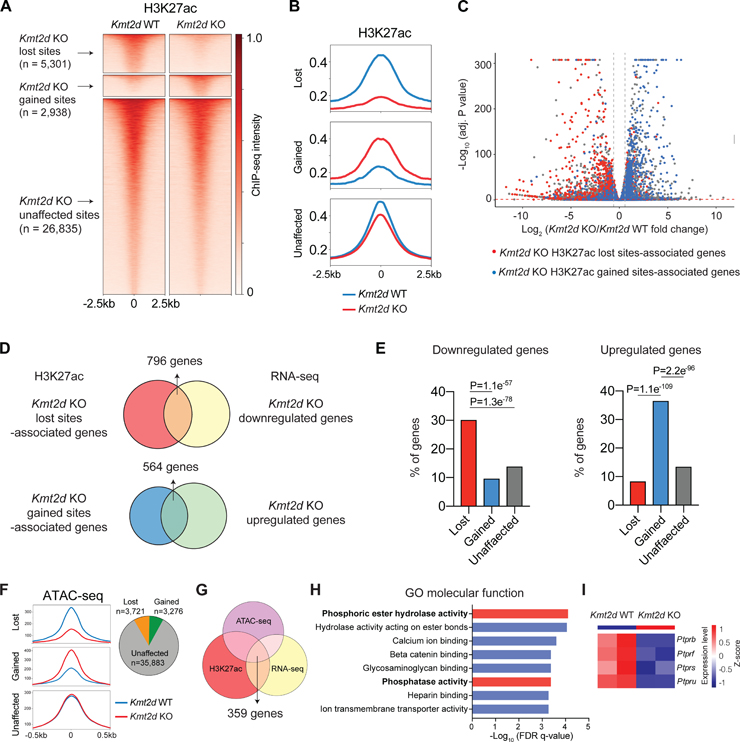
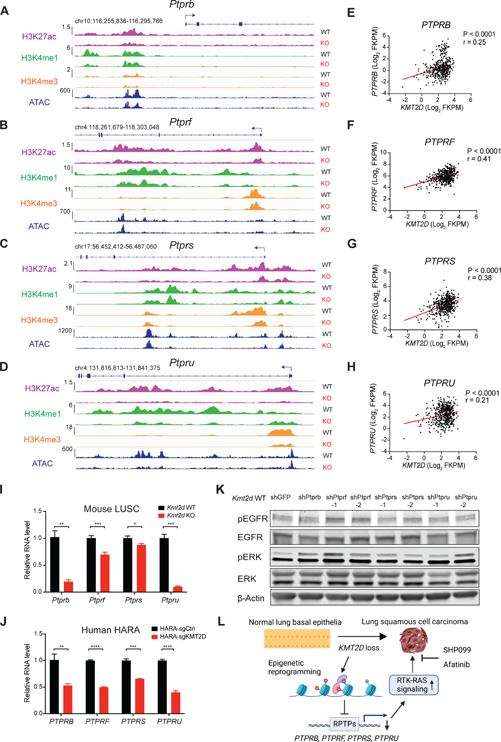
Lung squamous cell carcinoma (LUSC) represents a major subtype of lung cancer with limited treatment options. KMT2D is one of the most frequently mutated genes in LUSC (>20%), and yet its role in LUSC oncogenesis remains unknown. Here, we identify KMT2D as a key regulator of LUSC tumorigenesis wherein Kmt2d deletion transforms lung basal cell organoids to LUSC. Kmt2d loss increases activation of receptor tyrosine kinases (RTKs), EGFR and ERBB2, partly through reprogramming the chromatin landscape to repress the expression of protein tyrosine phosphatases. These events provoke a robust elevation in the oncogenic RTK-RAS signaling. Combining SHP2 inhibitor SHP099 and pan-ERBB inhibitor afatinib inhibits lung tumor growth in Kmt2d-deficient LUSC murine models and in patient-derived xenografts (PDXs) harboring KMT2D mutations. Our study identifies KMT2D as a pivotal epigenetic modulator for LUSC oncogenesis and suggests that KMT2D loss renders LUSC therapeutically vulnerable to RTK-RAS inhibition.

Keywords: EGFR; ERBB2; KMT2D; SHP2; lung squamous cell carcinoma; organoids.


Conflict of interest statement

Declaration of interests K.-K.W. is a founder and equity holder of G1 Therapeutics and has sponsored research agreements with Takeda, TargImmune, Bristol-Myers Squibb (BMS), Mirati, Merus, and Alkermes and consulting and sponsored research agreements with AstraZeneca, Janssen, Pfizer, Novartis, Merck, Zentalis, BridgeBio, and Blueprint. A.J.B. has received funding from Bayer, Novartis, Merck, and Repare and is a co-founder with equity in Signet Therapeutics. Y.P., H.Han., H.Z., and K.-K.W. have ownership interest in a patent application.

Figures

Figure 1.
Figure 1.. Kmt2d deletion promotes lung organoids transformation
(A) OncoPrint showing frequency of KMT2D mutations and their co-occurrence with TP53 mutations in human LUSC database (TCGA, PanCancer Atlas, n=469). (B) Schematic illustration of the workflow for establishing mutant organoids and syngeneic cell lines from parental Trp53L/L lung basal cell organoids. (C) Western blot confirmation of P53 loss in the Trp53−/− organoids, with β-Actin as the loading control. (D) Western blot confirmation of KMT2D loss in the Trp53−/−; Kmt2d−/− organoids, with HSP90 as the loading control. (E) Representative images of hematoxylin and eosin (H&E) staining, and immunohistochemistry (IHC) staining of ΔNp63 in organoids with indicated genotypes. Scale bars, 100 μm. (F) Representative images from brightfield microscopy and immunofluorescence staining of organoids after 7 days of culture. Organoids were stained with DAPI (blue), NGFR (red) and Ki-67 (green). Scale bars, 100 μm. (G) Violin plots showing quantifications of the diameter and relative Ki-67 intensity in organoids with indicated genotypes. **p < 0.01, ***p < 0.001, ****p < 0.0001, NS, not significant (unpaired two-tailed t test). (H) Quantifications of tumor volumes 6 weeks after implanting organoids into C57BL/6J mice. Data shown as means ± SEM. ****p < 0.0001 (unpaired two-tailed t test). (I) (Left) Representative images of subcutaneous tumors from implanted organoids with indicated genotypes. The red circles indicate the tumors. (Right) Representative images of H&E staining and IHC staining of KRT5 and ΔNp63 in tumors derived from Trp53−/−; Kmt2d−/− and Trp53−/−; Pten−/− organoids. Scale bars, 100 μm. See also Figures S1 and S2.
Figure 2.
Figure 2.. Kmt2d deletion drives LUSC in vivo
(A) Schematic illustration for the orthotopic LUSC model from tumor-derived syngeneic cells. Tumor growth was monitored by magnetic resonance imaging (MRI). (B) Representative mouse lung MRI images at indicated times after injecting cells with indicated genotypes. The red arrows indicate lung tumors. (C) Kaplan-Meier curves of tumor bearing mice with the indicated genotypes. (n = 8 for Trp53−/−; Kmt2d−/− and n = 8 for Trp53−/−; Pten−/−). (D) H&E staining of Trp53−/−; Kmt2d−/− and Trp53−/−; Pten−/− lung tumors showing squamous carcinoma histology. (E) Representative images of IHC staining of ΔNp63, KRT5, TTF1, and KMT2D from lung tumors with the indicated genotypes. Scale bars, 100 μm. (F) Heatmap and hierarchical clustering of differentially expressed transcripts from normal mouse lung tissues, LUAD (KrasG12D; Trp53−/−) and LUSC (Trp53−/−; Kmt2d−/− and Trp53-/−; Pten−/−). (G) Heatmap showing LUSC and LUAD marker gene expression in normal mouse lung tissues, LUAD (KrasG12D; Trp53−/−) and LUSC (Trp53−/−; Kmt2d−/− and Trp53−/−; Pten−/−). Genes shown were in “Keratins”, “Transcription factors (or TFs)”, “Secreted factors”, “Cell surface” and “Enzymes” categories. See also Figure S3.
Figure 3.
Figure 3.. Kmt2d deletion activates RTK-RAS signaling in LUSC
(A) Dot plots showing positively enriched pathways (NOM P < 0.05 and FDR q < 0.25) in Gene Set Enrichment Analysis (GSEA) comparing Kmt2d KO (Trp53−/−; Kmt2d−/−) versus the Kmt2d WT (Trp53−/−; Pten−/−) tumor-derived cell lines. “KRAS signaling up” ranks the second among positively enriched pathways. (B) GSEA analysis showing the significantly enriched KRAS signaling from Figure 3A. (C) Heatmap showing genes that were significantly upregulated (Log2FC >1) in the “KRAS signaling up” gene set from Figure 3B. (D) GSEA analysis showing the significantly enriched KRAS signaling pathway comparing KMT2D low versus KMT2D high LUSC tumors (TCGA LUSC dataset). (E) Western blot showing ERK, pERK and β-Actin in Kmt2d KO (Trp53−/−; Kmt2d−/−) and Kmt2d WT (Trp53−/−; Pten−/−) cells and quantifications of pERK/ERK. Data shown as means ± SEM. *p < 0.05 (unpaired two-tailed t test). (F-H) Phospho-receptor tyrosine kinase arrays for Kmt2d KO and Kmt2d WT organoids (F, Trp53−/− vs Trp53−/−; Kmt2d−/−), cell lines (G, Trp53−/−; Pten−/− vs Trp53−/−; Kmt2d−/−) and tumor nodules (H, Trp53−/−; Pten−/− vs Trp53−/−; Kmt2d−/−). pEGFR and pERBB2 are highlighted by the arrows. (I) Quantifications of pEGFR and pERBB2 in Kmt2d KO and the Kmt2d WT organoids, cell lines and tumor nodules as indicated above. Data shown as means ± SEM. *p < 0.05, **p < 0.01, ***p < 0.001 (unpaired two-tailed t test). (J) Scatter plots showing a negative correlation between KMT2D mRNA level and phospho-EGFR expression in human TCGA LUSC dataset. r, Pearson’s correlation coefficient. (K) Violin plots showing the relative phospho-EGFR protein expression in KMT2D mutant LUSC tumors and their paired normal lung tissues from Satpathy et al. *p < 0.05 (unpaired two-tailed t test). See also Figure S3.
Figure 4.
Figure 4.. Kmt2d-deficient LUSC is hypersensitive to SHP2 and pan-ERBB inhibition
(A) Schematic illustration of targeting RTK-RAS signaling through SHP2 inhibitor SHP099 and pan-ERBB inhibitor afatinib. (B and C) Cell viability assays of Kmt2d KO LUSC cell lines, Kmt2d WT LUSC cell lines, and LUAD (KP) cell line treated with SHP099 (B) and afatinib (C) for 72h. Data presented as mean ± SD (n = 3). The calculated IC50 values of SHP099 and afatinib are shown on the right. (D) Colony formation assay of Kmt2d KO cells treated with vehicle, SHP099, afatinib, and combination of SHP099 and afatinib for 7 days. (E) Western blot of ERK, pERK and β-Actin on Kmt2d KO (Trp53−/−; Kmt2d−/−) tumors treated with vehicle, SHP099, afatinib and combination of SHP099 and afatinib for 3 days. (F) Heatmap showing the changes in KRAS signaling downstream gene expression by RNA-seq in Kmt2d KO tumors treated as indicated in Figure 4E. (G) Plots showing top negatively enriched pathways in GSEA comparing combination of SHP099 and afatinib (combo) treated versus vehicle treated Kmt2d KO tumors. (H) GSEA analysis showing top negatively enriched pathways “E2F targets”, “G2M checkpoint” and “Myc targets V1” comparing combo treated tumors versus the vehicle treated tumors. (I) IHC analysis of Ki-67 and cleaved caspase-3 from Kmt2d KO tumors with indicated treatment. Scale bars, 100 μm. (J) Quantifications of IHC score of Ki-67 and cleaved caspase-3 of indicated treatment. Data shown as means ± SEM. **p < 0.01, ****p < 0.0001 (unpaired two-tailed t test). See also Figure S4.
Figure 5.
Figure 5.. SHP099 and afatinib diminish KMT2D-deficient LUSC in vivo
(A) Schematic showing in vivo dosing schedule. After inoculating LUSC cells into mice, lung tumor burden was confirmed by MRI. Mice were then randomized and treated with vehicle, chemotherapy (chemo, carboplatin + paclitaxel), SHP099 (75mpk, 5 days per week), afatinib (10mpk, 5 days per week) alone or combined SHP099 with afatinib. Tumor growth was measured by MRI and survival was recorded. (B and C) Waterfall plot (B) and dot plot (C) of changes in tumor volumes after 2 weeks of treatment in Kmt2d KO (Trp53−/−; Kmt2d−/−) LUSC model: vehicle (n=9), chemo (n=6), SHP099 (n=8), afatinib (n=9), and combo (n=9). (D) Representative MRI images of Kmt2d KO lung tumor at baseline (0 week), 2 weeks, and 4 weeks after treatment initiation. The red arrows indicate lung tumors. (E) Tumor volume changes of Kmt2d KO LUSC tumors treated as indicated in Figure 5A. (F) Kaplan-Meier survival curve for the Kmt2d KO LUSC model after indicated treatment. Vehicle (n=9), chemo (n=6), SHP099 (n=9), afatinib (n=8), and combo (n=9). *p < 0.05, **p < 0.01, ****p < 0.0001 (log-rank test). (G) Tumor volume changes of Trp53−/−; Pten−/− (n=7–8) and Trp53−/−; Pten−/−; Kmt2d−/− (n=6–8) allografts with indicated treatment. (H) Tumor volume changes of KMT2D mutant LUSC PDX (PDX-1, LX-515) following treatments with vehicle (n=4), SHP099 (n=5), afatinib (n=3) and combined SHP099 with afatinib (n=7). Representative images of H&E and IHC staining of KMT2D are shown. Scale bars, 100 μm. (I) Tumor volume changes of KMT2D WT LUSC PDX (PDX-2, LX-640) following treatments with vehicle (n=6), SHP099 (n=4), afatinib (n=5) and combined SHP099 with afatinib (n=6). Representative images of H&E and IHC staining of KMT2D are shown. Scale bars, 100 μm. (J) Tumor volume changes of human HARA-sgCtrl xenografts following treatments with vehicle (n=14), and combined SHP099 with afatinib (n=14), as well as HARA-sgKMT2D xenografts following treatments with vehicle (n=16), and combined SHP099 with afatinib (n=15). (K) Waterfall plot showing changes in tumor volumes after 3 weeks of treatment (as indicated in Figure 5J) in HARA-sgCtrl and HARA-sgKMT2D LUSC models. In (B), (C) and (K), data shown as means ± SEM, **p < 0.01, ***p < 0.001 ****p < 0.0001, NS, not significant (unpaired two-tailed t test). In (G), (H), (I) and (J), data shown as means ± SEM, **p < 0.01, ***p < 0.001, ****p < 0.0001, NS, not significant (ANOVA). See also Figure S5.
Figure 6.
Figure 6.. Kmt2d loss reprograms epigenetic landscape in LUSC
(A) Heatmaps showing the H3K27ac ChIP-seq signal in Kmt2d WT (Trp53−/−; Pten−/−) and Kmt2d KO (Trp53−/−; Kmt2d−/−) cell lines. Based on the ChIP-seq signal changes, H3K27ac sites were categorized into three groups: Kmt2d KO -lost, -gained and -unaffected. (B) Averaged H3K27ac ChIP-seq signal, centered at the Kmt2d KO-lost, -gained, and -unaffected H3K27ac sites. (C) RNA-seq results showing downregulated (left upper corner) and upregulated (right upper corner) genes in Kmt2d KO cell lines (FDR<0.05; Fold Change>1.5). Genes that were associated with lost and gained H3K27ac sites (genes with the closest distances to the sites) are highlighted by red and blue, respectively. (D) The comparison of lost H3K27ac sites-associated genes versus RNA-seq downregulated genes in Kmt2d KO cells (up). And the comparison of gained H3K27ac sites-associated genes versus RNA-seq upregulated genes in Kmt2d KO cells (down). (E) The percentage of genes associated with Kmt2d KO -gained, -lost and -unaffected H3K27ac sites that were downregulated (left) or upregulated (right) based on RNA-seq results. (F) Averaged ATAC-seq signal, centered at the Kmt2d KO-lost, -gained, and -unaffected ATAC-seq sites (left). Pie graft showing number of Kmt2d KO -lost, -gained, and -unaffected ATAC-seq sites (right). (G) Overlap of H3K27ac lost sites-associated genes, ATAC lost sites-associated genes, and RNA-seq downregulated genes in Kmt2d KO cells. (H) Gene ontology (GO) analysis enriched pathways in “molecular function”, based on overlapped genes in (G). (I) Heatmap of RPTPs gene expression (RNA-seq) in Kmt2d KO and Kmt2d WT cells. See also Figure S6 and Table S1.
Figure 7
Figure 7. KMT2D loss suppresses the expression of receptor tyrosine phosphatases.
(A-D) Representative H3K27ac, H3K4me1 and H3K4me3 and ATAC-seq signal at loci of Ptprb (A), Ptprf (B), Ptprs (C) and Ptpru (D) in Kmt2d WT (Trp53−/−; Pten−/−) and Kmt2d KO (Trp53−/−; Kmt2d−/−) cells. (E-H) Scatterplots showing positive correlations of KMT2D mRNA levels with PTPRB (E), PTPRF (F), PTPRS (G) and PTPRU (H) mRNA levels in human TCGA LUSC dataset. r, Pearson’s correlation coefficient. (I and J) qRT-PCR analysis of PTPRB, PTPRF, PTPRS, and PTPRU gene expression in KMT2D KO and KMT2D WT mouse LUSC cells (I) and human HARA cells (J). Data shown as means ± SEM. *p < 0.05, **p < 0.01, ***p < 0.001, ****p < 0.0001 (unpaired two-tailed t test). (K) Western blot of pEGFR, EGFR, pERK, ERK and β-Actin in Kmt2d WT (Trp53−/−; Pten−/−) cells with knockdown of Ptprb, Ptprf, Ptprs and Ptpru using shRNA. (L) Schematic showing the proposed model of how KMT2D loss promotes LUSC tumorigenesis and hypersensitivity to RTK-RAS inhibition by SHP099 and afatinib. See also Figure S6.

References

    1. Sung H, Ferlay J, Siegel RL, Laversanne M, Soerjomataram I, Jemal A, and Bray F.(2021). Global Cancer Statistics 2020: GLOBOCAN Estimates of Incidence and Mortality Worldwide for 36 Cancers in 185 Countries. CA Cancer J Clin 71, 209–249. 10.3322/caac.21660. - DOI - PubMed
    1. Chen Z, Fillmore CM, Hammerman PS, Kim CF, and Wong KK (2014). Non-small-cell lung cancers: a heterogeneous set of diseases. Nat Rev Cancer 14, 535–546. 10.1038/nrc3775. - DOI - PMC - PubMed
    1. Gandara DR, Hammerman PS, Sos ML, Lara PN Jr., and Hirsch FR (2015). Squamous cell lung cancer: from tumor genomics to cancer therapeutics. Clin Cancer Res 21, 2236–2243. 10.1158/1078-0432.CCR-14-3039. - DOI - PMC - PubMed
    1. Yuan M., Huang LL., Chen JH., Wu J., and Xu Q. (2019). The emerging treatment landscape of targeted therapy in non-small-cell lung cancer. Signal Transduct Target Ther 4, 61. 10.1038/s41392-019-0099-9. - DOI - PMC - PubMed
    1. Yang CY, Yang JC, and Yang PC (2020). Precision Management of Advanced Non-Small Cell Lung Cancer. Annu Rev Med 71, 117–136. 10.1146/annurev-med-051718-013524. - DOI - PubMed

Publication types

MeSH terms