. 2023 Jan:67:101655.
doi: 10.1016/j.molmet.2022.101655. Epub 2022 Dec 13.

Epigenetic regulation of IPF fibroblast phenotype by glutaminolysis

Affiliations

Epigenetic regulation of IPF fibroblast phenotype by glutaminolysis

Zheyi Xiang et al. Mol Metab. 2023 Jan.

Abstract

Objective: Excessive extra-cellular-matrix production and uncontrolled proliferation of the fibroblasts are characteristics of many fibrotic diseases, including idiopathic pulmonary fibrosis (IPF). The fibroblasts have enhanced glutaminolysis with up-regulated glutaminase, GLS1, which converts glutamine to glutamate. Here, we investigated the role of glutaminolysis and glutaminolysis-derived metabolite α-ketoglutarate (α-KG) on IPF fibroblast phenotype and gene expression.

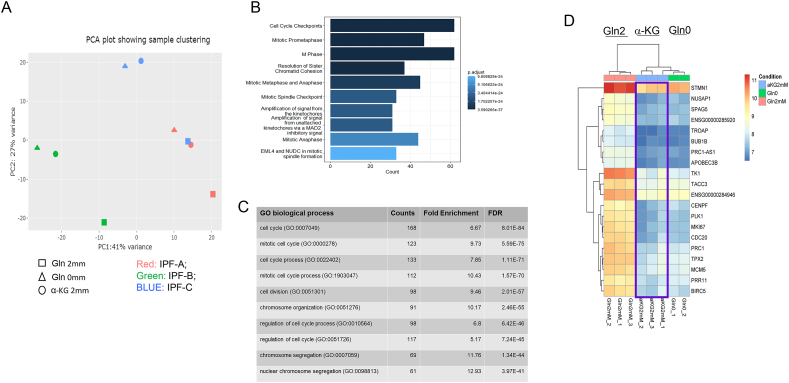
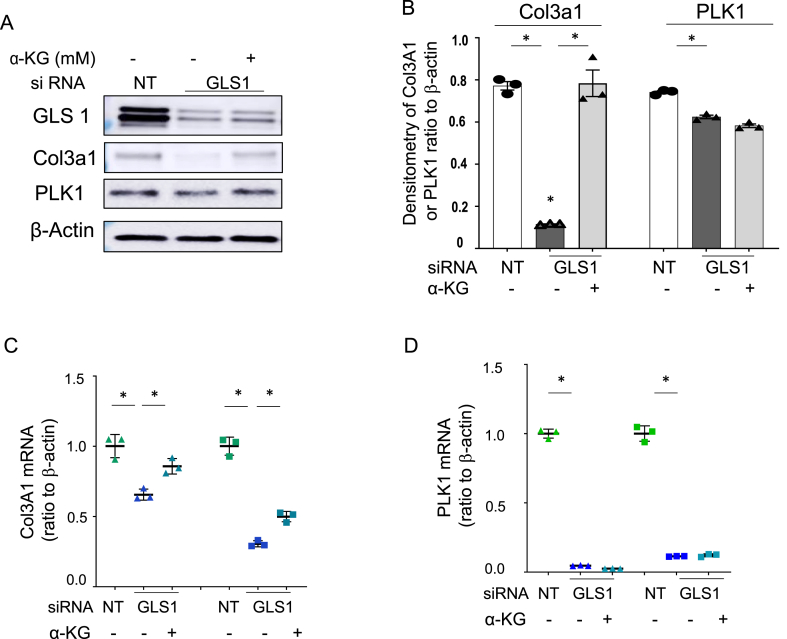
Methods: Reduced glutamine conditions were carried out either using glutamine-free culture medium or silencing the expression of GLS1 with siRNA, with or without α-KG compensation. Cell phenotype has been characterized under these different conditions, and gene expression profile was examined by RNA-Seq. Specific profibrotic genes (Col3A1 and PLK1) expression were examined by real-time PCR and western blots. The levels of repressive histone H3K27me3, which demethylase activity is affected by glutaminolysis, were examined and H3K27me3 association with promoter region of Col3A1 and PLK1 were checked by ChIP assays. Effects of reduced glutaminolysis on fibrosis markers were checked in an animal model of lung fibrosis.

Results: The lack of glutamine in the culture medium alters the profibrotic phenotype of activated fibroblasts. The addition of exogenous and glutaminolysis-derived metabolite α-KG to glutamine-free media barely restores the pro-fibrotic phenotype of activated fibroblasts. Many genes are down-regulated in glutamine-free medium, α-KG supplementation only rescues a limited number of genes. As α-KG is a cofactor for histone demethylases of H3K27me3, the reduced glutaminolysis alters H3K27me3 levels, and enriches H3K27me3 association with Col3A1 and PLK1 promoter region. Adding α-KG in glutamine-free medium depleted H3K27me3 association with Col3A1 promoter region but not that of PLK1. In a murine model of lung fibrosis, mice with reduced glutaminolysis showed markedly reduced fibrotic markers.

Conclusions: This study indicates that glutamine is critical for supporting pro-fibrotic fibroblast phenotype in lung fibrosis, partially through α-KG-dependent and -independent mechanisms, and supports targeting fibroblast metabolism as a therapeutic method for fibrotic diseases.

Keywords: Col3A1; Glutamine; H3K27me3; Lung fibrosis; PLK1; Running head; α-KG.


Figures

Figure 1
Figure 1
Cell proliferation, migration and collagen III deposition in IPF lung fibroblasts cultured in medium containing 2 mM glutamine (control), 0 mM glutamine and 0 mM glutamine plus 2 mM α-KG. The media of cultured cells under control condition, was changed to fresh medium with 2 mM glutamine, 0 mM glutamine, or 0 mM glutamine with 2 mM α-KG when cells reached 80% confluency. A. Cell numbers were counted each day during 3-day period under these different culture conditions to assess cell proliferation (see methods for detailed protocols). Growth curve were plotted as average ± standard error of cell numbers from three different IPF cell lines of each day. The difference was significant on day 3 under each condition (∗p < 0.05). B. Cell migration was examined after scratching the cell monolayer with a sterile pipette tip, the migration of the cells were recorded by imaging at different time points at 4×. The edges of the scratches were marked with dashed lines, which were shown by the distance bar with arbitrary unit under 0, 14, or 24 h after the scratches were created. The histogram of scratch distance under each condition was made with average ± standard error of three cell lines. ∗p < 0.05 at 24 h vs 0 h. C. Representative images of immunofluorescence stain of collagen III in IPF lung fibroblasts under different culture conditions after 48 h. Cell were stained with antibodies against Col3A1 (red), and DAPI (blue). Images were also merged to visualize both stains in one image. Pictures were taken at 20× with a Keyence microscope. Histogram is the average ± standard error of at least three sildes of immunofluorescence intensity of Col3A1 stains measured by ImageJ program. ∗p < 0.05, Gln 0 mM vs Gln 2 mM, or α-KG 2 mM.
Figure 2
Figure 2
RNA-Seq data from three primary IPF lung fibroblasts culture in the presence of 2 mM glutamine, 0 mM glutamine, or 0 mM glutamine plus α-KG 2 mM. RNAs were collected 48 h after treatment and subjected to RNA-Seq. A. PCA plot showing sample clustering. Three different samples are shown by different colors. Lung fibroblasts from IPF patient A (Red), patient B (Green), and patient C (Blue), were cultured with 2 mM glutamine (square), 0 mM glutamine (triangle), or 0 mM glutamine with 2 mM α-KG (circle). Significant variability can be observed between the different samples. Following analysis for the 0 mM glutamine condition only used samples from patients B and C (green and blue triangle), see text for details. B. Pathway enrichment analysis of altered genes under glutamine 0 mM vs 2 mM glutamine. Top 10 most significantly enriched terms are presented in the figure. C. GO term enrichment analysis of altered genes in glutamine 0 mM vs 2 mM. GO term enrichment (Biological Process database) showed that most significant terms are related to cell cycle. GO term analysis returned 168 highly down-regulated genes (fold change >1.5) associated with the term “cell cycle”. Top ranked most significantly enriched terms are presented in the table. D. Heatmap showing the top 20 most differentially expressed genes when compared to 2 mM glutamine (Gln2, q < 0.05). More RNA-Seq analysis are in online supplementary data. The gene expression in response to the addition of α-KG in the glutamine-free medium is shown with purple box.
Figure 3
Figure 3
Expression of Col3A1 and PLK1 in IPF fibroblasts grown in media of different glutamine concentrations. Col3A1 and PLK1 expression in IPF lung fibroblasts in culture medium with 2 mM glutamine (control), 0 mM glutamine, or 0 mM glutamine with 2 mM α-KG for 48 h. A/B: (A) Representative western blotting of Col3A1 expression, with β-actin as loading control. (B) Col3A1/β-actin determined by densitometry under culture conditions described above, n = 3 experimental repeats. (C) Col3A1 mRNA levels expression was assessed by real-time PCR. Triangles, squares, or circles indicate three different patient-derived IPF fibroblast lines. Expressed values represent mean ± SD; n = 3 experimental replicates for each cell line. D/E: (D) Representative western blotting of PLK1 expression with β-actin as loading control. (E) PLK1 ratio to β-actin determined by densitometry under the same culture conditions as in D with n = 3 experimental repeats. F: PLK1 mRNA levels expression were determined by real-time PCR. Triangles, squares, or circles indicate three different patient-derived IPF cell lines. Expressed values represent mean ± SD; n = 3 experimental replicates of each cell line. ∗p < 0.05, Glutamine 0 mM (Gln 0) vs Gln 2 mM or Gln0 plus α-KG as indicated. Additional cell lines response under the same condition by western blots are shown in online data Figure 2SA.
Figure 4
Figure 4
Expression of Col3A1 and PLK1 in IPF fibroblasts transfected with non-targeting (NT) or GLS1 siRNA. IPF cells are transfected with NT or GLS1 siRNA in the presence of 2 mM glutamine. GLS1-silenced cells were cultured in presence of glutamine 2 mM with or without adding α-KG 2 mM. The cells were collected 48 h after transfection for western blots or real-time PCR. A/B: (A) Representative western-blotting to examine the protein levels for GLS1, Col3A1 and PLK1. (B) Densitometry analysis of Col3A1 and PLK1 associated signals: ration of Col3A1 and PLK1 to β-actin, as shown in A, n = 3 experimental replicates. ∗p < 0.05, GLS1 siRNA compared to NT siRNA, or GLS1 siRNA with 2 mM Gln plus α-KG. C/D: RNA expression of Col3A1 (C) or PLK1 (D) in two IPF fibroblast cell lines transfected with NT or GLS1 siRNA cultured in the presence of 2 mM glutamine with or without added α-KG as in A. Triangles or squares represent two different IPF patient-derived primary cells. Expressed values represent mean ± SD, 3 experimental replicates of each cell line. ∗p < 0.05, siRNA GLS1 vs NT, or vs siRNA GLS1 with 2 mM glutamine plus α-KG.
Figure 5
Figure 5
Histone H3K27me3 in IPF fibroblasts and its association with Col3A1 or PLK1 promoter region. IPF lung fibroblasts were kept in control medium (with 2 mM glutamine), when the cells were at 70% confluency, medium was changed to fresh medium with glutamine 2 mM, 0 mM, or 0 mM with α-KG (2 mM) for 48 h. A. Representative western blots of H3K27me3 overall baseline levels in two different IPF primary cell lines under the culture conditions described above, H3 is the loading control. Additional IPF cell lines responsed by WB are in online data Figure 2SB. B. Densitometry analysis of H3K27me3 signals with ratio to H3 as shown in A, n = 3 experimental repeats. The results are expressed as mean ± SD from three independent experiments from these two IPF cell lines. ∗p < 0.05, compared with glutamine 2 mM or with added 2 mM α-KG. C. Representative merged images of immunofluorescence of IPF fibroblasts stained with antibodies against H3K27me3 (green) and DAPI (blue). Note, the number of cells seeded in the control medium was half compared to the number of cells seeded for the glutamine-free and glutamine 0 mM plus 2 mM α-KG conditions to avoid overcrowding of cells. The images were taken with a Keynence microscope, at 20× magnification. Additional images with DAPI or H3K27me3 alone are in online supplementary data (Figure 3S). Right panel: densitometry of immunoflurescencent stain of green (H3K27me3) ratio to blue (DAPI). ∗p < 0.05, Gln 0 vs Gln 2 or α-KG. D and E. The IPF fibroblasts were collected after 48 h of each experimental condition. The association of H3K27me3 with Col3A1 (D) or PLK1 (E) was analyzed by ChIP assays. DNA was immunoprecipitated with specific antibody against H3K27me3. Primers for PCR are listed in Table 2S. Negative control represents IgG pull-down. qPCR data were analyzed by using the 2-ΔΔCt method, and results were normalized to input DNA, expressed as fold changes relative to control samples (cells culture under glutamine 2 mM). The values are expressed as mean ± SD from average of three independent experiments of one representative cell line. ∗p < 0.05, compared to glutamine 2 mM (Gln2), #p < 0.05, compared to glutamine-free (Gln0).
Figure 6
Figure 6
Reduced fibrotic markers in the lungs of bleomycin-injured GLS1+/− heterozygous mice. A. Schematic timeline of animal studies. 8-week old WT or GLS1+/− heterozygous mice were subjected to saline or bleomycin injury. All mice were sacrificed 28 days after injury, samples were collected for assays. B. H&E stain of WT or GLS1+/− hets mice lungs subjected to saline or bleomycin. C. Semiquantitative Ashcroft score of lung sections with WT or GLS1+/− heterozygous mice subjected to saline or bleomycin on day 28 after injury. ∗p < 0.05, WT saline vs Bleo, or WT vs Hets of bleomycin injured mice (n = 3). D. Mice lung tissues were collected and the expression of GLS1, Col3A1, and PLK1 were examined by western blots for each of the following group: WT saline (n = 4), WT with bleomycin injury (n = 5), and Hets with bleomycin injury (n = 6). β-actin is the loading control. E-G. Densitometry of GLS1 (E), Col3A1 (F), and PLK1 (G) relative to β-actin (mean with standard error) as shown on the western blots in D. ∗p < 0.05, by t-test (WT saline vs bleo) or Kolmogorov–Smirnov test (WT bleo vs Hets bleo). H. Schematic diagram of possible mechanisms of the findings from this study. Glutamine control cell phenotype through an α-KG dependent and independent mechanisms to regulate gene expression.

References

    1. Smith R.J. Glutamine metabolism and its physiologic importance. JPEN J Parenter Enteral Nutr. 1990;14(4 Suppl):40S–44S. - PubMed
    1. Watford M. Glutamine and glutamate: nonessential or essential amino acids? Animal Nutr. 2015;1(3):119–122. - PMC - PubMed
    1. Neu J, Demarco V, Freeman B, McCain M, Strauss D. Is glutamine a conditionally essential amino acid during pregnancy?177. Pediatr Res. 1996;40:544.
    1. Jackson NC, Carroll PV, Russell-Jones DL, Sonksen PH, Treacher DF, Umpleby AM. The metabolic consequences of critical illness: acute effects on glutamine and protein metabolism. Am J Physiol. 1999;276(1 Pt 1):E163–E170. - PubMed
    1. Wong C.C., Qian Y., Yu J. Interplay between epigenetics and metabolism in oncogenesis: mechanisms and therapeutic approaches. Oncogene. 2017;36(24):3359–3374. - PMC - PubMed

Publication types