. 2022 Dec 16;13(1):7787.
doi: 10.1038/s41467-022-35430-y.

Detecting and quantifying liquid-liquid phase separation in living cells by model-free calibrated half-bleaching

Affiliations

Detecting and quantifying liquid-liquid phase separation in living cells by model-free calibrated half-bleaching

Fernando Muzzopappa et al. Nat Commun. .

Abstract

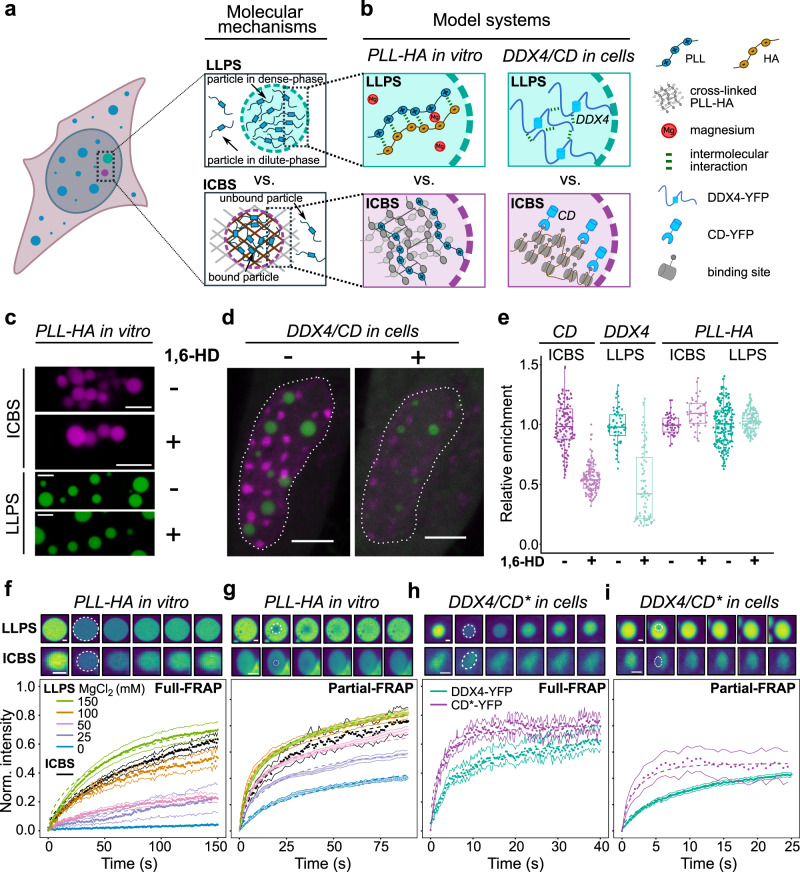
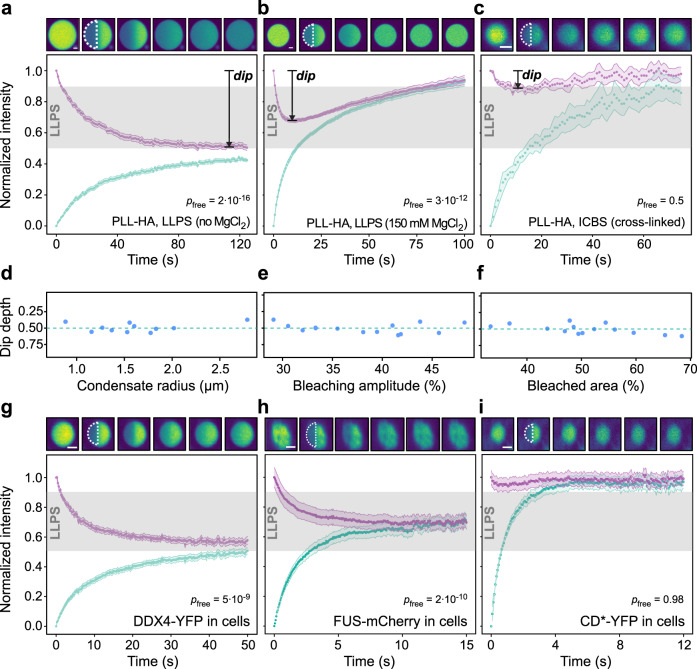
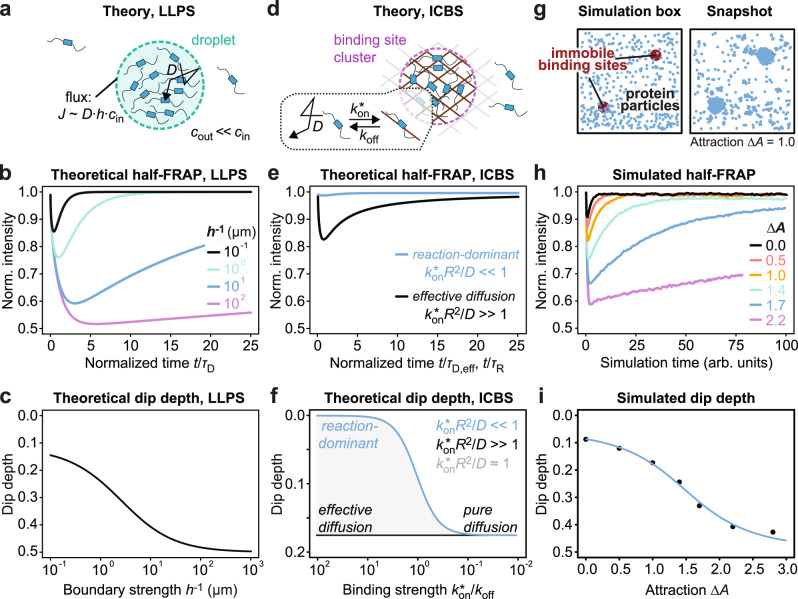
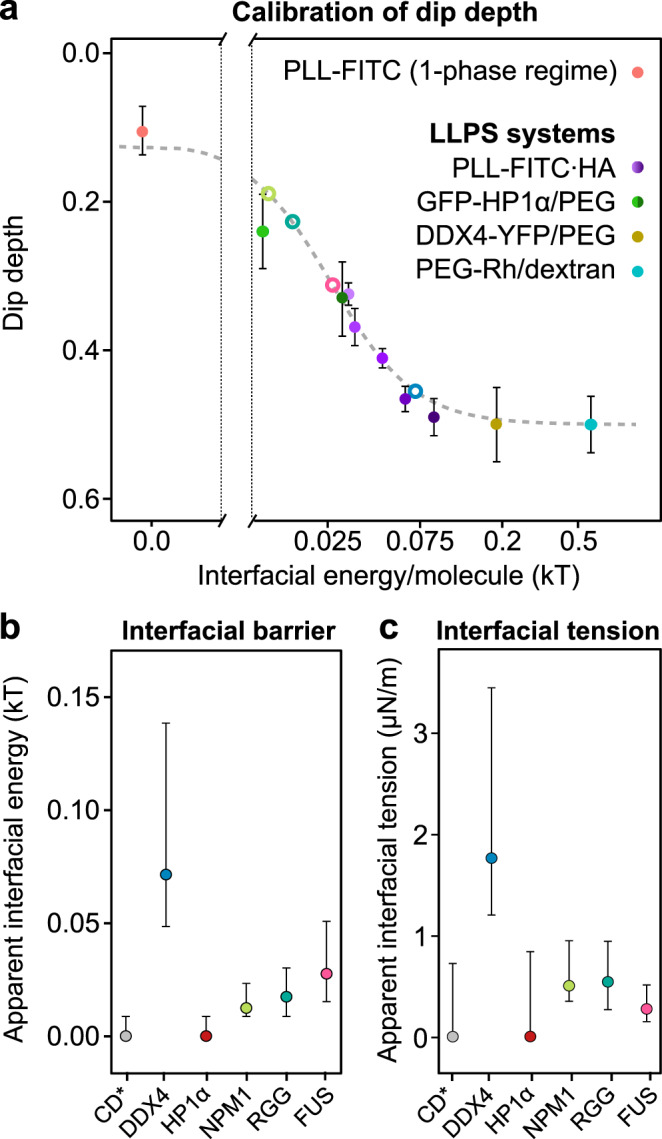
Cells contain numerous substructures that have been proposed to form via liquid-liquid phase separation (LLPS). It is currently debated how to reliably distinguish LLPS from other mechanisms. Here, we benchmark different methods using well-controlled model systems in vitro and in living cells. We find that 1,6-hexanediol treatment and classical FRAP fail to distinguish LLPS from the alternative scenario of molecules binding to spatially clustered binding sites without phase-separating. In contrast, the preferential internal mixing seen in half-bleach experiments robustly distinguishes both mechanisms. We introduce a workflow termed model-free calibrated half-FRAP (MOCHA-FRAP) to probe the barrier at the condensate interface that is responsible for preferential internal mixing. We use it to study components of heterochromatin foci, nucleoli, stress granules and nuage granules, and show that the strength of the interfacial barrier increases in this order. We anticipate that MOCHA-FRAP will help uncover the mechanistic basis of biomolecular condensates in living cells.


Conflict of interest statement

The authors declare no competing interests.

Figures

Fig. 1
Fig. 1. Benchmarking 1,6-hexanediol treatment and classical FRAP using well-defined model systems.
a Schematic representation of membrane-less structures formed by LLPS (top) or ICBS (bottom). b Schematic representation of the model systems used in this work: PLL-HA coacervates undergoing LLPS in vitro (top, left), PLL undergoing ICBS in vitro (bottom, left), DDX4-YFP undergoing LLPS in living cells (top, right) and the chromodomain of CBX1/HP1β undergoing ICBS at pericentric heterochromatin enriched for H3K9me2/3 (bottom, right). c, Microscopy images of PLL-HA coacervates (green) and PLL undergoing ICBS (magenta) in the absence or presence of 1,6-hexanediol. Scale bars, 5 µm. d Microscopy images of a living cell expressing DDX4-YFP and CD-mKate, in the absence or presence of 1,6-hexanediol. Scale bars, 5 µm. e Quantification of PLL-FITC, DDX4-YFP and CD-mKate enrichment at structures of interest. Error bars represent the standard deviation. f Full-FRAP experiments of PLL-HA coacervates undergoing LLPS, in the absence or presence of different amounts of magnesium chloride (colored curves), and PLL undergoing ICBS (black curve). Top panels show representative snapshots before the bleach and 0, 5, 15, 50 and 75 s after the bleach. The snapshots for LLPS correspond to PLL-HA with 150 mM MgCl2. Scale bars, 2 µm. g Same as panel f but for partial-FRAP. h Same as panel f but for DDX4-YFP (cyan curve) and CD*-YFP (magenta curve) in living cells. i Same as panel h but for partial-FRAP. Error bars in panels fi represent the standard error of the mean. Source data are provided as a Source Data file.
Fig. 2
Fig. 2. Half-FRAP differentiates condensates formed by LLPS from clusters formed by ICBS.
ac Half-FRAP curves, including the normalized intensity in the bleached half (cyan) and the non-bleached half (magenta). Gray areas in the plots indicate the range of dip depths in the non-bleached half that correspond to LLPS. Half-FRAP curves for PLL-HA coacervates without magnesium chloride (a), PLL-HA coacervates with 150 mM magnesium chloride (b) and PLL undergoing ICBS (c) are shown. Top panels show representative snapshots before the bleach and 0, 5 15, 50, and 75 s after the bleach. p-values based on a one-sided Student’s t-test against the dip depths obtained for free diffusion are indicated. d Dip depths measured for half-bleached PLL-HA coacervates of different sizes. e Dip depths measured for PLL-HA coacervates that were half-bleached with different laser powers. f Dip depths measured for PLL-HA coacervates after bleaching different area fractions of them. Half-FRAP in living cells expressing DDX4-YFP (g), FUS-mCherry (h) or CD*-YFP (i). Top panels show representative snapshots before the bleach and 0, 5, 15, 50, and 75 s after the bleach. Scale bars, 2 µm. Error bands in ac and gi represent the standard error of the mean. p-values based on a one-sided Student’s t-test against the dip depths obtained for free diffusion are indicated in a-c and g-i. Source data are provided as a Source Data file.
Fig. 3
Fig. 3. Theoretical and simulated half-FRAP curves relate the dip depth to the underlying molecular properties.
a Model describing the LLPS scenario. The condensate interface was modeled as a boundary that attenuates the diffusive flux. b Theoretically predicted half-FRAP curves in the non-bleached half for the LLPS model. The curves are plotted versus time divided by the characteristic diffusion time τD = R2/4D, showing that the dip depth is independent of the diffusion coefficient D and condensate radius R. c Relationship between dip depth and boundary strength h−1 in the LLPS model. d Model describing the ICBS scenario. The binding reaction was modeled as a pseudo first-order reaction with rates kon* and koff, where each particle could interact with only one binding site at a time. e Theoretically predicted half-FRAP curves in the non-bleached half for the ICBS model. For fast binding (kon*R2/D » 1), the model converges to a pure diffusion model with an effective diffusion coefficient Deff = D/(1+kon*/koff). For strong and slow binding (kon*R2/D « 1), it converges to a reaction-dominant model in which the recovery is governed by the dissociation rate. The respective curves are plotted versus time divided by τD,eff = R2/4Deff (black curve) and τR = 1/koff (blue curve), showing that the dip depth is independent of the effective diffusion coefficient and the dissociation rate, respectively. f Relationship between dip depth and binding strength kon*/koff in the ICBS model. g Schematic representation of the simulation setup including two clusters of immobile binding sites (red), mobile protein particles (blue) and solvent particles (not depicted). A representative snapshot showing the protein distribution after the number of proteins at each binding site cluster had reached a plateau is shown to the right. h Simulated half-FRAP curves in the non-bleached half for proteins with different intermolecular interaction strength ∆A. For ∆A < 1, the simulation corresponds to ICBS; for ∆A ≥ 1, the simulation corresponds to LLPS, with the system moving deeper into the 2-phase regime with increasing ∆A. The number of interaction partners was not restricted. i, Relationship between dip depth and intermolecular interaction strength ∆A.
Fig. 4
Fig. 4. MOCHA-FRAP quantifies interfacial barriers based on the dip depth.
a Relationship between dip depth and interfacial energy per molecule for PLL-HA undergoing LLPS (violet; magnesium chloride concentrations increase from dark to light color), GFP-HP1α/PEG (dark green: without ssDNA; light green: with ssDNA), DDX4-YFP/PEG (gold) and PEG-Rhodamine/dextran (cyan) measured in vitro. As a reference, free PLL in the 1-phase regime is shown (red). The error bars represent the standard error of the mean. Open circles represent dip depths obtained in live-cell experiments, following the same color code as in the panels below. Apparent interfacial energy per molecule, which serves as a proxy for the interfacial barrier (b), and apparent interfacial tension (c) calculated from the dip depth of CD*-YFP, DDX4-YFP, GFP-HP1α, NPM1-GFP, RGG-GFP-RGG and FUS-mCherry in living cells, using the calibration curve in panel a. Error bars represent the standard error of the mean. Source data are provided as a Source Data file.

References

    1. Banani SF, Lee HO, Hyman AA, Rosen MK. Biomolecular condensates: organizers of cellular biochemistry. Nat. Rev. Mol. Cell Biol. 2017;18:285–298. doi: 10.1038/nrm.2017.7. - DOI - PMC - PubMed
    1. McSwiggen DT, Mir M, Darzacq X, Tjian R. Evaluating phase separation in live cells: diagnosis, caveats, and functional consequences. Genes Dev. 2019;33:1619–1634. doi: 10.1101/gad.331520.119. - DOI - PMC - PubMed
    1. Erdel F, Rippe K. Formation of chromatin subcompartments by phase separation. Biophys. J. 2018;114:2262–2270. doi: 10.1016/j.bpj.2018.03.011. - DOI - PMC - PubMed
    1. Erdel F, et al. Mouse heterochromatin adopts digital compaction states without showing hallmarks of HP1-driven liquid-liquid phase separation. Mol. Cell. 2020;78:236–249.e7. doi: 10.1016/j.molcel.2020.02.005. - DOI - PMC - PubMed
    1. McSwiggen, D. T. et al. Evidence for DNA-mediated nuclear compartmentalization distinct from phase separation. Elife8, e47098 (2019). - PMC - PubMed

Publication types

MeSH terms

Substances