. 2022 Dec 16;8(1):172.
doi: 10.1038/s41531-022-00439-z.

Identification and prediction of Parkinson's disease subtypes and progression using machine learning in two cohorts

Affiliations

Identification and prediction of Parkinson's disease subtypes and progression using machine learning in two cohorts

Anant Dadu et al. NPJ Parkinsons Dis. .

Abstract

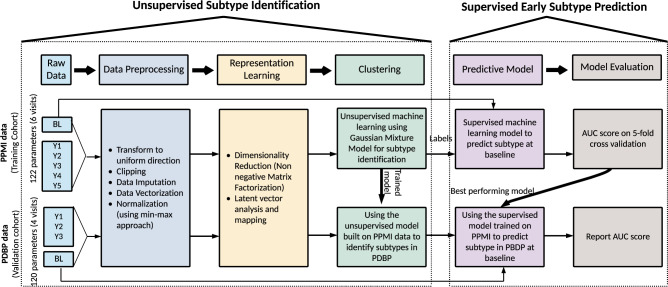
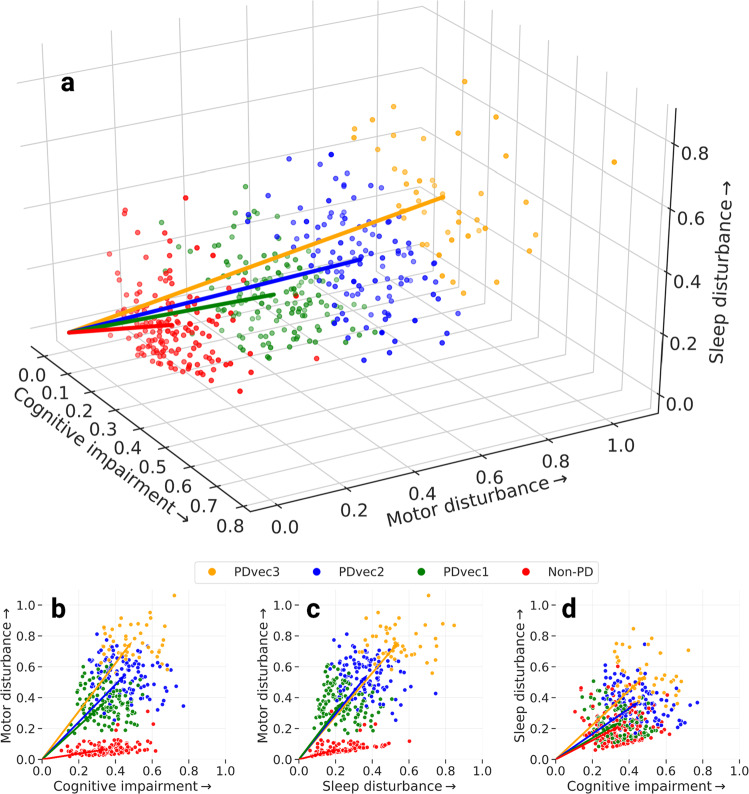
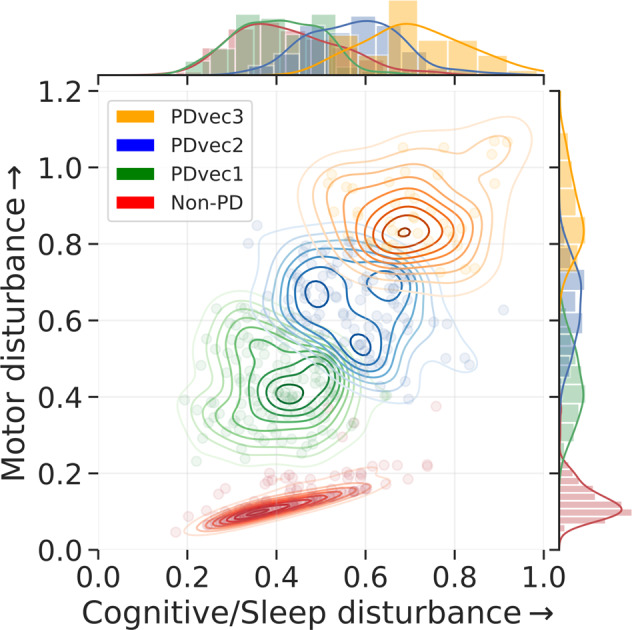
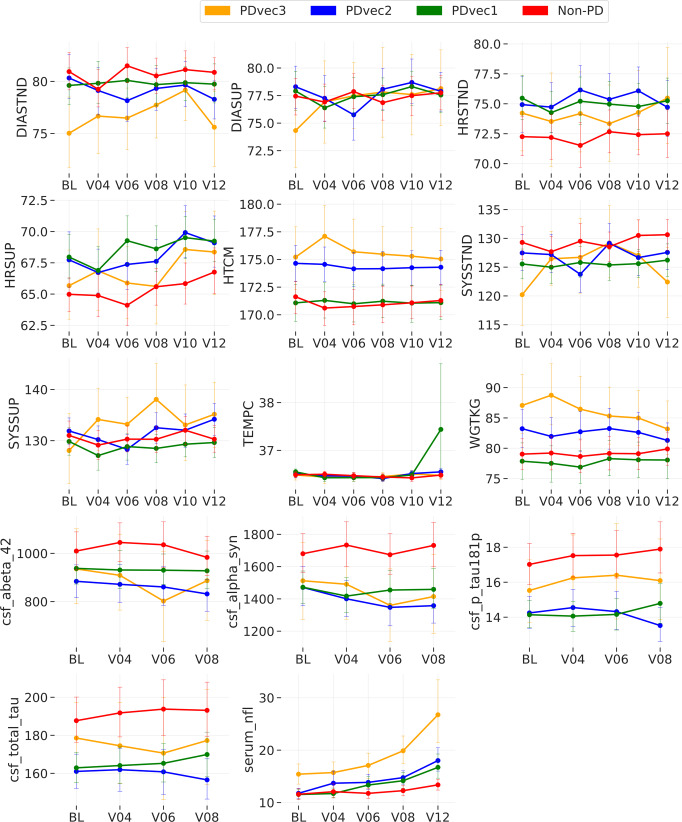
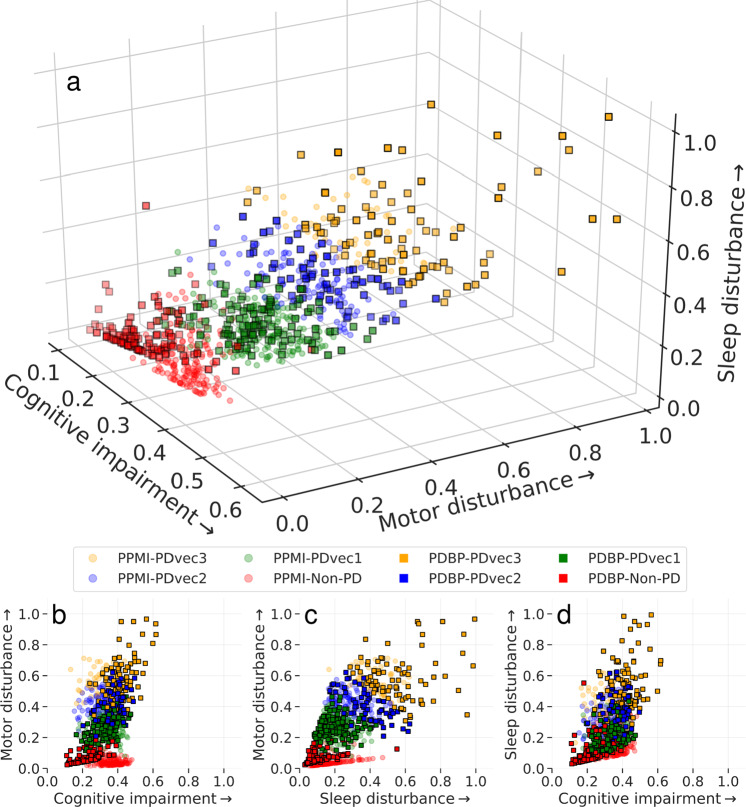
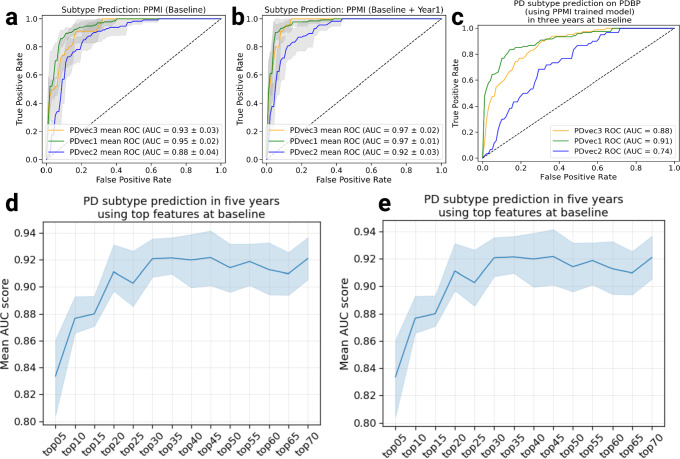
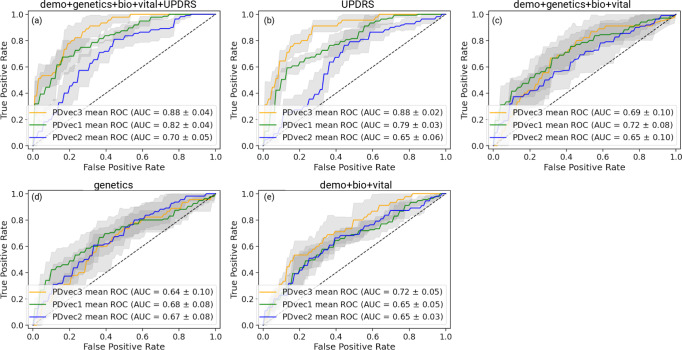
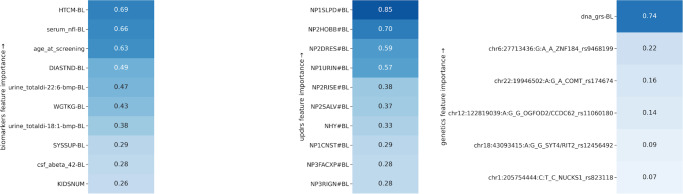
The clinical manifestations of Parkinson's disease (PD) are characterized by heterogeneity in age at onset, disease duration, rate of progression, and the constellation of motor versus non-motor features. There is an unmet need for the characterization of distinct disease subtypes as well as improved, individualized predictions of the disease course. We used unsupervised and supervised machine learning methods on comprehensive, longitudinal clinical data from the Parkinson's Disease Progression Marker Initiative (n = 294 cases) to identify patient subtypes and to predict disease progression. The resulting models were validated in an independent, clinically well-characterized cohort from the Parkinson's Disease Biomarker Program (n = 263 cases). Our analysis distinguished three distinct disease subtypes with highly predictable progression rates, corresponding to slow, moderate, and fast disease progression. We achieved highly accurate projections of disease progression 5 years after initial diagnosis with an average area under the curve (AUC) of 0.92 (95% CI: 0.95 ± 0.01) for the slower progressing group (PDvec1), 0.87 ± 0.03 for moderate progressors, and 0.95 ± 0.02 for the fast-progressing group (PDvec3). We identified serum neurofilament light as a significant indicator of fast disease progression among other key biomarkers of interest. We replicated these findings in an independent cohort, released the analytical code, and developed models in an open science manner. Our data-driven study provides insights to deconstruct PD heterogeneity. This approach could have immediate implications for clinical trials by improving the detection of significant clinical outcomes. We anticipate that machine learning models will improve patient counseling, clinical trial design, and ultimately individualized patient care.


Conflict of interest statement

A.D., H.L., H.I., M.A.N., and F.F.‘s declare no competing non-financial interests but the following competing financial interests as their participation in this project was part of a competitive contract awarded to Data Tecnica International LLC by the National Institutes of Health to support open science research. M.A.N. also currently serves on the scientific advisory board for Character Bio and is an advisor to Neuron23 Inc. The study’s funders had no role in the study design, data collection, data analysis, data interpretation, or writing of the report. Authors V.S., R.K., S.H.H., M.B.M, K.J.B, S.B.C., L.J.S., A.J.N., Ali D., C.B., K.M., S.W.S., A.B.S., and R.H.C. declare no competing financial or non-financial interests. All authors and the public can access all data and statistical programming code used in this project for the analyses and results generation. F.F. takes final responsibility for the decision to submit the paper for publication.

Figures

Fig. 1
Fig. 1. Workflow of analysis and model development.
PPMI Parkinson’s Progression Marker Initiative, PDBP Parkinson’s Disease Biomarkers Program, BL Baseline, Y1 Year1, Y2 Year2, Y3 Year3, Y4 Year4, Y5 Year5, AUC Area under receiver operating characteristic curve.
Fig. 2
Fig. 2. Different views of the Parkinson’s disease progression space in 5 years with three corresponding projected dimensions (cognitive, motor, and sleep dimensions) on a normalized scale.
Subtypes of PD are identified using unsupervised learning (PDvec1, PDvec2, and PDvec3). a Shows the view of all three dimensions, b view of the motor and cognitive dimensions, c view of motor and sleep dimensions, and d view of sleep and motor dimensions.
Fig. 3
Fig. 3. PD five-year progression space.
Visualization of unsupervised learning via GMM on two-dimensional progression space and identification of three Gaussian distributions representing three distinct PD subtypes. An increase in value along either direction reflects the increase in the disturbance on a normalized scale.
Fig. 4
Fig. 4. Shows the biological biomarker variation of each PD subtype over time.
The graphs demonstrate the actual clinical values of each subtype overtime for vital signs (DIASTND standing diastolic blood pressure (BP), DIASUP supine diastolic BP, HRSTND standing heart rate, HRSUP supine heart rate, SYSSTND standing systolic BP, SYSSUP supine systolic BP, HTCM height in cm, TEMPC: temperature in C, WGTKG weight in kg), cerebrospinal fluid (abeta_42 β-amyloid 1–42, alpha_syn alpha-synuclein, p_tau181p phospho-tau181, total_tau total tau protein), and serum neurofilament light levels (serum_nfl). BL: Baseline. V04 visit number 4 after 12 months. V06: visit number 6 after 24 months. V08 visit number 8 after 36 months. V10 visit number 10 after 48 months. V12 visit number 12 after 60 months. In all panels, data is presented as mean ± s.e.m.
Fig. 5
Fig. 5. Shows the identified subtypes in the independent PDBP cohort using the model developed on the PPMI dataset.
Similar PDBP and PPMI subtypes in terms of progression. a Shows the view of all three dimensions, b view of the motor and cognitive dimensions, c view of motor and sleep dimensions, and d view of sleep and cognitive dimensions. The normalized progression space is shown through the 36 months follow up from baseline for both PPMI and PDBP datasets.
Fig. 6
Fig. 6. Shows the performance of Parkinson’s disease progression prediction models.
a The ROC (receiver operating characteristic) for the predictive model at baseline developed on the PPMI cohort evaluated using five-fold cross-validation. b The ROC for the predictive model developed on the baseline, and first-year data of the PPMI cohort evaluated using five-fold cross-validation. c The ROC for the predictive model developed on the PPMI baseline and tested on the PDBP cohort. d Performance of predictive models using data starting from baseline, only using baseline data, and years after, as more data becomes available and combined with the baseline. The y-axis shows the average AUC score across PD subtypes in the PPMI dataset. e Contribution of important features to achieve high accuracy. By including only 20 features, we can achieve an AUC of greater than 0.90. In all panels, data is presented as mean ± s.e.m.
Fig. 7
Fig. 7. Shows the performance of Parkinson’s disease progression prediction models using biomarkers and genetic measurements for the PPMI cohort.
All models are evaluated using five-fold cross-validation. From top left to bottom right: a The ROC for the predictive model using a combination of demographics (education, year, sex, race), biospecimen (cerebrospinal fluid, serum Nfl levels), genetics (hg genotype), vital signs (weight, height, blood pressure) and UPDRS measurements. b The ROC for the predictive model developed on UPDRS scores. c The ROC for the predictive model developed using demographics, genetics, vital signs, and biospecimen measurements. d The ROC for the predictive model developed on genetic measurements e The ROC for the predictive model uses only demographics, vital signs, and biospecimen measurements. In all panels, data is presented as mean ± s.e.m.
Fig. 8
Fig. 8. Heatmap plot showing significant contributing clinical parameters (refer to Supplementary Table 6 for feature description) based on demographics, vital signs, baseline biospecimen, baseline MDS-UPDRS scores, and genetic measurements.
The importance score of each feature is relative. BL baseline, HTCM height in cm, serum_nfl serum neurofilament light levels, age_at_screeing Age at screening, DIASTND standing diastolic blood pressure (BP), urine_totaldi urine levels of di-22:6-bis (monoacylglycerol) phosphate, WGTKG weight in kg, SYSSUP supine systolic BP, csf_abeta_42 cerebrospinal fluid β-amyloid 1–42, KIDSNUM number of kids, dna_grs genetic risk score.

References

    1. Hughes AJ, Daniel SE, Kilford L, Lees AJ. Accuracy of clinical diagnosis of idiopathic Parkinson’s disease: a clinico-pathological study of 100 cases. J. Neurol. Neurosurg. Psychiatry. 1992;55:181–184. doi: 10.1136/jnnp.55.3.181. - DOI - PMC - PubMed
    1. Postuma RB, et al. MDS clinical diagnostic criteria for Parkinson’s disease. Mov. Disord. 2015;30:1591–1601. doi: 10.1002/mds.26424. - DOI - PubMed
    1. Stebbins GT, et al. How to identify tremor dominant and postural instability/gait difficulty groups with the movement disorder society unified Parkinson’s disease rating scale: comparison with the unified Parkinson’s disease rating scale. Mov. Disord. 2013;28:668–670. doi: 10.1002/mds.25383. - DOI - PubMed
    1. Jankovic J, et al. Variable expression of Parkinson’s disease: a base‐line analysis of the DAT ATOP cohort. Neurology. 1990;40:1529–1529. doi: 10.1212/WNL.40.10.1529. - DOI - PubMed
    1. Zetusky WJ, Jankovic J, Pirozzolo FJ. The heterogeneity of Parkinson’s disease: clinical and prognostic implications. Neurology. 1985;35:522–526. doi: 10.1212/WNL.35.4.522. - DOI - PubMed