. 2022 Dec;28(12):2592-2600.
doi: 10.1038/s41591-022-02095-5. Epub 2022 Dec 16.

IL7 genetic variation and toxicity to immune checkpoint blockade in patients with melanoma

Affiliations

IL7 genetic variation and toxicity to immune checkpoint blockade in patients with melanoma

Chelsea A Taylor et al. Nat Med. 2022 Dec.

Abstract

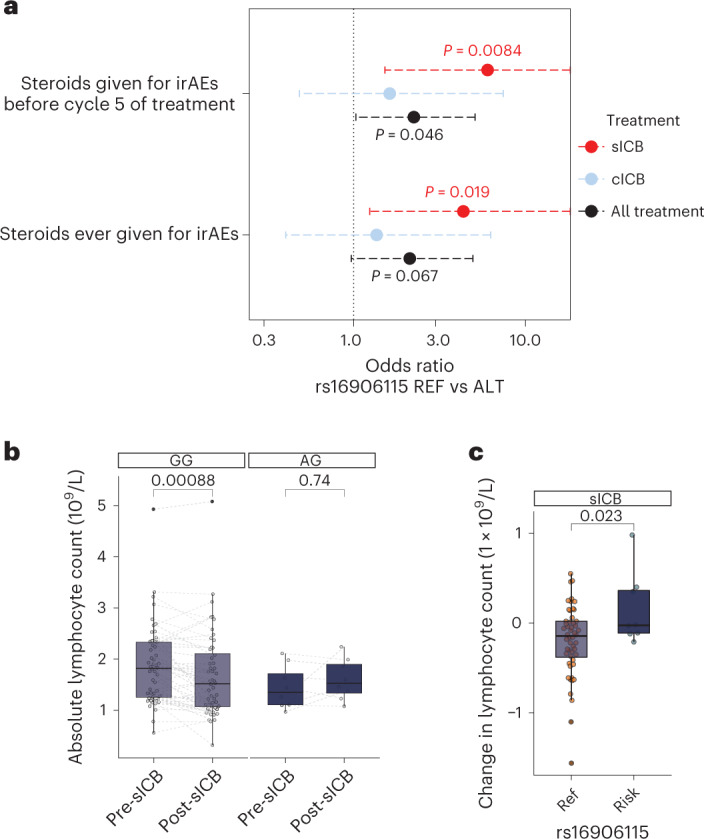
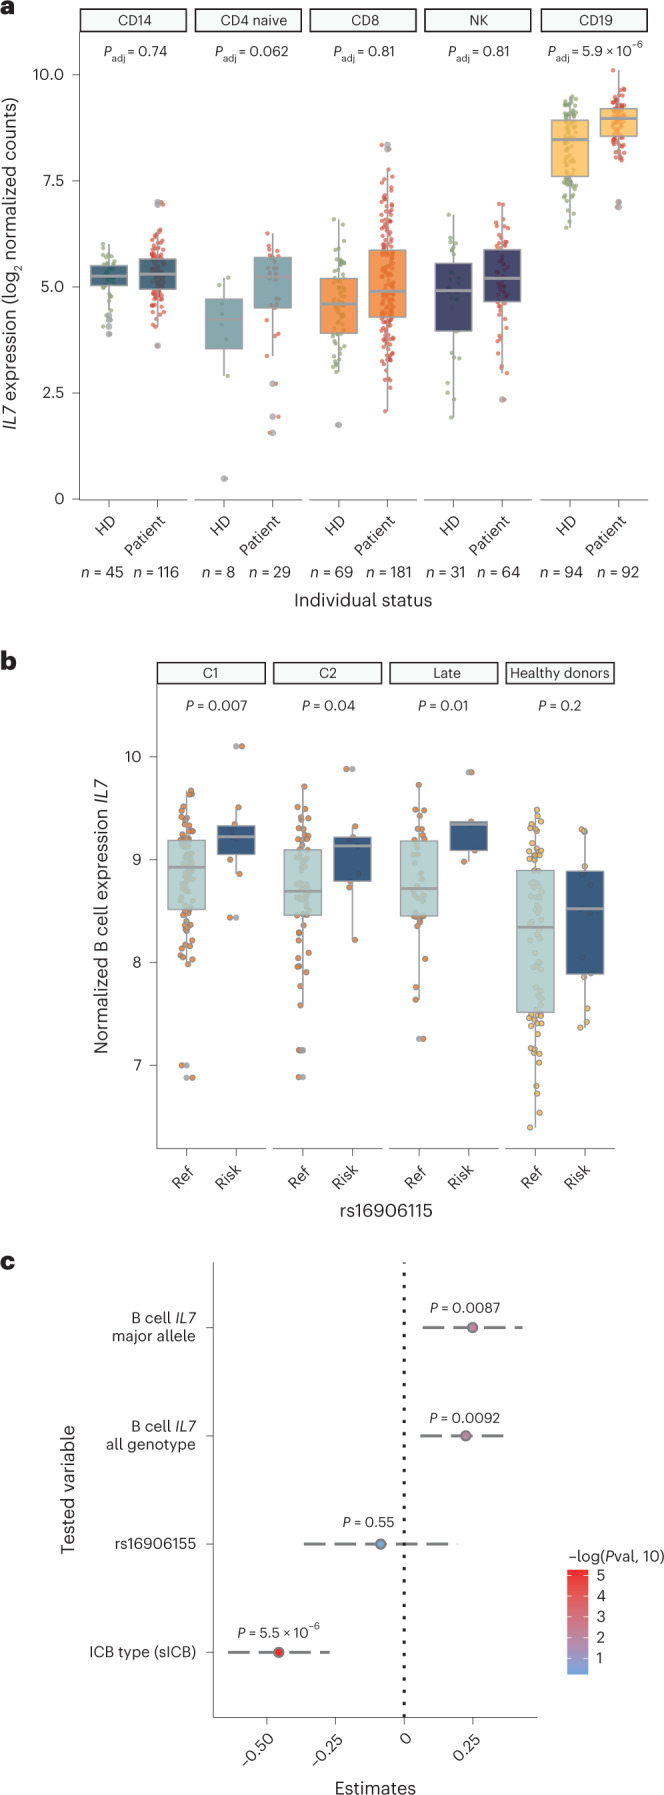
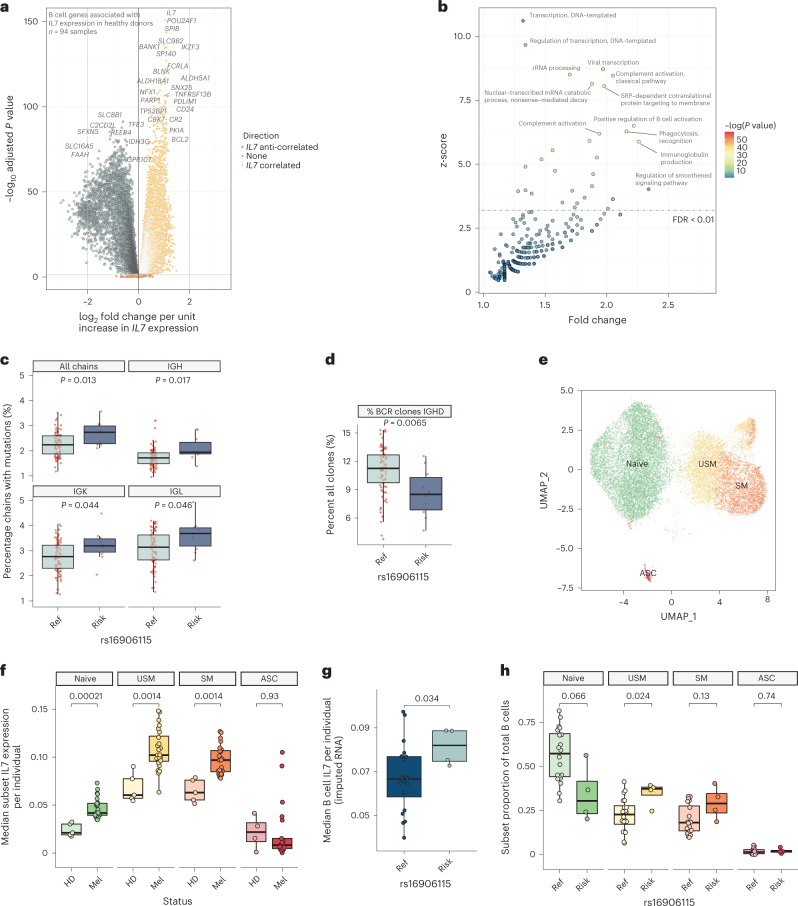
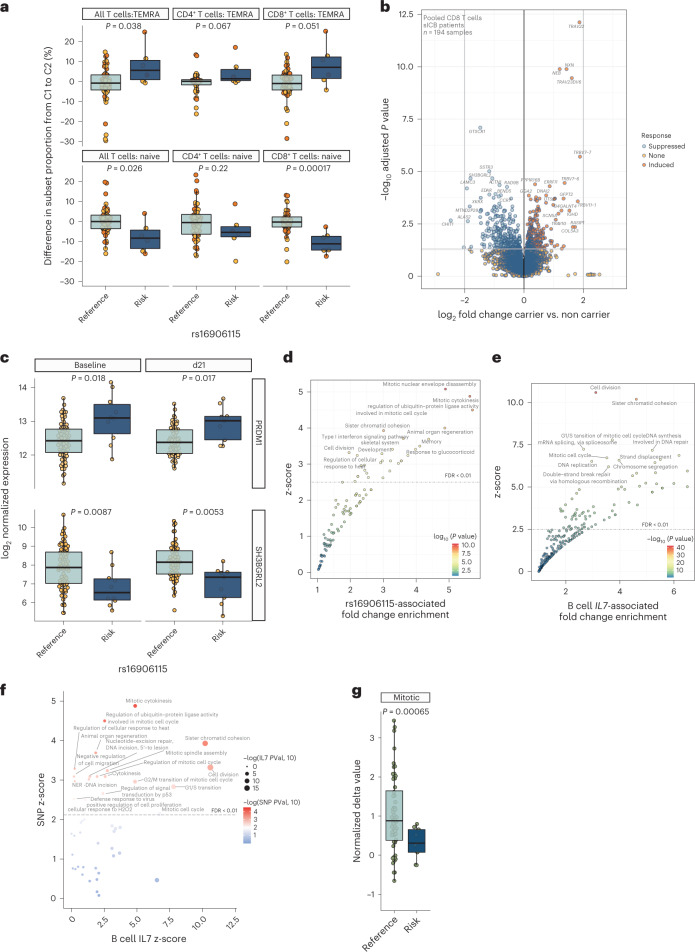
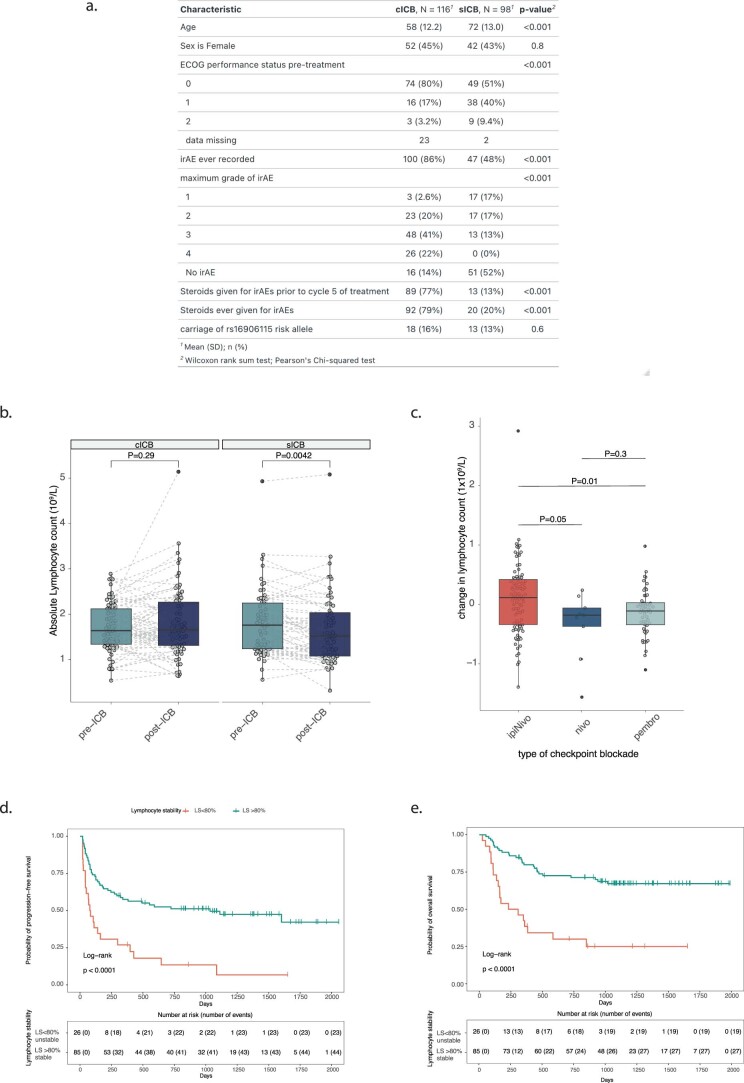
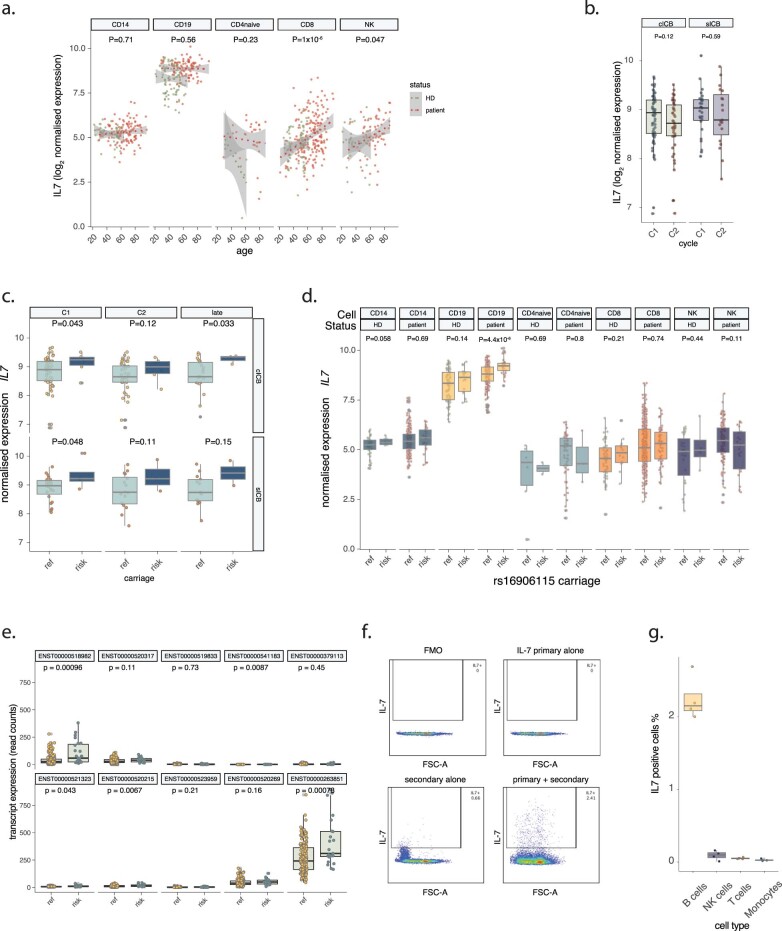
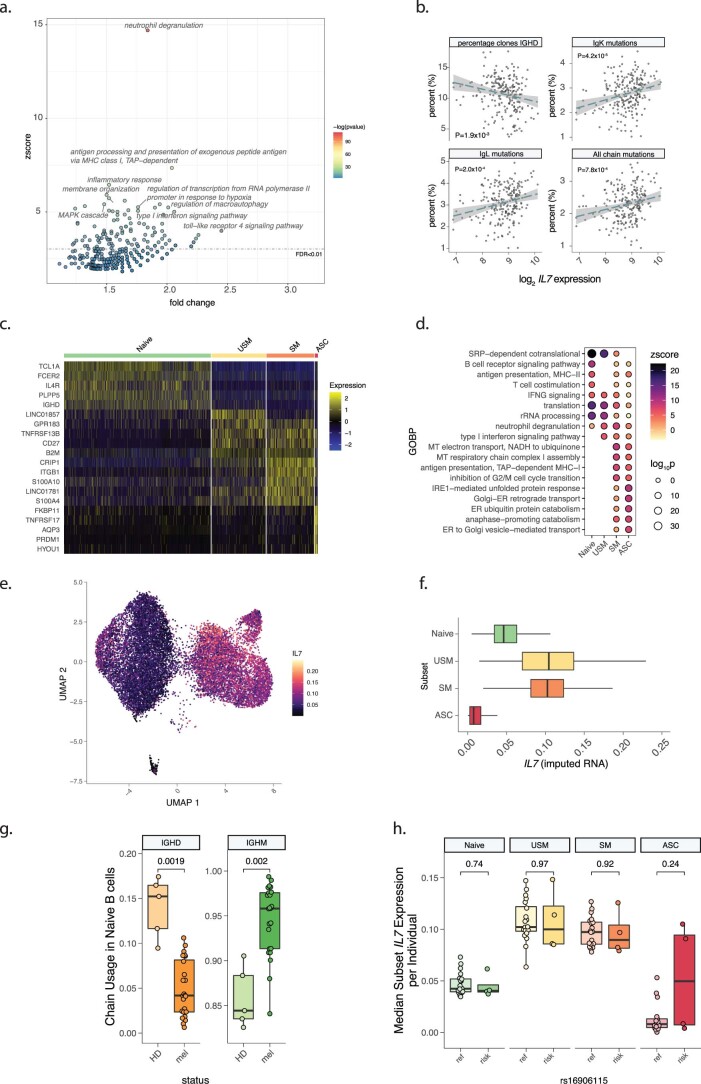
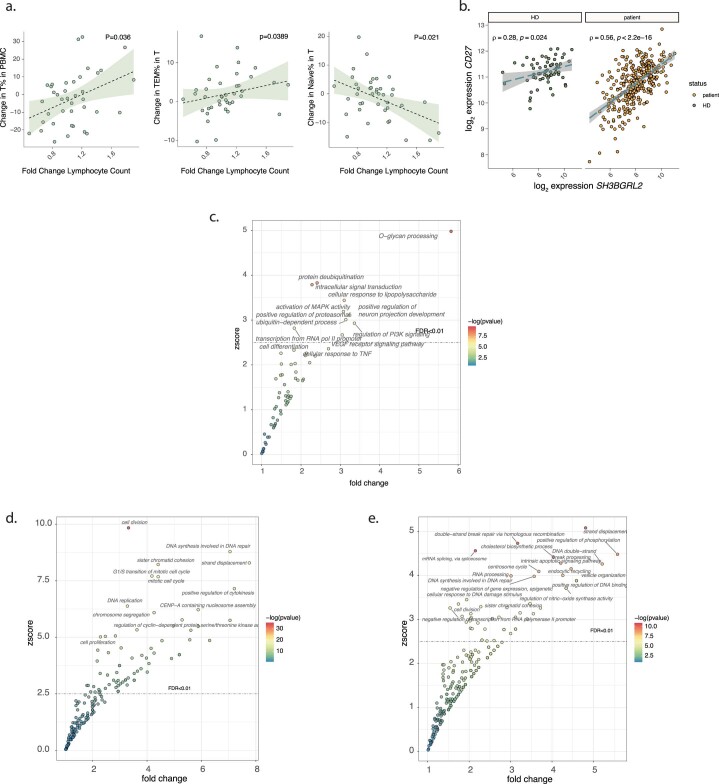
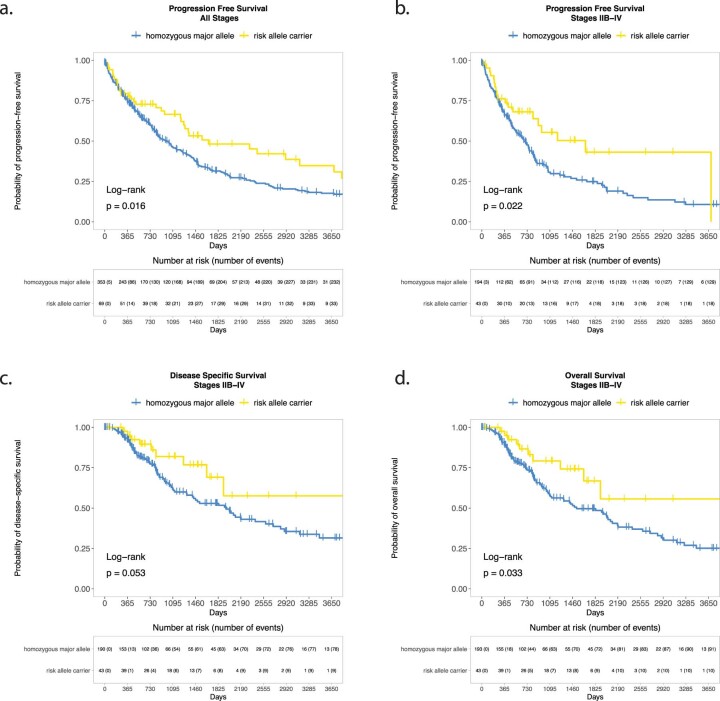
Treatment with immune checkpoint blockade (ICB) frequently triggers immune-related adverse events (irAEs), causing considerable morbidity. In 214 patients receiving ICB for melanoma, we observed increased severe irAE risk in minor allele carriers of rs16906115, intronic to IL7. We found that rs16906115 forms a B cell-specific expression quantitative trait locus (eQTL) to IL7 in patients. Patients carrying the risk allele demonstrate increased pre-treatment B cell IL7 expression, which independently associates with irAE risk, divergent immunoglobulin expression and more B cell receptor mutations. Consistent with the role of IL-7 in T cell development, risk allele carriers have distinct ICB-induced CD8+ T cell subset responses, skewing of T cell clonality and greater proportional repertoire occupancy by large clones. Finally, analysis of TCGA data suggests that risk allele carriers independently have improved melanoma survival. These observations highlight key roles for B cells and IL-7 in both ICB response and toxicity and clinical outcomes in melanoma.


Conflict of interest statement

C.A.T., R.A.W., O.T., W.Y., R.C., A.V.A., P.K.S., I.N., J.J.G. and A.G. declare no competing interests. M.R.M. reports grants from Roche, grants from AstraZeneca, grants and personal fees from GSK, personal fees and other from Novartis, other from Millenium, personal fees and other from Immunocore, personal fees and other from BMS, personal fees and other from Eisai, other from Pfizer, personal fees, non-financial support and other from Merck/MSD, personal fees and other from Rigontec (acquired by MSD), other from Regeneron, personal fees and other from BiolineRx, personal fees and other from Array Biopharma (now Pfizer), non-financial support and other from Replimune, personal fees from Kineta and personal fees from Silicon Therapeutics, all outside the submitted work. D.C. reports funding from Haliodx and consultancy for Merck. K.S. reports grants from Gilead, Eli Lilly and BMS and personal fees from UCB, AZD, Abbvie and Eli Lilly. P.E. performed consultancy for Abbvie, AstraZeneca, BMS, Boehringer Ingelheim, Galapagos, Gilead, Janssen, MSD, Eli Lilly, Novartis, Pfizer, Roche and Samsung and was involved in clinical trials for Abbvie, BMS, Eli Lilly, Novartis, Pfizer, Roche and Samsung. T.K.C. reports research/advisory boards/consultancy/honorarium (institutional and personal, paid and unpaid) from AstraZeneca, Aveo, Bayer, BMS, Eisai, EMD Serono, Exelixis, GSK, IQVA, Ipsen, Kanaph, Eli Lilly, Merck, Nikang, Novartis, Pfizer, Roche, Sanofi/Aventis, Takeda and Tempest. Travel, accommodations, expenses, medical writing in relation to consulting, advisory roles or honoraria. Stock options: Pionyr and Tempest. Other: up-to-date royalties, CME-related events (for example, OncLIve, PVI and MJH Life Sciences) honoraria. NCI GU Steering Committee. Patents filed, royalties or other intellectual properties (no income as of current date): related to biomarkers of immune checkpoint blockers and ctDNA. No speaker’s bureau. B.P.F. received conference support from BMS and performed consultancy for UCB.

Figures

Fig. 1
Fig. 1. Association of rs16906115 with ICB-associated irAEs and flux in lymphocytes.
a, OR for developing irAEs requiring steroids before C5 of treatment, or ever, according to allele carriage of rs16906115 and treatment type, and all ICB. Whiskers represent 95% CI; two-sided Fisher exact test, n = 214 patients (98 sICB and 116 cICB). b, Pre-treatment versus first post-treatment lymphocyte count for patients receiving sICB, split by allele; two-sided Wilcoxon signed-rank test, n = 60 patients. c, Difference between pre-treatment and post-sICB treatment lymphocyte count by allele; one-sided Student’s t-test, n = 60 patients.
Fig. 2
Fig. 2. B cell IL7 expression associates with rs16906115 allele and independently with irAE risk.
a, Expression of IL7 measured using RNA-seq according to status (patient samples are untreated; healthy donor (HD)) split by cell type; P value from two-sided ANOVA, controlling for age (n refers to sample size for each cell type by HD or patient). b, Expression of IL7 by allelic carriage and patient status; patient samples represent untreated (C1, n = 91), after the second cycle of treatment (C2, n = 68), the earliest available later sample (late, n = 39) or HDs (n = 92); one-sided Wilcoxon rank-sum test. For box plots in a,b, the central line reflects the median; the box corresponds to 25–75% quartiles; the upper whisker extends to the largest value no farther than 1.5× IQR; and the lower whisker extends from the 25% quartile to the smallest value no farther than 1.5× IQR. c, Results from linear mixed model random effect analysis; center point shows the estimate for the variable in association with irAE development when controlling for the other two variables; ANOVA using the Satterthwaite method; error bars mark the 95% CI; n = 91 patients.
Fig. 3
Fig. 3. B cell IL7 expression is associated with pleiotropic effects.
a, Volcano plot demonstrating genes correlated with expression of IL7 from RNA-seq data identified using DESEQ2 from 94 healthy donor (HD) samples, two-tailed Wald test. b, GOBP pathway analysis of genes positively correlated with B cell IL7 (FDR < 0.05); x axis demonstrates fold change above background; y axis demonstrates z-score; all points above dotted line FDR < 0.01; one-tailed hypergeometric test. c, Percentage B cell receptor chains mapped from pre-immunotherapy B cell samples with germline divergent mutations dichotomized by carriage of rs16906115 risk allele, faceted by gene; two-sided Wilcoxon rank-sum test, n = 91. d, Percentage of all B cell clones detected expressing unswitched immunoglobulin IGHD in pre-treatment patient samples dichotomized by carriage of rs16906115 risk allele; two-sided Wilcoxon rank-sum test, n = 91. e, UMAP of scRNA-seq B cells from n = 24 pre-treatment patients and n = 5 healthy donors (15,755 cells total), demonstrating four main populations: naive, USM, SM and ASC. f, Relative IL7 expression across each B cell subset dichotomized according to HD or untreated patient (Mel); two-sided Wilcoxon rank-sum test, n = 24 pre-treatment patients, n = 5 HDs. g, Expression of IL7 across all untreated patient B cells in scRNA-seq data dichotomized according to rs16906115 status; two-sided Wilcoxon rank-sum test, n = 24 pre-treatment patients. h, Frequency of B cell subsets in untreated patients from scRNA-seq data dichotomized according to rs16906115 status; two-sided Wilcoxon rank-sum test, n = 24 pre-treatment patients. For box plots in c,d,fh, the central line reflects the median value; the box corresponds to 25–75% quartiles; the upper whisker extends to the largest value no farther than 1.5× IQR; and the lower whisker extends from the 25% quartile to the smallest value no farther than 1.5× IQR.
Fig. 4
Fig. 4. Risk allele carriage is associated with T-cell-induced ICB responses.
a, Differences in subset proportion (depicted in facet name) between baseline untreated (C1) and immediately before the second cycle of treatment (C2) as determined by flow cytometry results assessing change in CD8+ T cell subset (depicted in facet name) with ICB treatment according to rs16906115 status; two-sided Wilcoxon rank-sum test, n = 54 patients. b, Volcano plot depicting results for DESEQ2 differential gene expression analysis of CD8+ T cell RNA-seq data, dichotomized by rs16906115 status; n = 194 samples across three cycles (untreated, C2 and C4) of sICB treatment, two-tailed Wald test. c, Example box plots of genes regulated by allele in sICB recipients, faceted by timepoint; two-sided t-test of normalized expression values, n = 86 patients at baseline, n = 69 patients at day 21. d, GOBP pathway analysis of genes suppressed in carriers of risk allele (as depicted in b); one-tailed hypergeometric test. e, GOBP pathway analysis of genes anti-correlated in patient CD8+ T cells with increasing B cell IL7 expression from the same blood samples; one-tailed hypergeometric test. f, Comparative analysis of z-scores (x axis: B cell IL7 effect, y axis: rs16906115 effect) from pathway analysis in d and e. g, Change in CD8+ T cell mitotic signature score post-sICB according to rs16906115 status; two-sided t-test, n = 65 patients. For box plots in a,c,g, the central line reflects the median value; the box corresponds to the 25–75% quartiles; the upper whisker extends to the largest value no farther than 1.5× IQR; and the lower whisker extends from the 25% quartile to the smallest value no farther than 1.5× IQR.
Fig. 5
Fig. 5. Risk allele is associated with CD8 clonality and independently associates with survival in TCGA data.
a, Association between count of large CD8+ T cell clones (defined as those >0.5% repertoire in size using TRB) and LS for same individual pre-ICB (C1, left facet) and immediately before the second cycle of treatment (C2, right facet); two-sided t-test, n = 110 patients (C1), n = 91 patients (C2). b, Gini index (measured on TRB chain) immediately before C2 samples from CD8+ T cells across all ICB treatments with available measurement, stratified by carriage at rs16906115; two-sided t-test, n = 62 sICB patients, n = 76 cICB patients, n = 138 both. c, Change in Gini index between pre-treatment (C1) and post-treatment (C2) by ICB type; two-sided t-test, n = 133. d, Proportion of post-treatment clones per repertoire at C2 defined by TRB CDR3 sequence and V and J gene usage at different size thresholds (left to right facets) and by ICB type (cICB upper, sICB lower), dichotomized by rs16906115 carriage; two-way t-test, n = 77 patients cICB, n = 69 patients sICB. For box plots in ad, the central line reflects the median; the box corresponds to 25–75% quartiles; the upper whisker extends to the largest value no farther than 1.5× IQR; and the lower whisker extends from the 25% quartile to the smallest value no farther than 1.5× IQR. e, Carriage of rs16906115 minor allele is associated with disease-specific survival in TCGA melanoma dataset; log-rank test. f, Carriage of rs16906115 minor allele is associated with overall survival in TCGA melanoma dataset; log-rank test.
Extended Data Fig. 1
Extended Data Fig. 1. Extended Clinical Data.
(a) Details of patient cohort, tests are as specified and were two-sided (b) Comparative response of lymphocyte count to cICB and sICB; two-sided Wilcoxon signed rank test, n = 134 patients (74 cICB, 60 sICB). c) Comparison of fall in lymphocyte count in recipients of nivolumab versus those of pembrolizumab; two-sided T tests (n = 74 ipi/nivo, n = 9 nivo, n = 51 pembrolizumab). (d) Kaplan Meier analysis of progression-free survival in immunotherapy naïve metastatic melanoma patients within the cohort according to LS (unstable defined as post-treatment lymphocyte count ≤80% pre-treatment value); log-rank test (n = 111). (e) As per (d), but curves represent overall survival across cohort according to LS (n = 111). For boxplots in Extended Data Fig. 1b, c central line reflects the median, the box reflects the 25%–75% quartiles, upper whisker extends to largest value no further than 1.5x interquartile range, lower whisker extends from 25% quartile to the smallest value no further than 1.5x interquartile range.
Extended Data Fig. 2
Extended Data Fig. 2. IL7 Expression Across Cell Types.
(a) Association between donor age and IL7 expression across cell types, stratified by status (HD – healthy donor); P value from two-sided ANOVA, correcting for status (CD14: n = 42 HD, 216 patient samples; CD19: n = 90 HD, 159 patient samples; CD4 naïve: n = 8 HD, 50 patient samples; CD8: n = 68 HD, 326 patient samples; NK: n = 31 HD, 120 patient samples). (b) B cell expression of IL7 in patient samples according to cycle and treatment type, no significant difference was noted with type or between baseline untreated and immediately prior to the second cycle of treatment (C2); two-sided T test, n = 113 cICB, n = 46 sICB. (c) B cell expression of IL7 split by treatment type according to rs16906115 carriage; one-sided Wilcoxon rank-sum test, C1: n = 64 cICB patients, n = 27 sICB patients; C2: n = 49 cICB patients, n = 19 sICB patients; late: n = 24 cICB patients, n = 15 sICB patients. (d) Expression of IL7 in patient and healthy donor (HD) samples dichotomized by rs16906115 status, faceted by cell type, across all samples in cohort, P value refers to result from two-sided T test between absence and presence of risk allele (one or two copies). (e) Expression of IL7 transcripts annotated using StringTie according to allele status across all B cell samples showing a pan transcript effect of rs16906115 carriage; two-sided Wilcoxon rank-sum test. (f) Representative flow plot showing PBMCs gated on expression of CD19 with forward scatter on the X-axis versus IL-7 positive events on the y-axis. Primary = primary biotinylated anti-IL-7, secondary = Streptavidin PE, FMO = fluorescence minus one. (g) Analysis of samples demonstrated consistent detection of IL-7 positive B cell population in PBMCs from patients (n = 2) and controls (n = 2), with IL-7 positive fractions not detected in cells gated for CD3 (T cells), CD56+, CD3- (NK cells) or CD14 (monocytes). For boxplots in Extended Data Fig. 2b–e, g; the central line reflects the median, the box 25%–75% quartiles, upper whisker extends to largest value no further than 1.5x interquartile range, lower whisker extends from 25% quartile to the smallest value no further than 1.5x interquartile range.
Extended Data Fig. 3
Extended Data Fig. 3. B cell correlates of IL7 expression.
(a) GOBP pathway analysis of genes anti-correlated with B cell IL7 (FDR < 0.05), x -axis demonstrates fold-change above background, y-axis z score, all points above dotted line FDR < 0.01, one-tailed hypergeometric test. (b) Percentage chains detected with mutation from germline (chain denoted in label) or clones containing IGHD (y axis) versus relative expression IL7 for that sample (x axis), P value refers to Spearman rank-test result, dotted lines reflect fitted linear model, shaded area 95% Confidence Interval. (c) Heatmap of key B cell subset specific genes from scRNA-seq data. (d) GOBP analysis of genes differentially expressed between B cell subsets, top 5 pathways per subset listed, one-tailed hypergeometric test. (e) UMAP from main Fig. 3e, depicting relative IL7 expression per cell. (f) Relative expression of IL7 (imputed) using scRNA-seq dataset across all B cells separated by subset (n = 28 samples). (g) Immunoglobulin chain usage in Naïve B cell subset according to patient status (HD - healthy donor n = 5, mel – metastatic melanoma n = 23); two-sided Wilcoxon rank-sum test. (h) Median expression of IL7 per B cell subset from scRNA-seq data dichotomised by rs16906115 demonstrating genotype acts through altering proportions of subsets as opposed to relative expression per cell (n = 23 patients); two-sided Wilcoxon rank-sum test. For boxplots in Extended Data Fig. 3f–h the central line reflects the median value, the box corresponds to 25%–75% quartiles, the upper whisker extends to largest value no further than 1.5x interquartile range, the lower whisker extends from 25% quartile to the smallest value no further than 1.5x interquartile range.
Extended Data Fig. 4
Extended Data Fig. 4. Extended T cell data.
(a) Correlation of fold change in lymphocyte count measured on routine hospital bloods (as per Lymphocyte Stability) versus % change in cell subset as measured using flow-cytometry at the same timepoint. From left: right; % all T cells in PBMC, % T Effector Memory, % Naïve T cells; P value from Spearman rank test, dotted lines reflect fitted linear model, shaded area the 95% Confidence Interval, n = 40. (b) Correlation of CD8+ T cell expression of SH3BGRL2 versus the naïve marker CD27 in healthy donors (left facet) and patient samples (right facet); Spearman rank test, shaded area reflects 95% Confidence Interval of fitted linear model, P interaction with status <0.001, n = 67 controls, n = 326 patient C1/C2 samples. (c) GOBP pathway analysis of genes upregulated in CD8+ T cells in carriers of risk allele (as depicted in Fig. 4b), one-tailed hypergeometric test. (d) GOBP pathway analysis of genes anti-correlated in patient CD8+ T cells with increasing B cell IL7 expression from same blood samples, having corrected for rs16906115 status, one-tailed hypergeometric test. e) GOBP pathway analysis of genes anti-correlated in patient CD8+ T cells with increasing B cell IL7 expression in non-carriers of risk allele only, one-tailed hypergeometric test.
Extended Data Fig. 5
Extended Data Fig. 5. TCGA survival data by rs16906115 carriage.
(a) Progression-free survival according to rs16906115 allele status across All Stages in TCGA melanoma dataset. (b) As per Extended Data Fig. 5a, but Stages IIB-IV. (c) Carriage of rs16906115 minor allele is associated with disease-specific survival in Stages IIB-IV in TCGA melanoma dataset. (d) Overall Survival according to rs16906115 allele status across Stages IIB-IV Stages in TCGA melanoma dataset. All P values correspond to log-rank test.

Comment in

References

    1. Larkin J, et al. Five-year survival with combined nivolumab and ipilimumab in advanced melanoma. N. Engl. J. Med. 2019;381:1535–1546. - PubMed
    1. Weber J, et al. Adjuvant nivolumab versus ipilimumab in resected stage III or IV melanoma. N. Engl. J. Med. 2017;377:1824–1835. - PubMed
    1. Robert C, et al. Pembrolizumab versus ipilimumab in advanced melanoma (KEYNOTE-006): post-hoc 5-year results from an open-label, multicentre, randomised, controlled, phase 3 study. Lancet Oncol. 2019;20:1239–1251. - PubMed
    1. Michot JM, et al. Immune-related adverse events with immune checkpoint blockade: a comprehensive review. Eur. J. Cancer. 2016;54:139–148. - PubMed
    1. Schneider BJ, et al. Management of immune-related adverse events in patients treated with immune checkpoint inhibitor therapy: ASCO guideline update. J. Clin. Oncol. 2021;39:4073–4126. - PubMed

Publication types