. 2023 Jan;37(1):e22715.
doi: 10.1096/fj.202201088R.

Annexin A2 modulates phospholipid membrane composition upstream of Arp2 to control angiogenic sprout initiation

Affiliations

Annexin A2 modulates phospholipid membrane composition upstream of Arp2 to control angiogenic sprout initiation

Timothy M Sveeggen et al. FASEB J. 2023 Jan.

Abstract

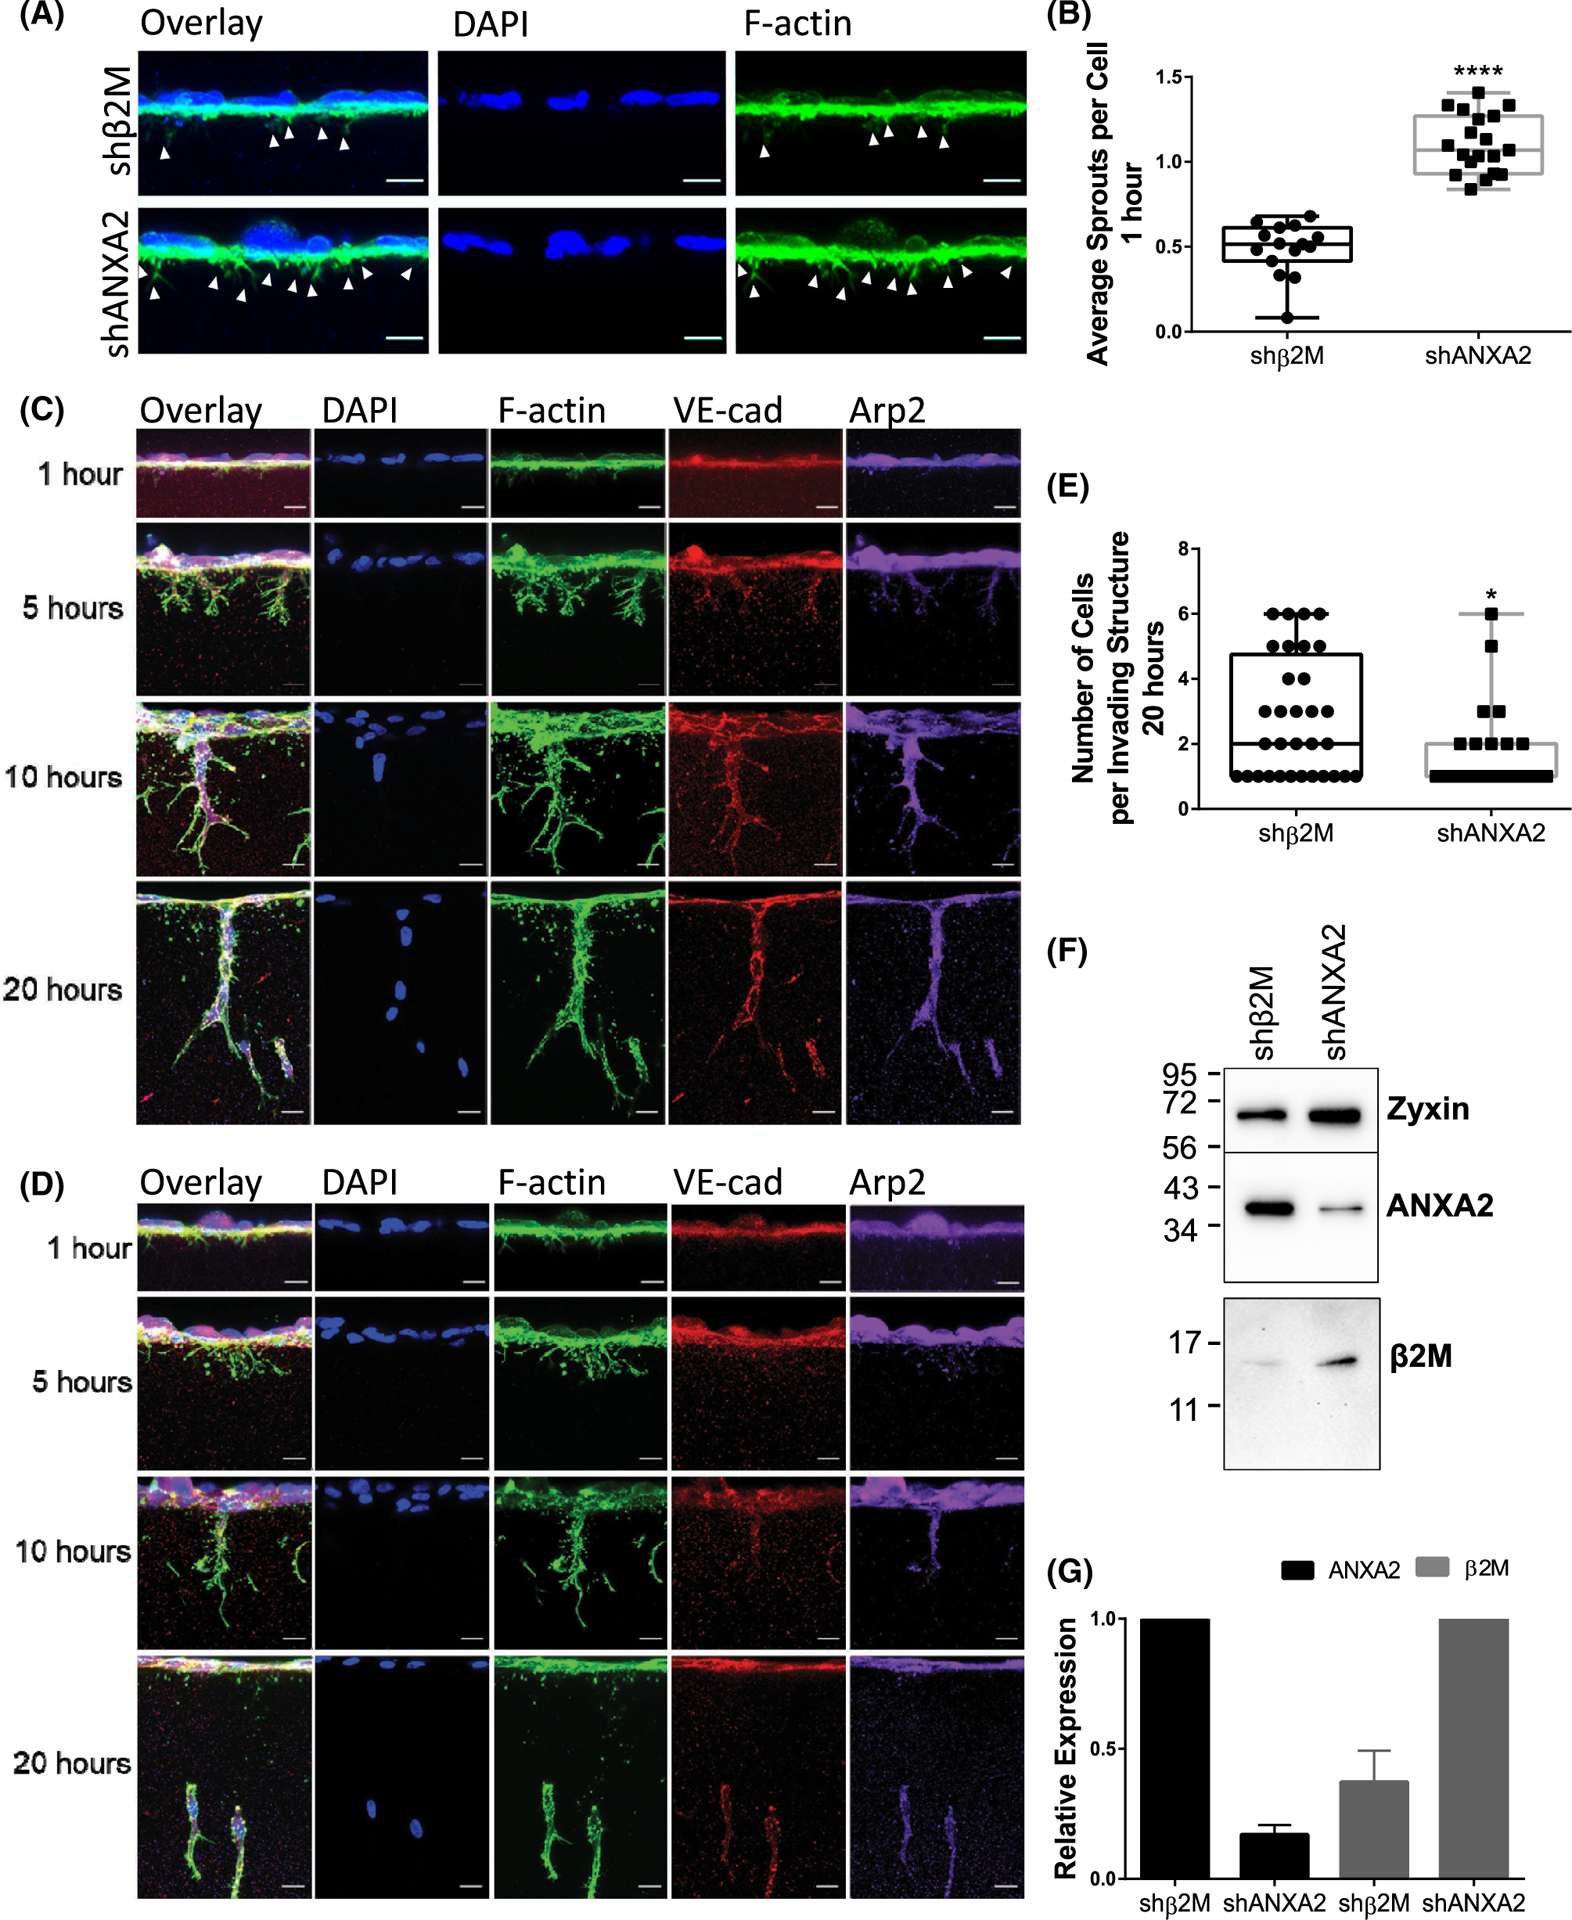
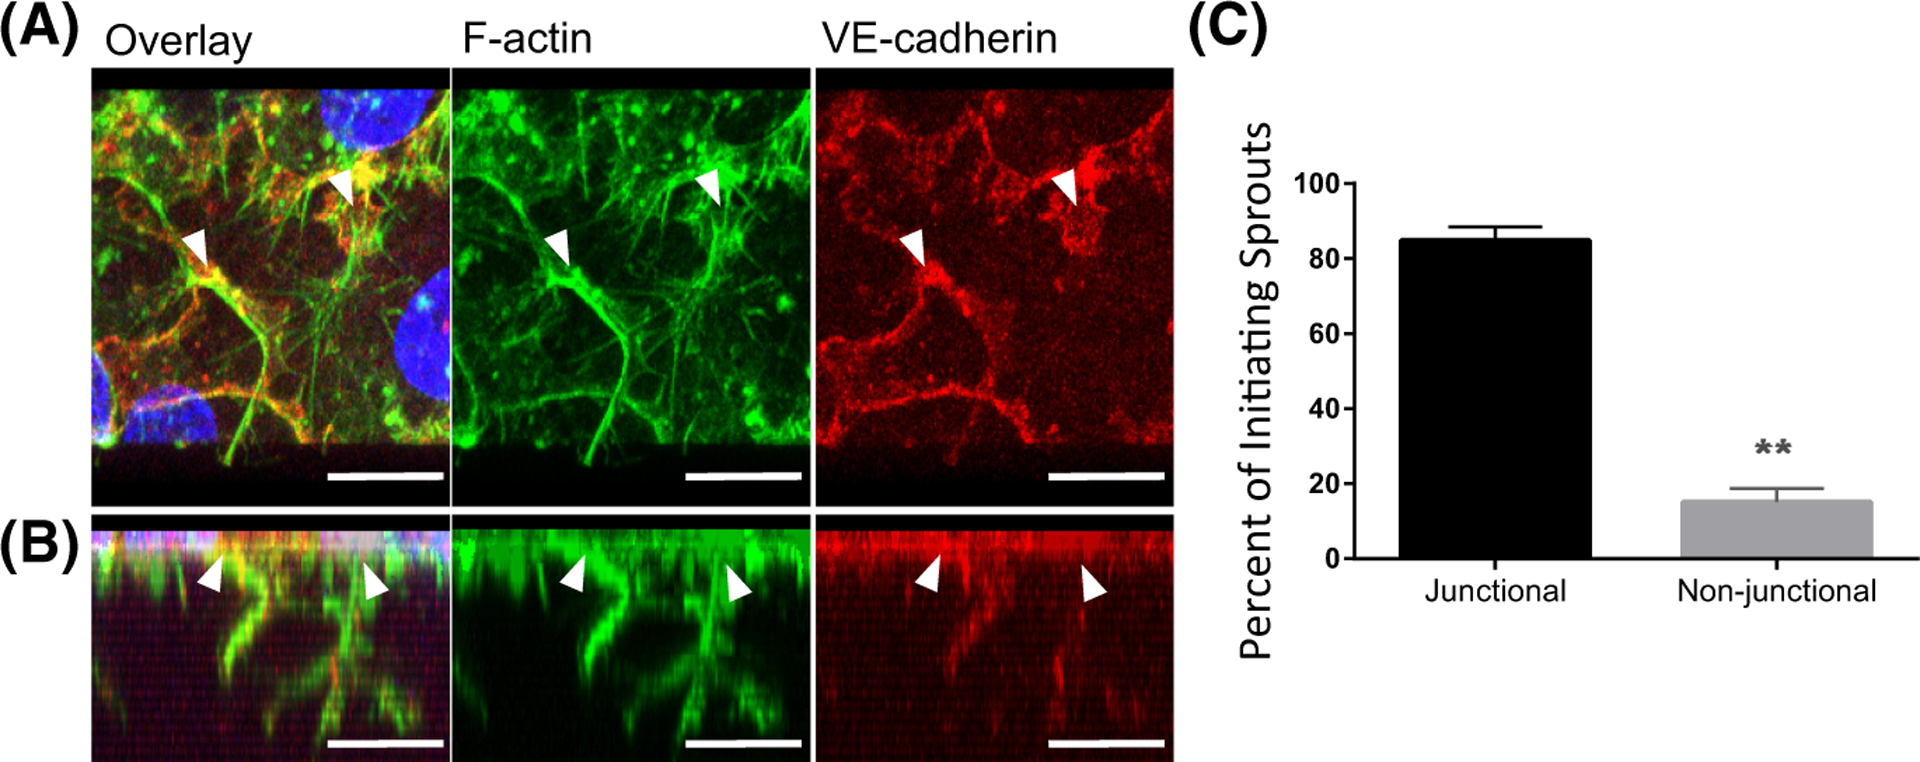
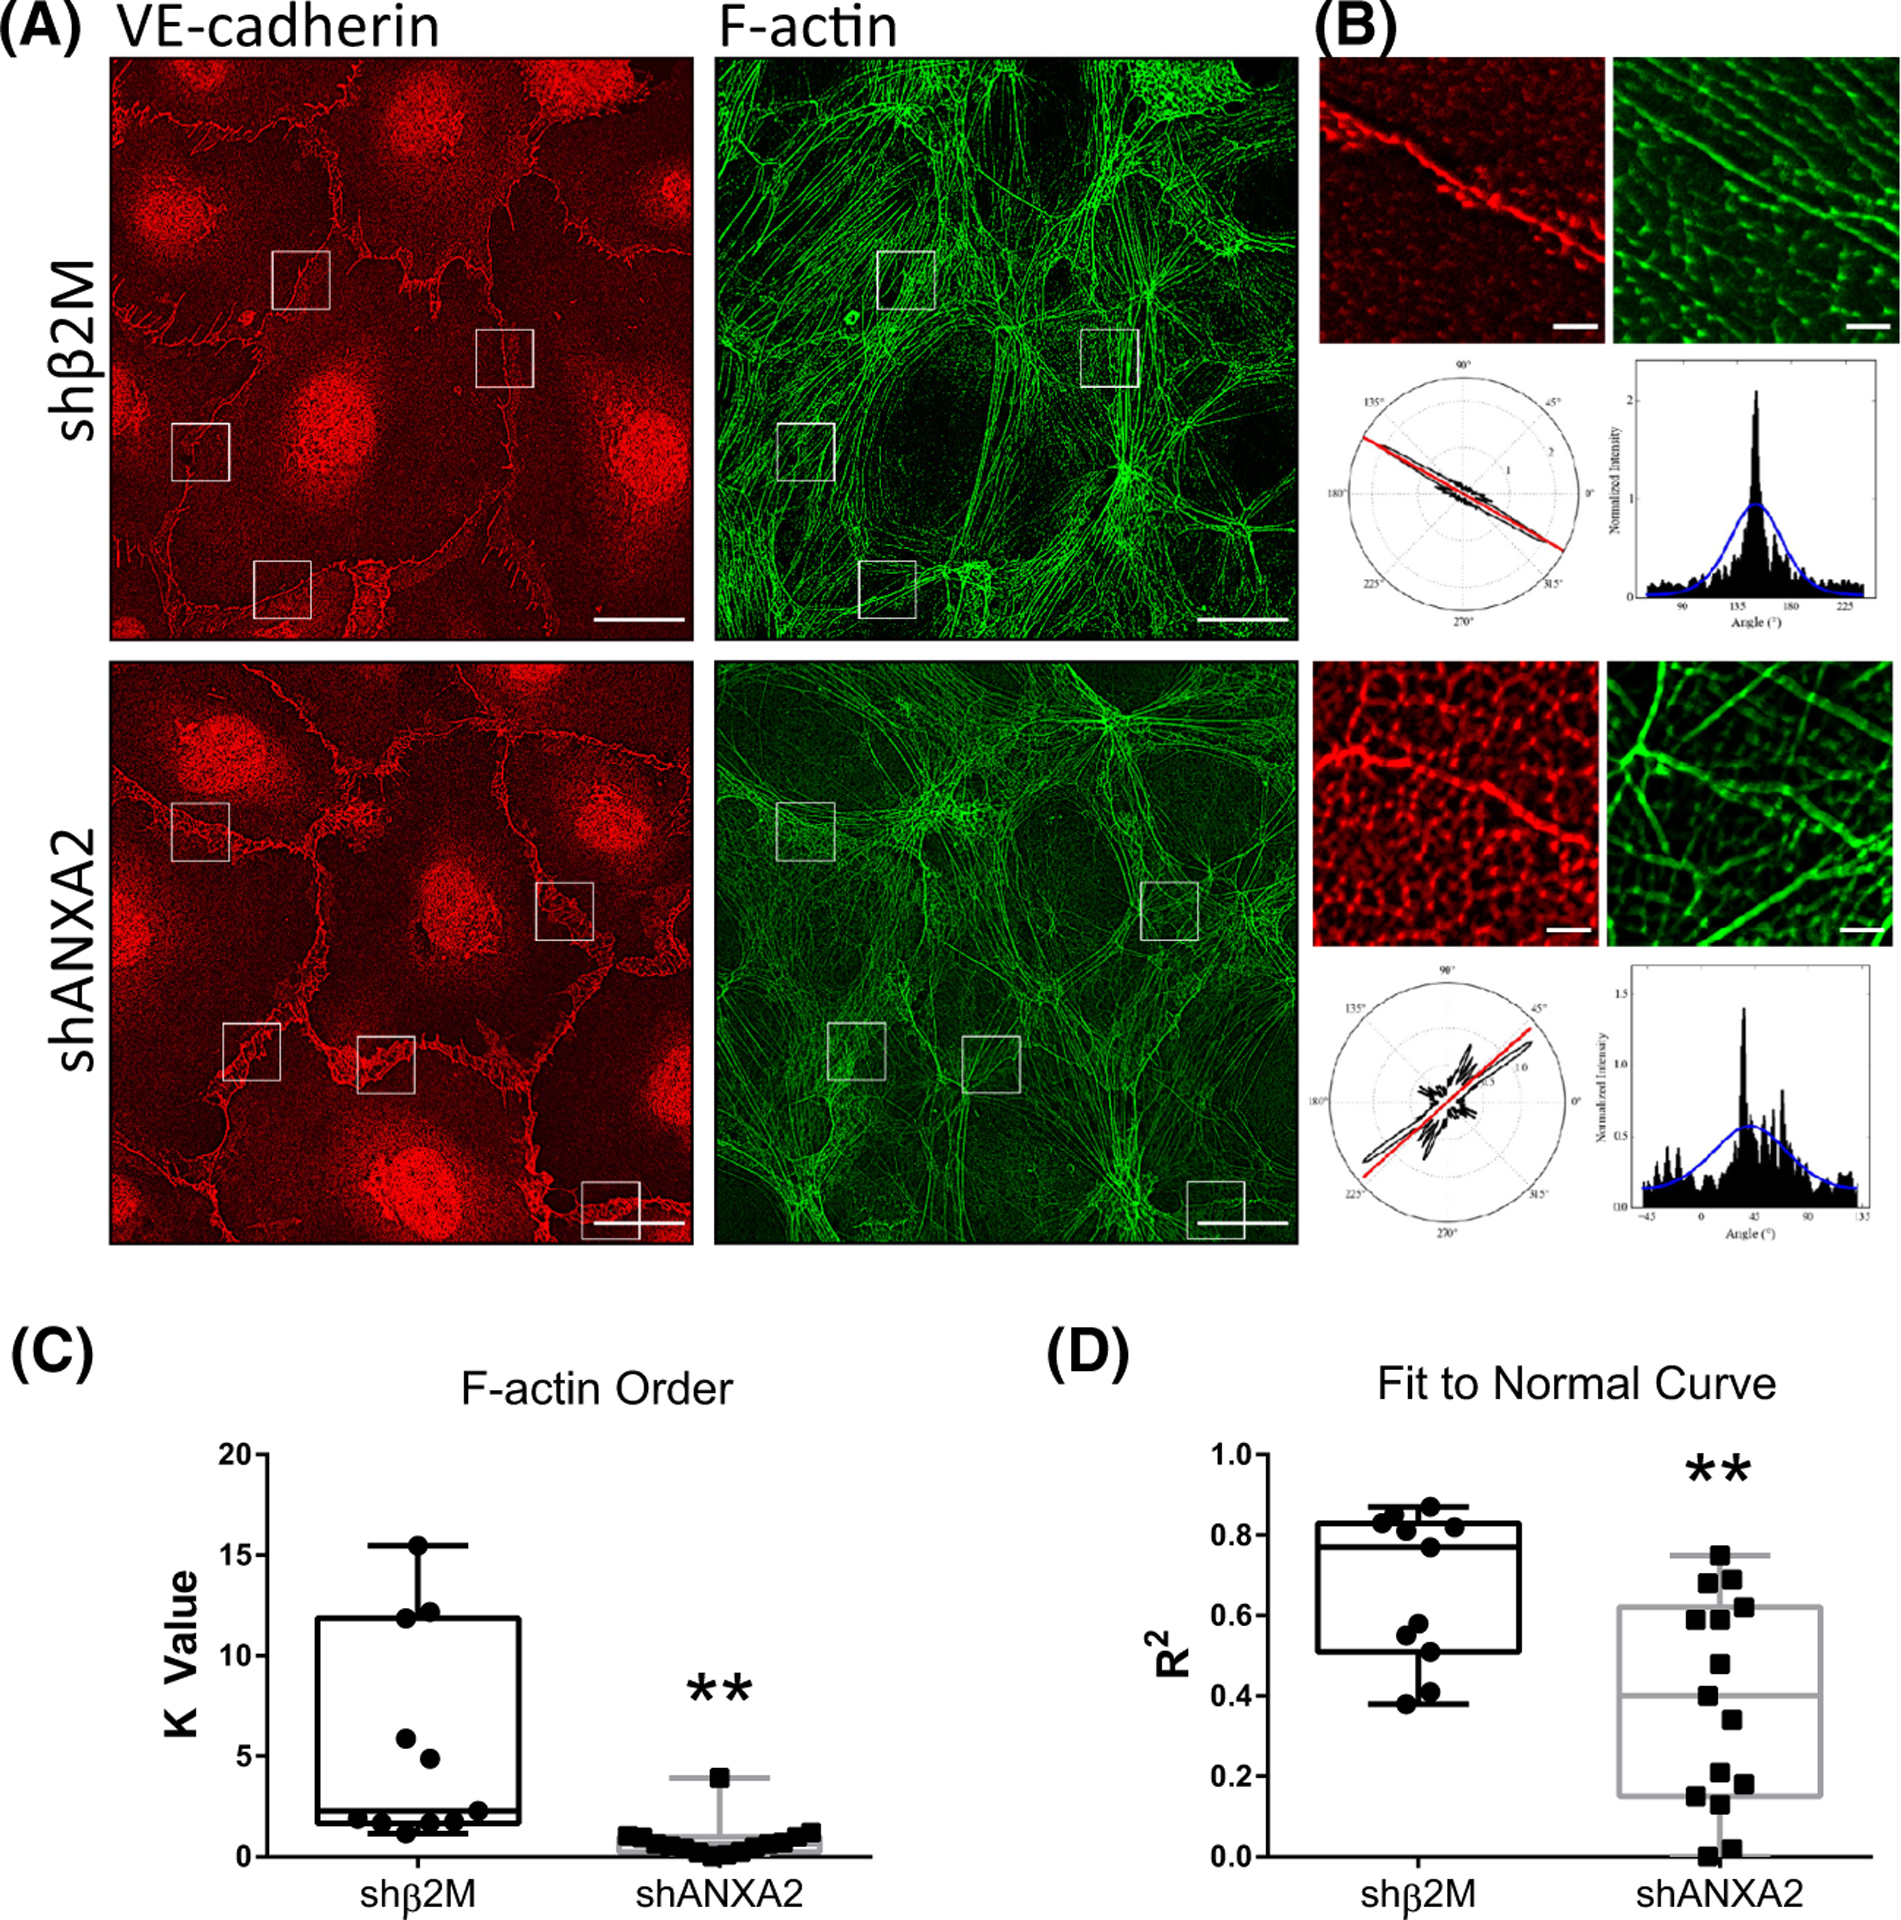
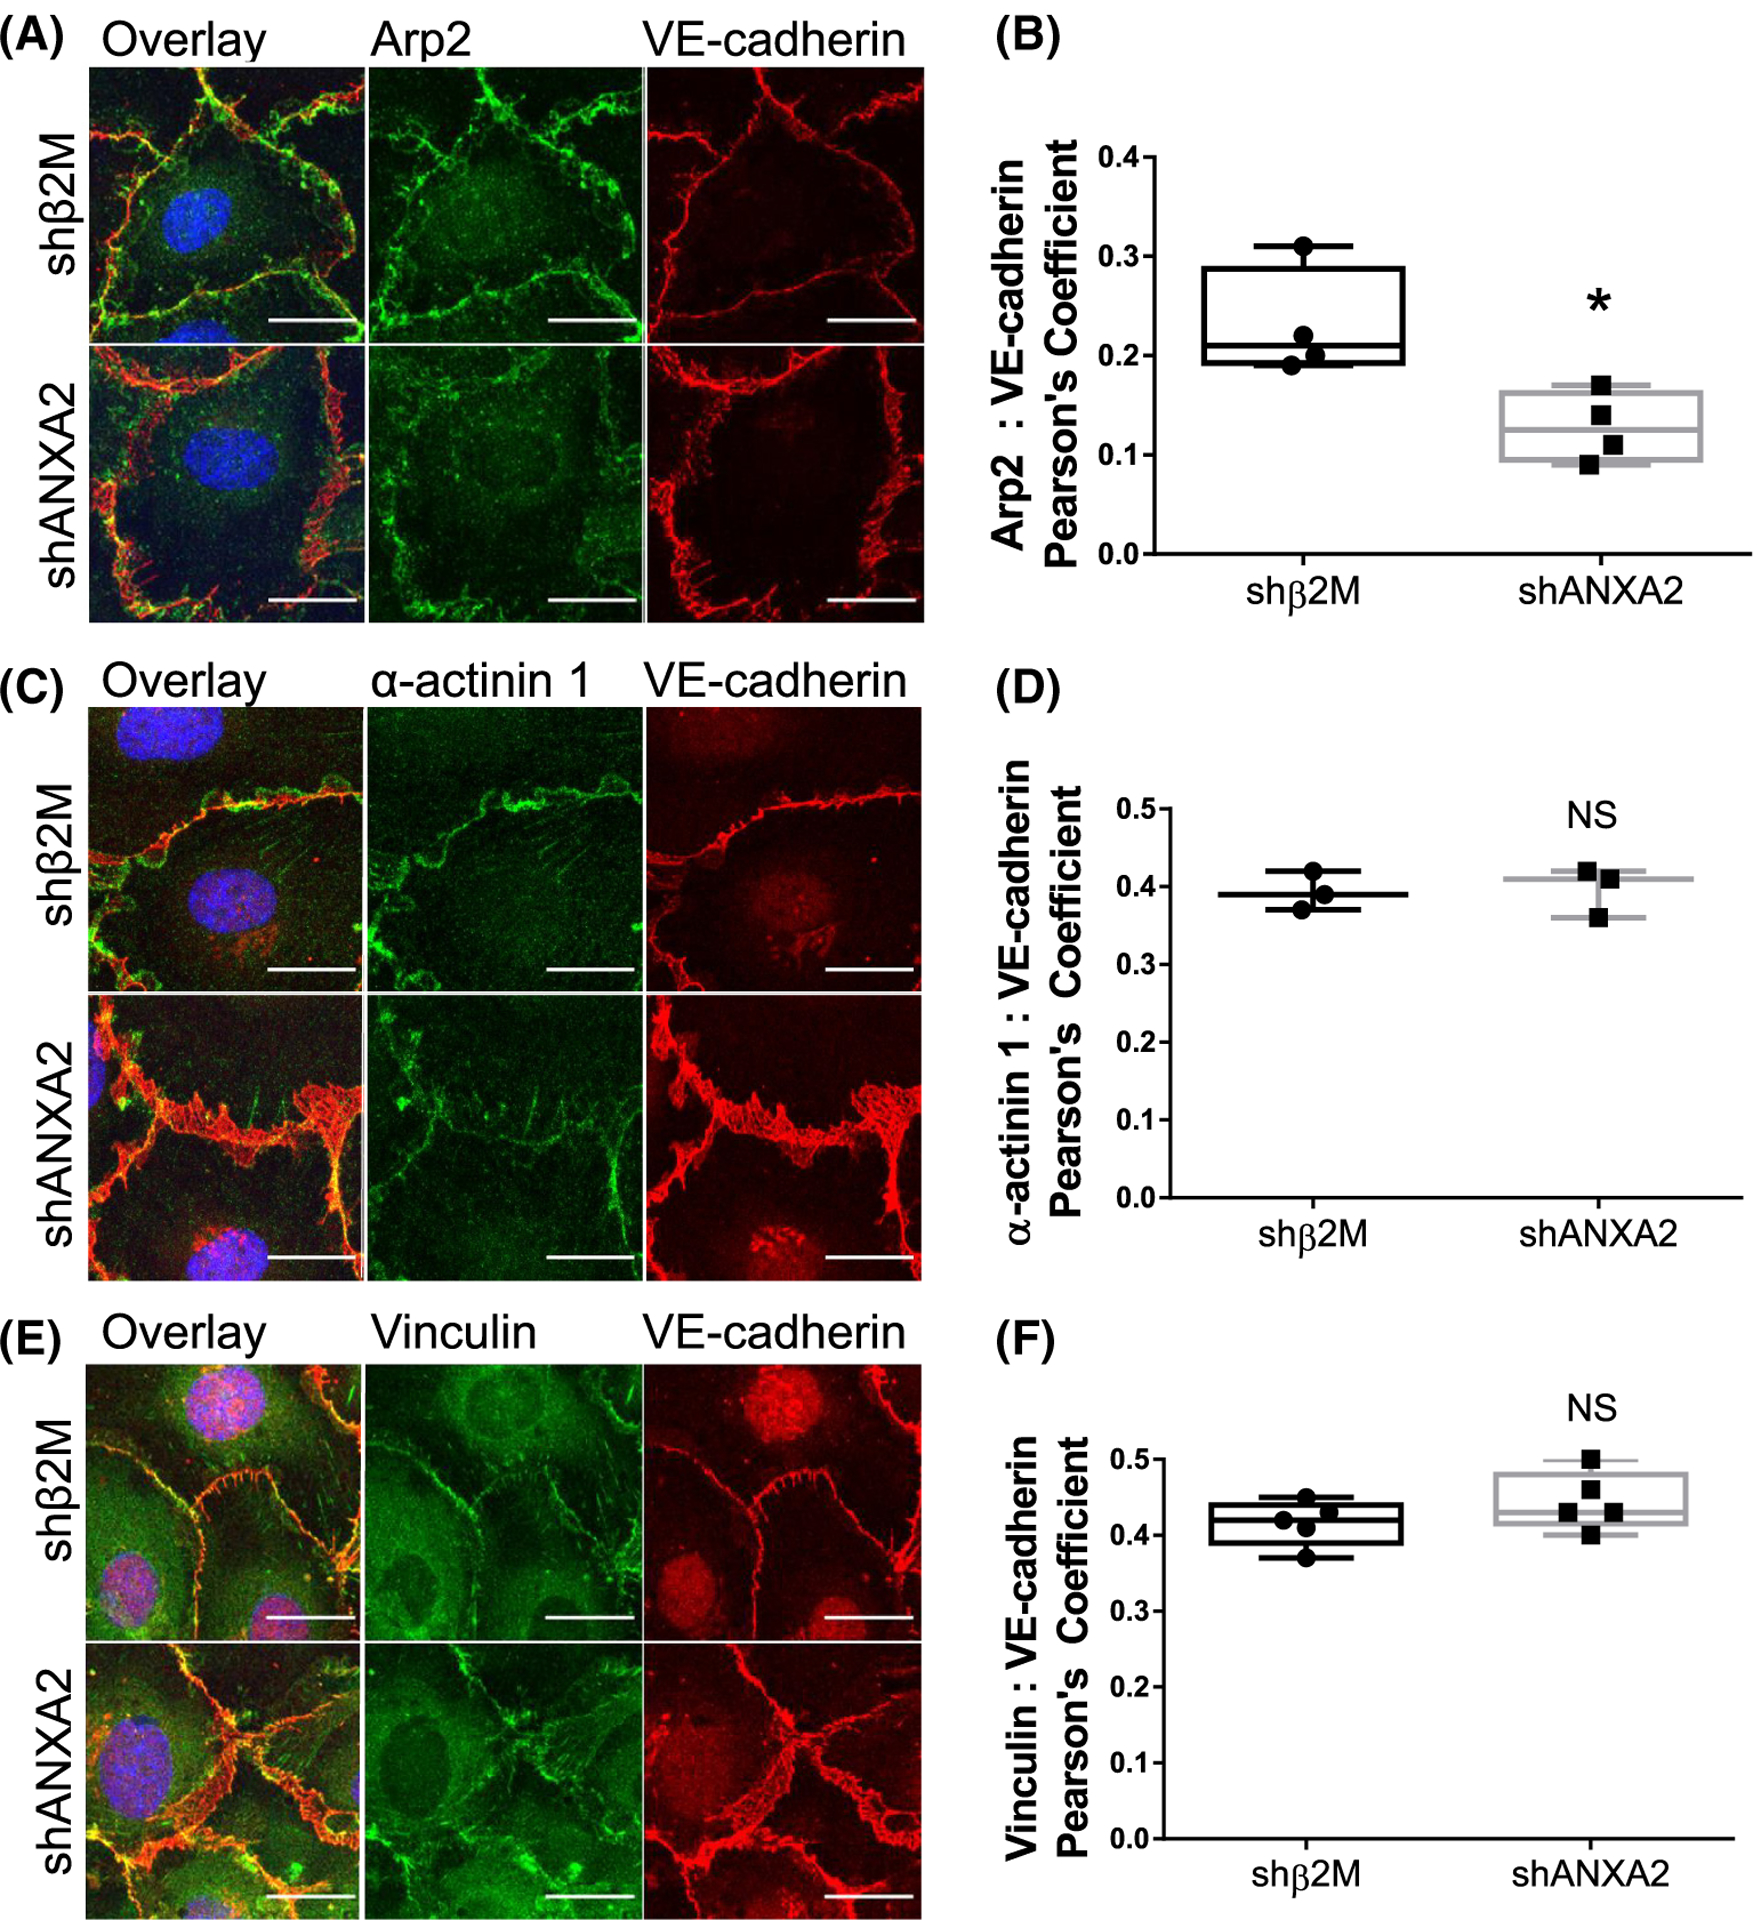
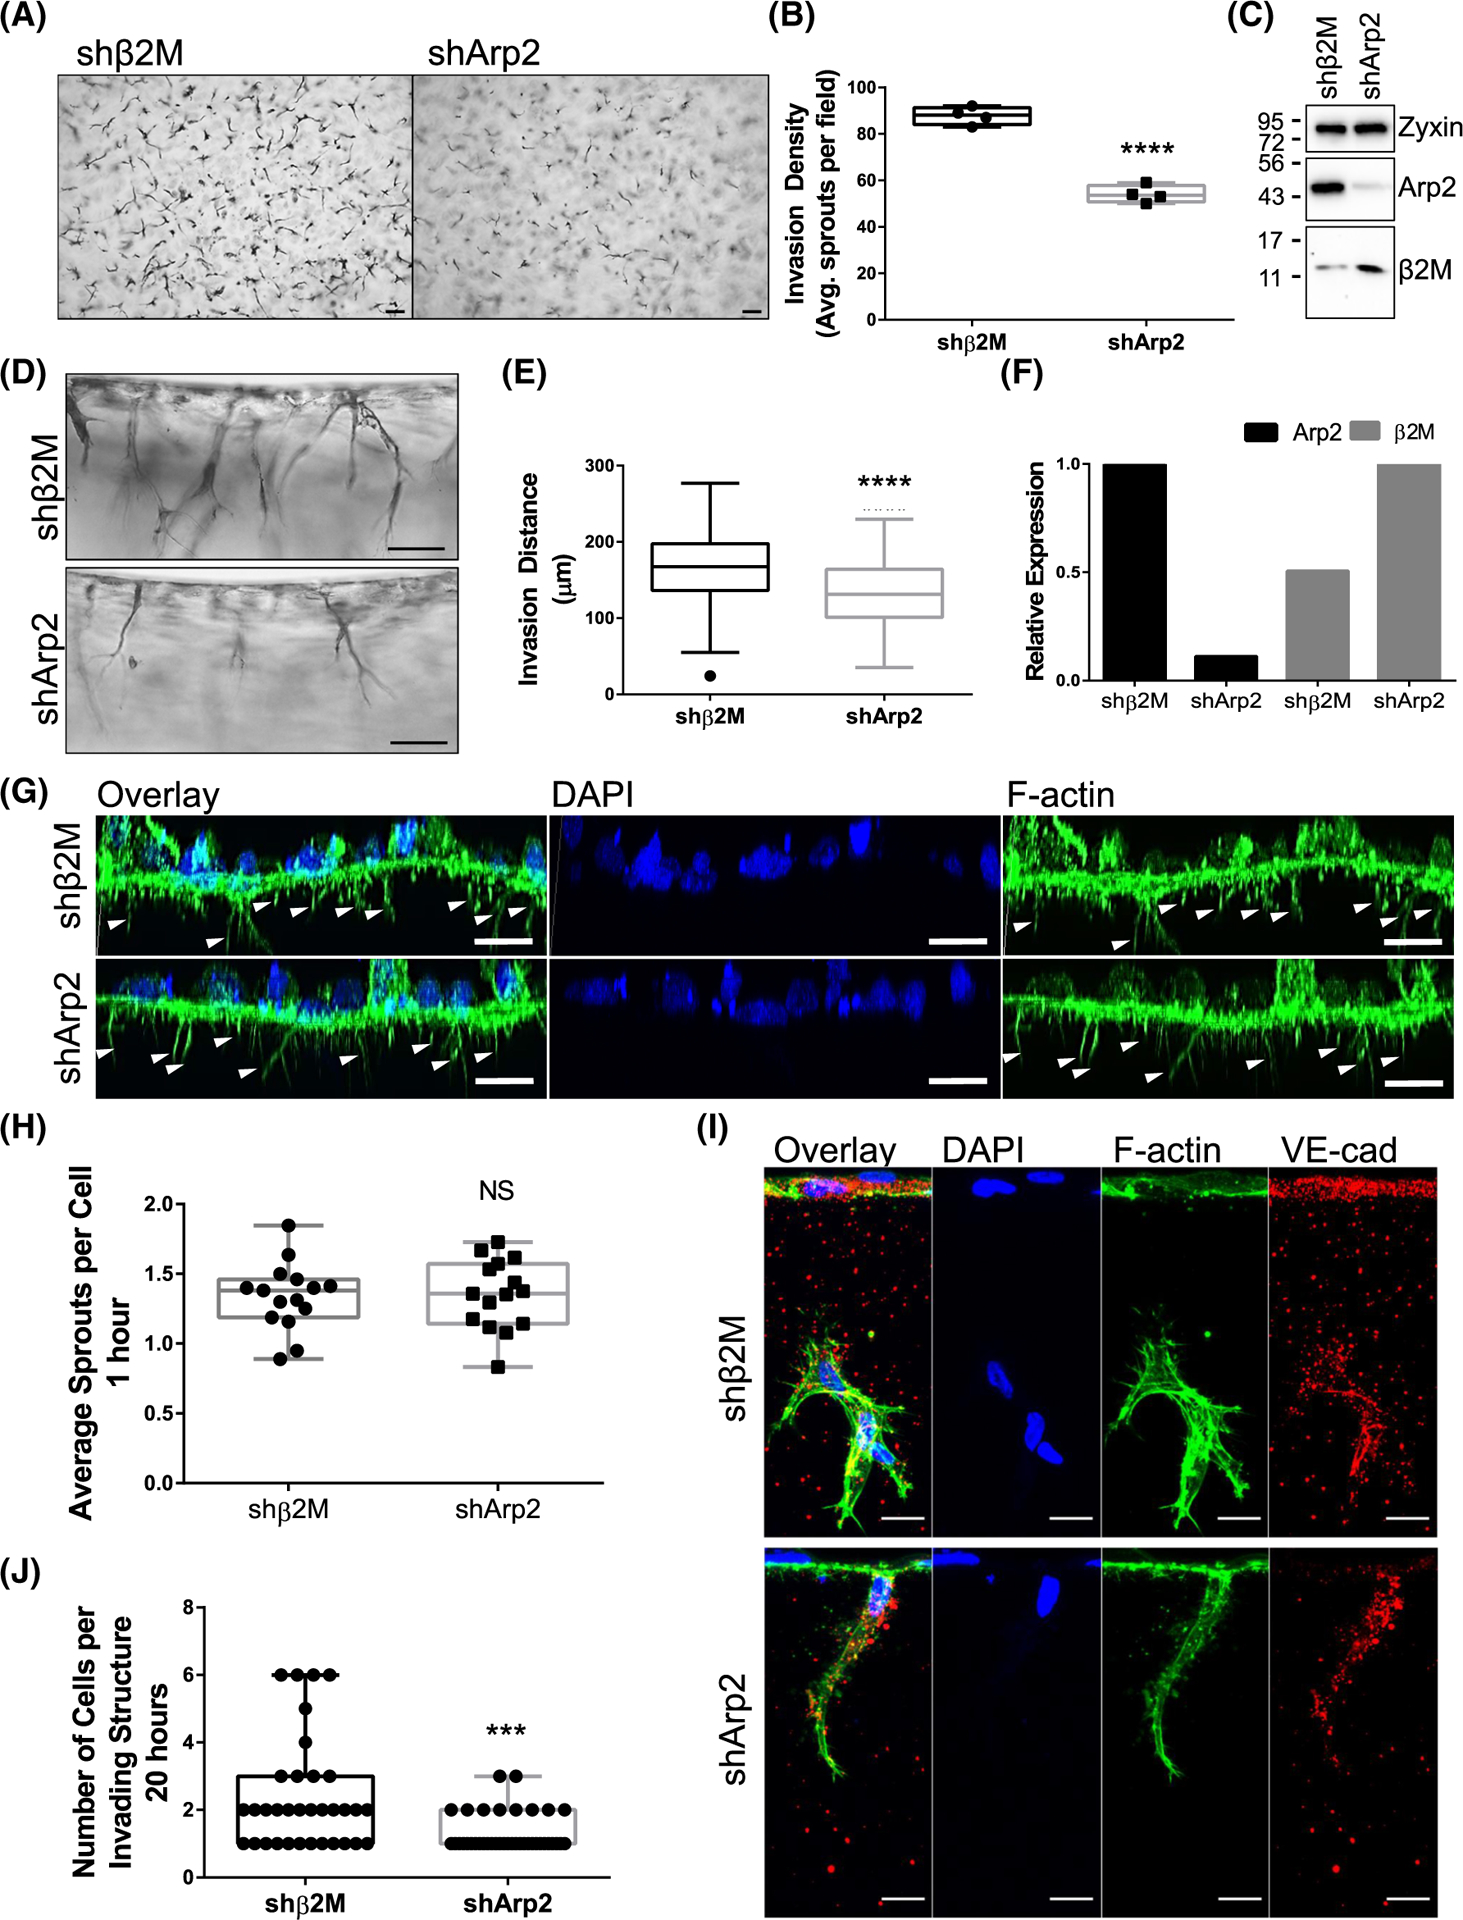
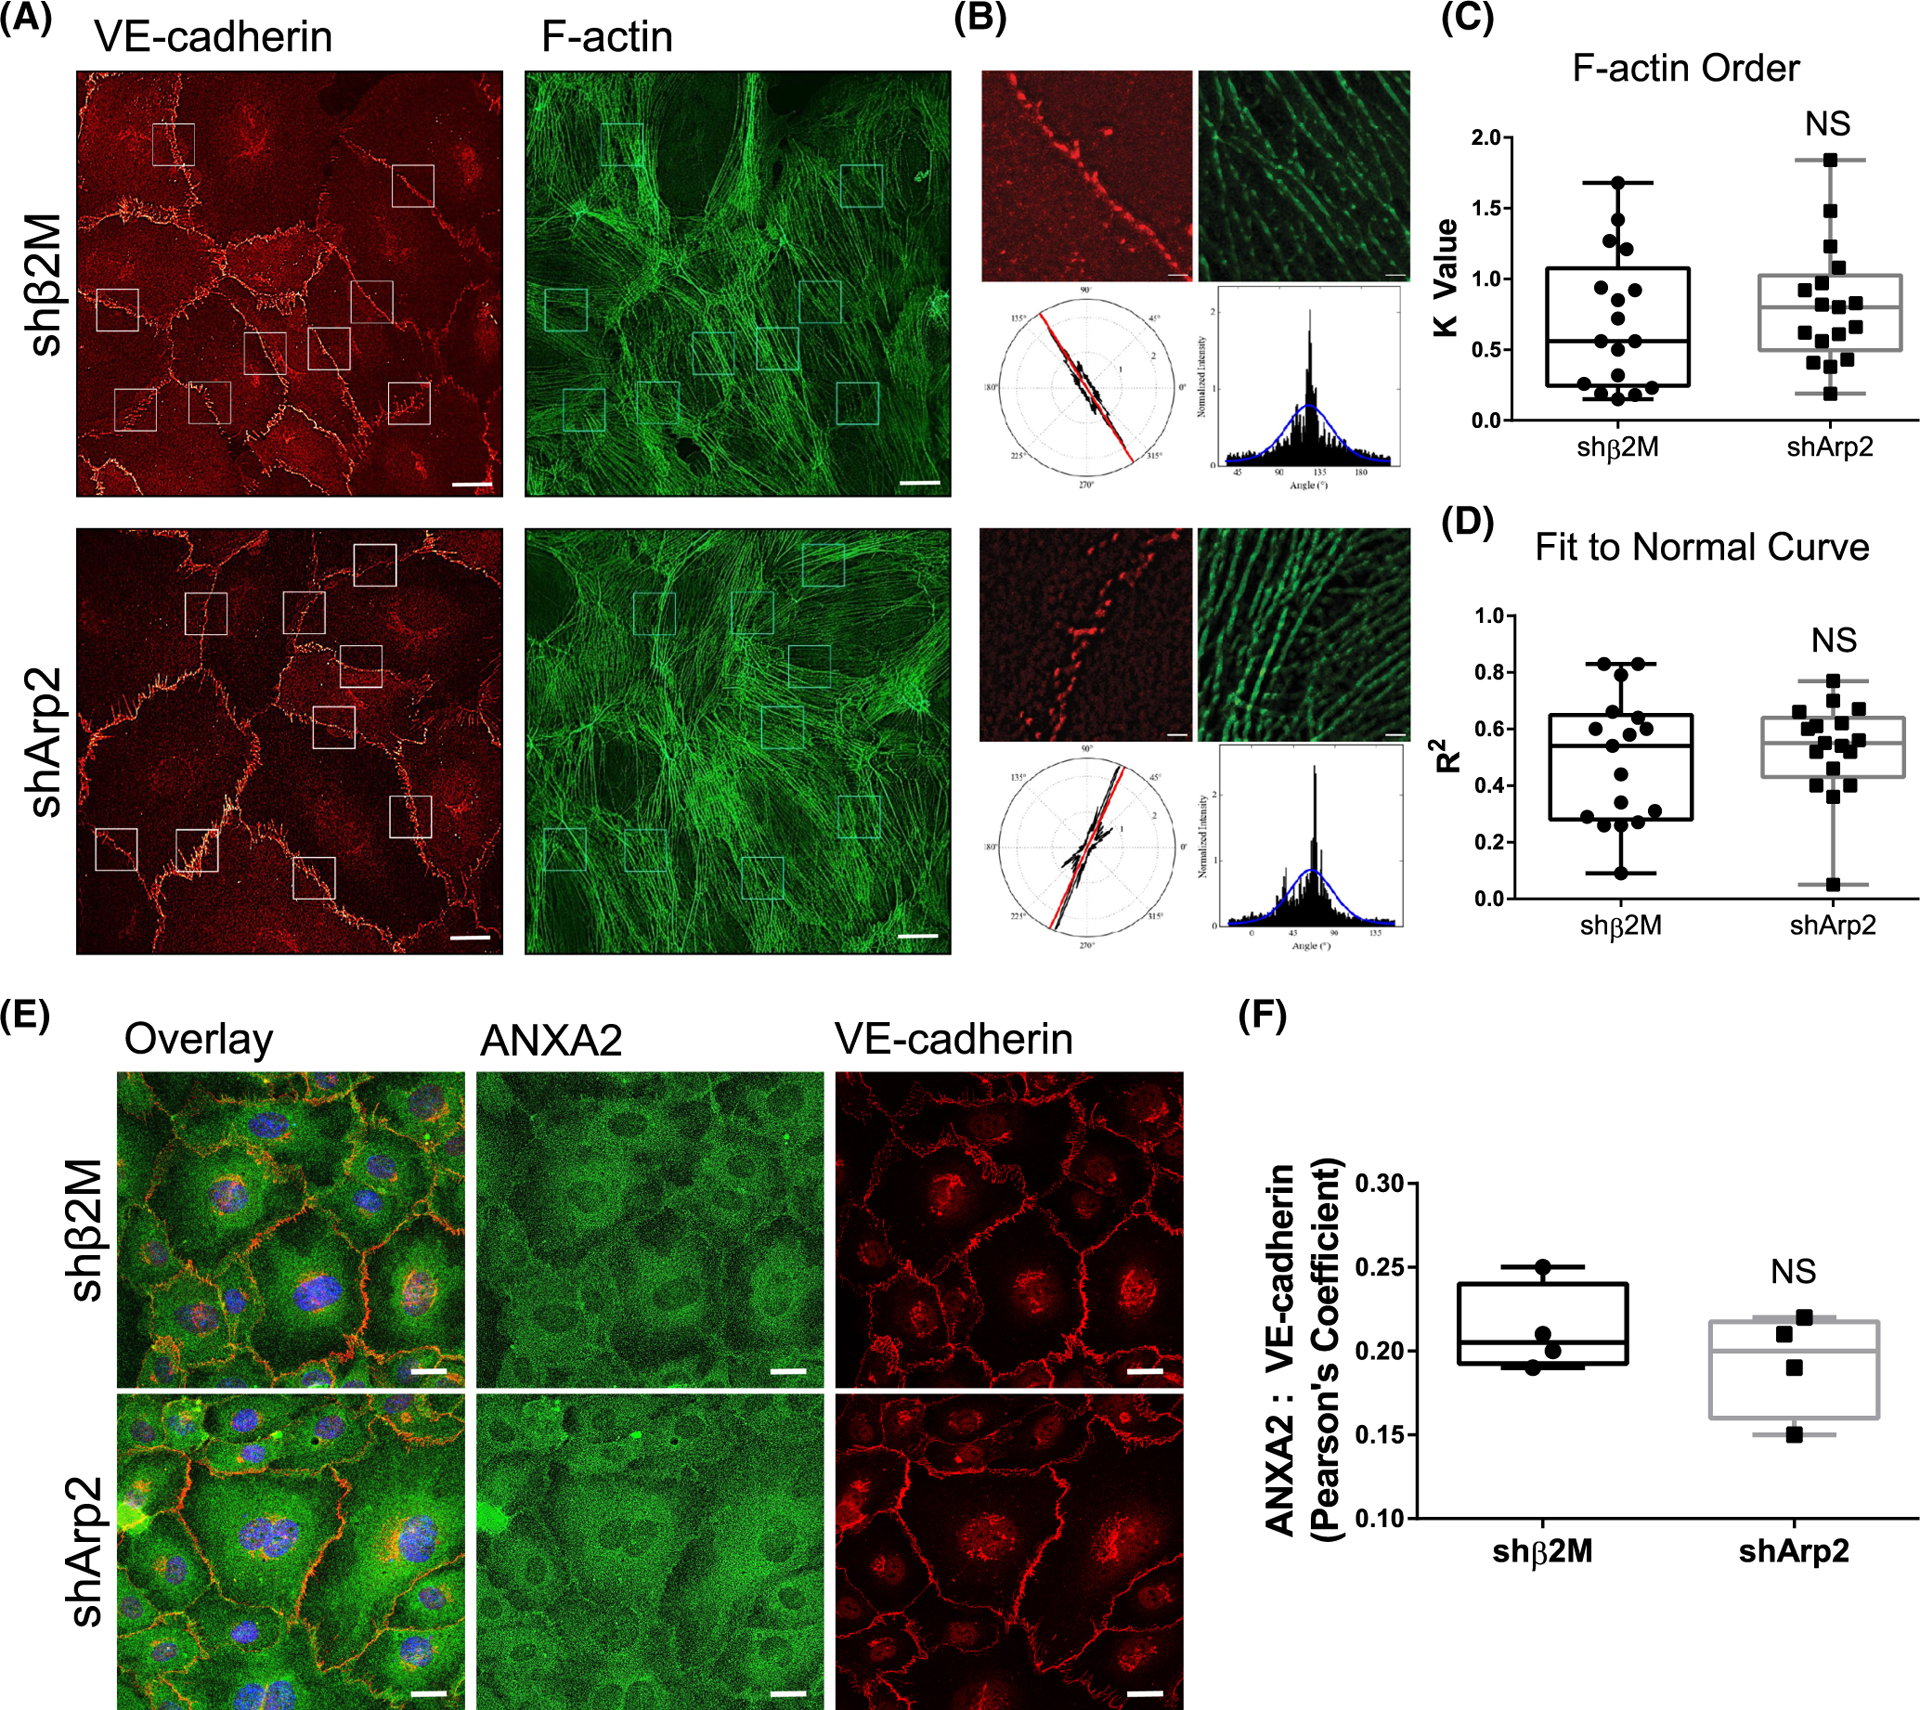
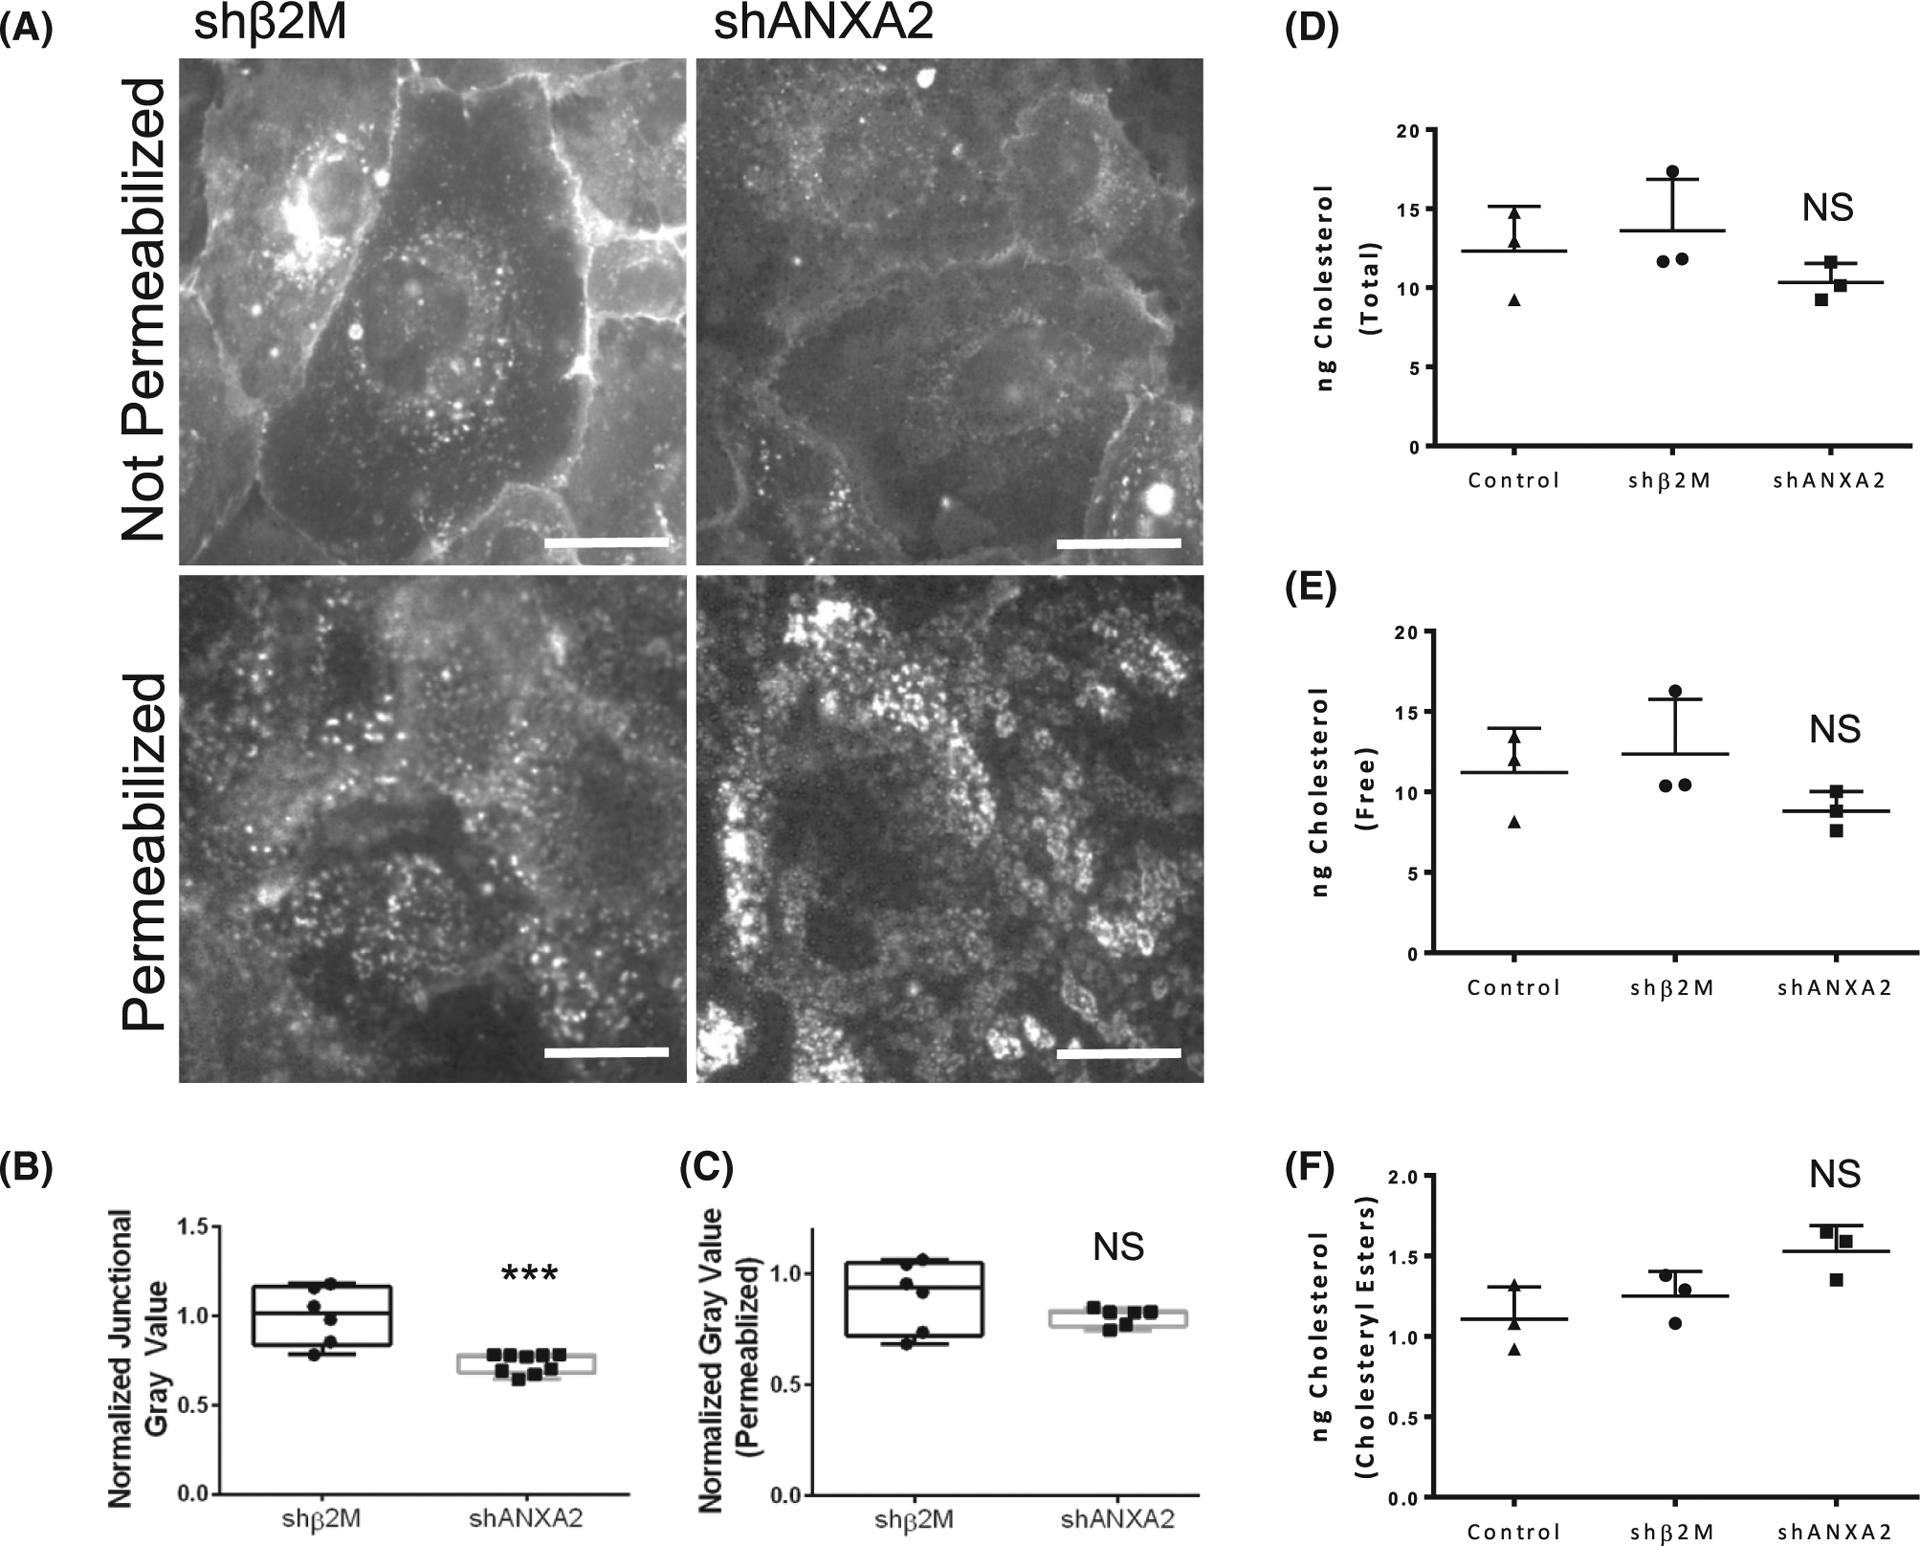
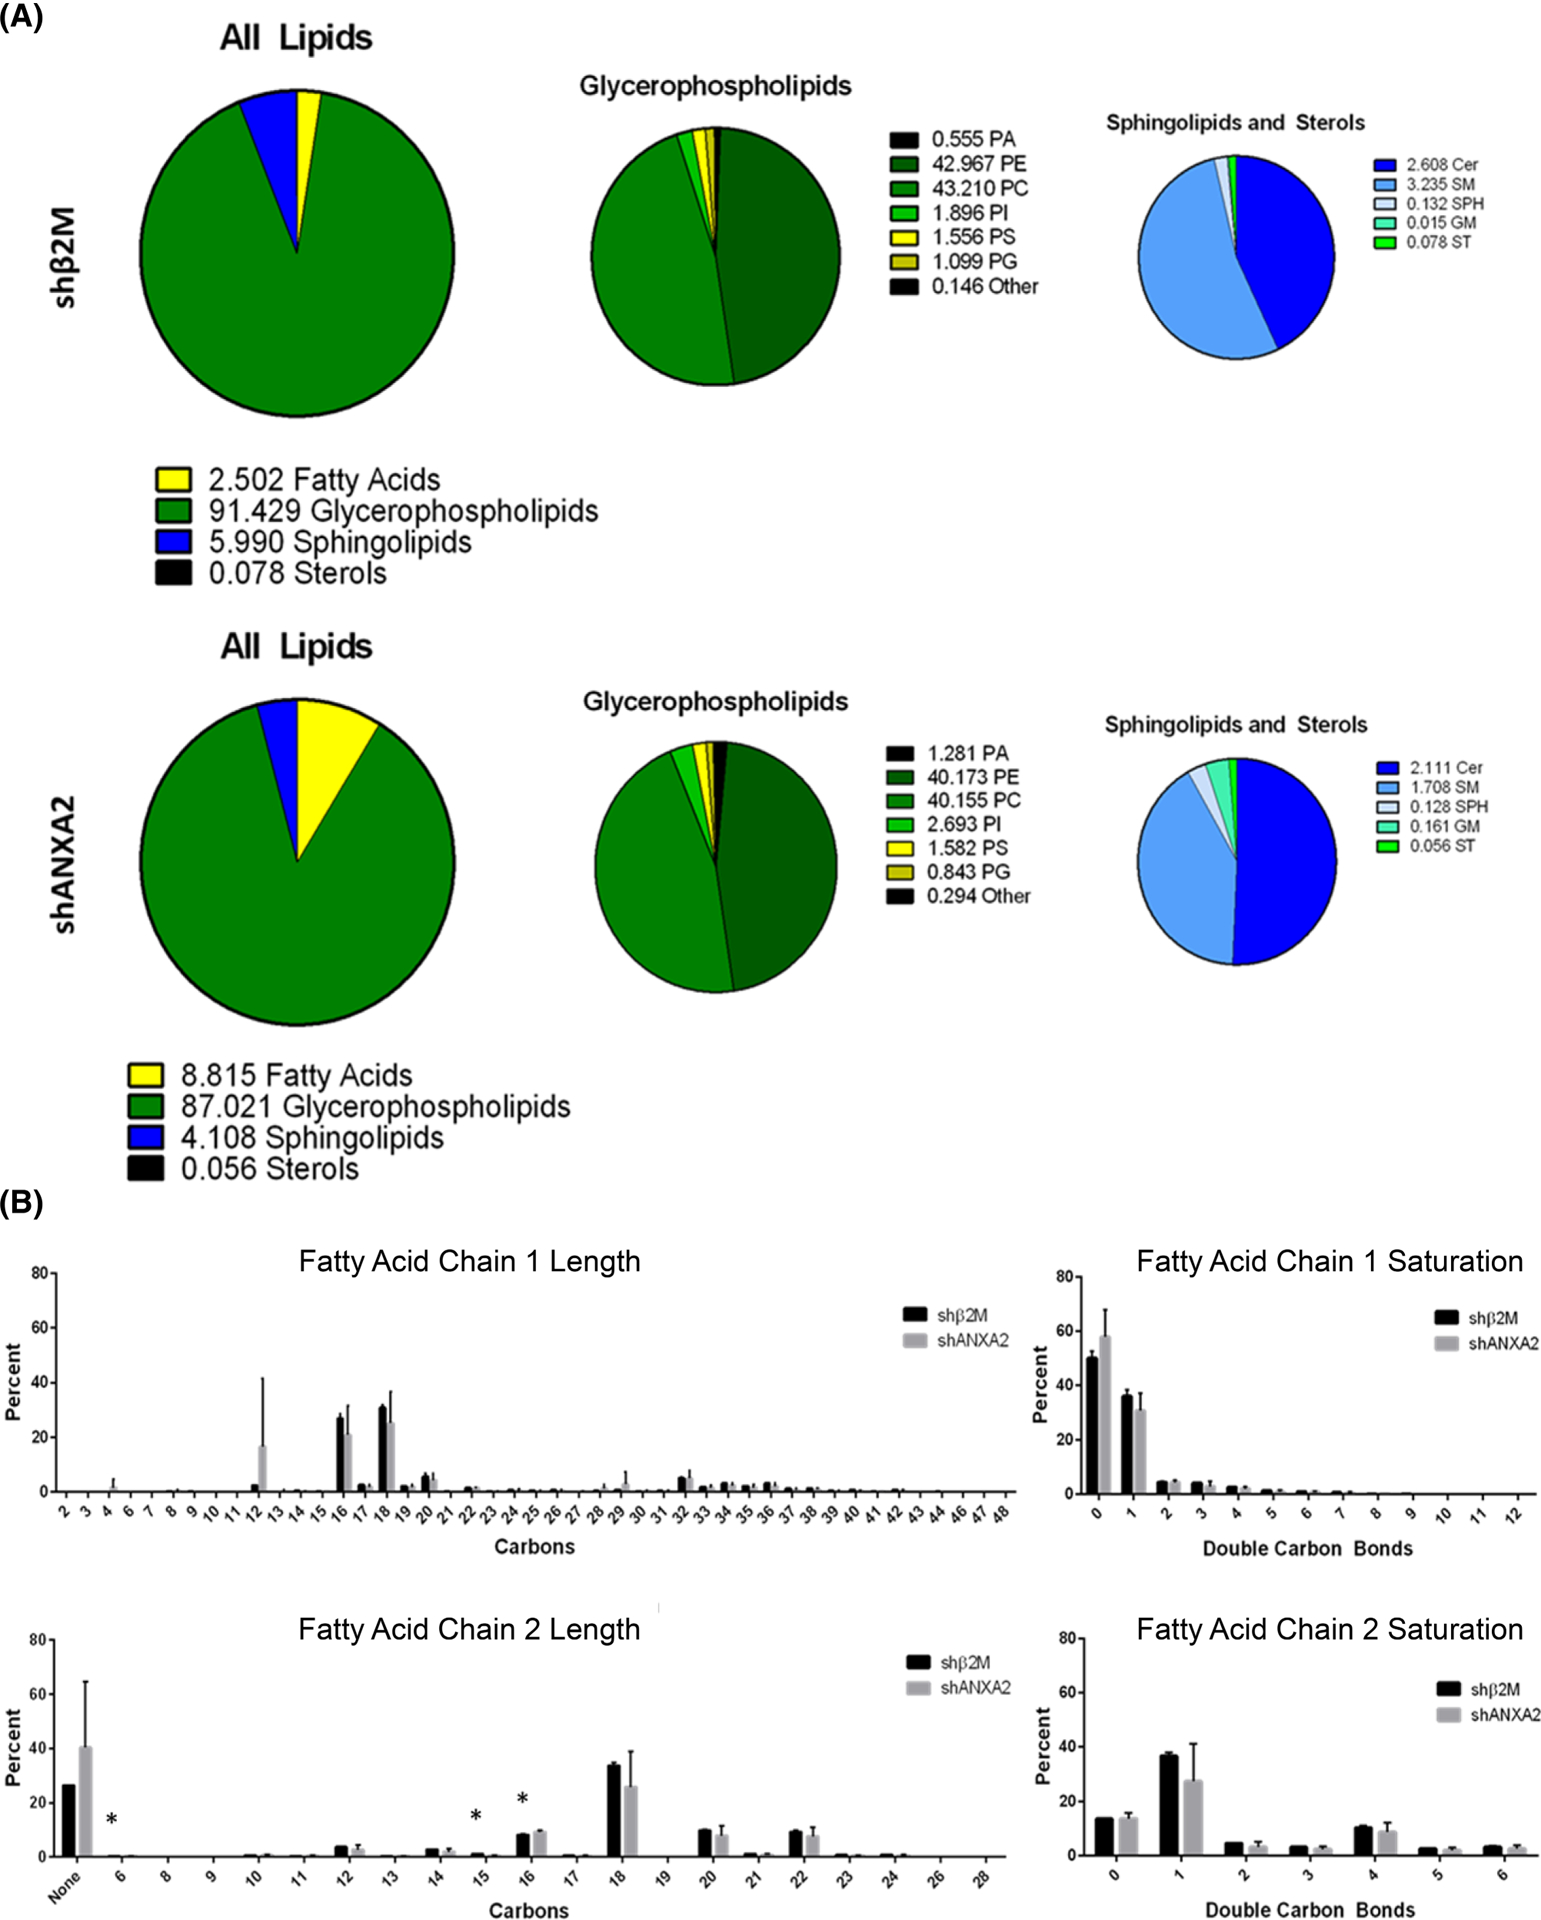
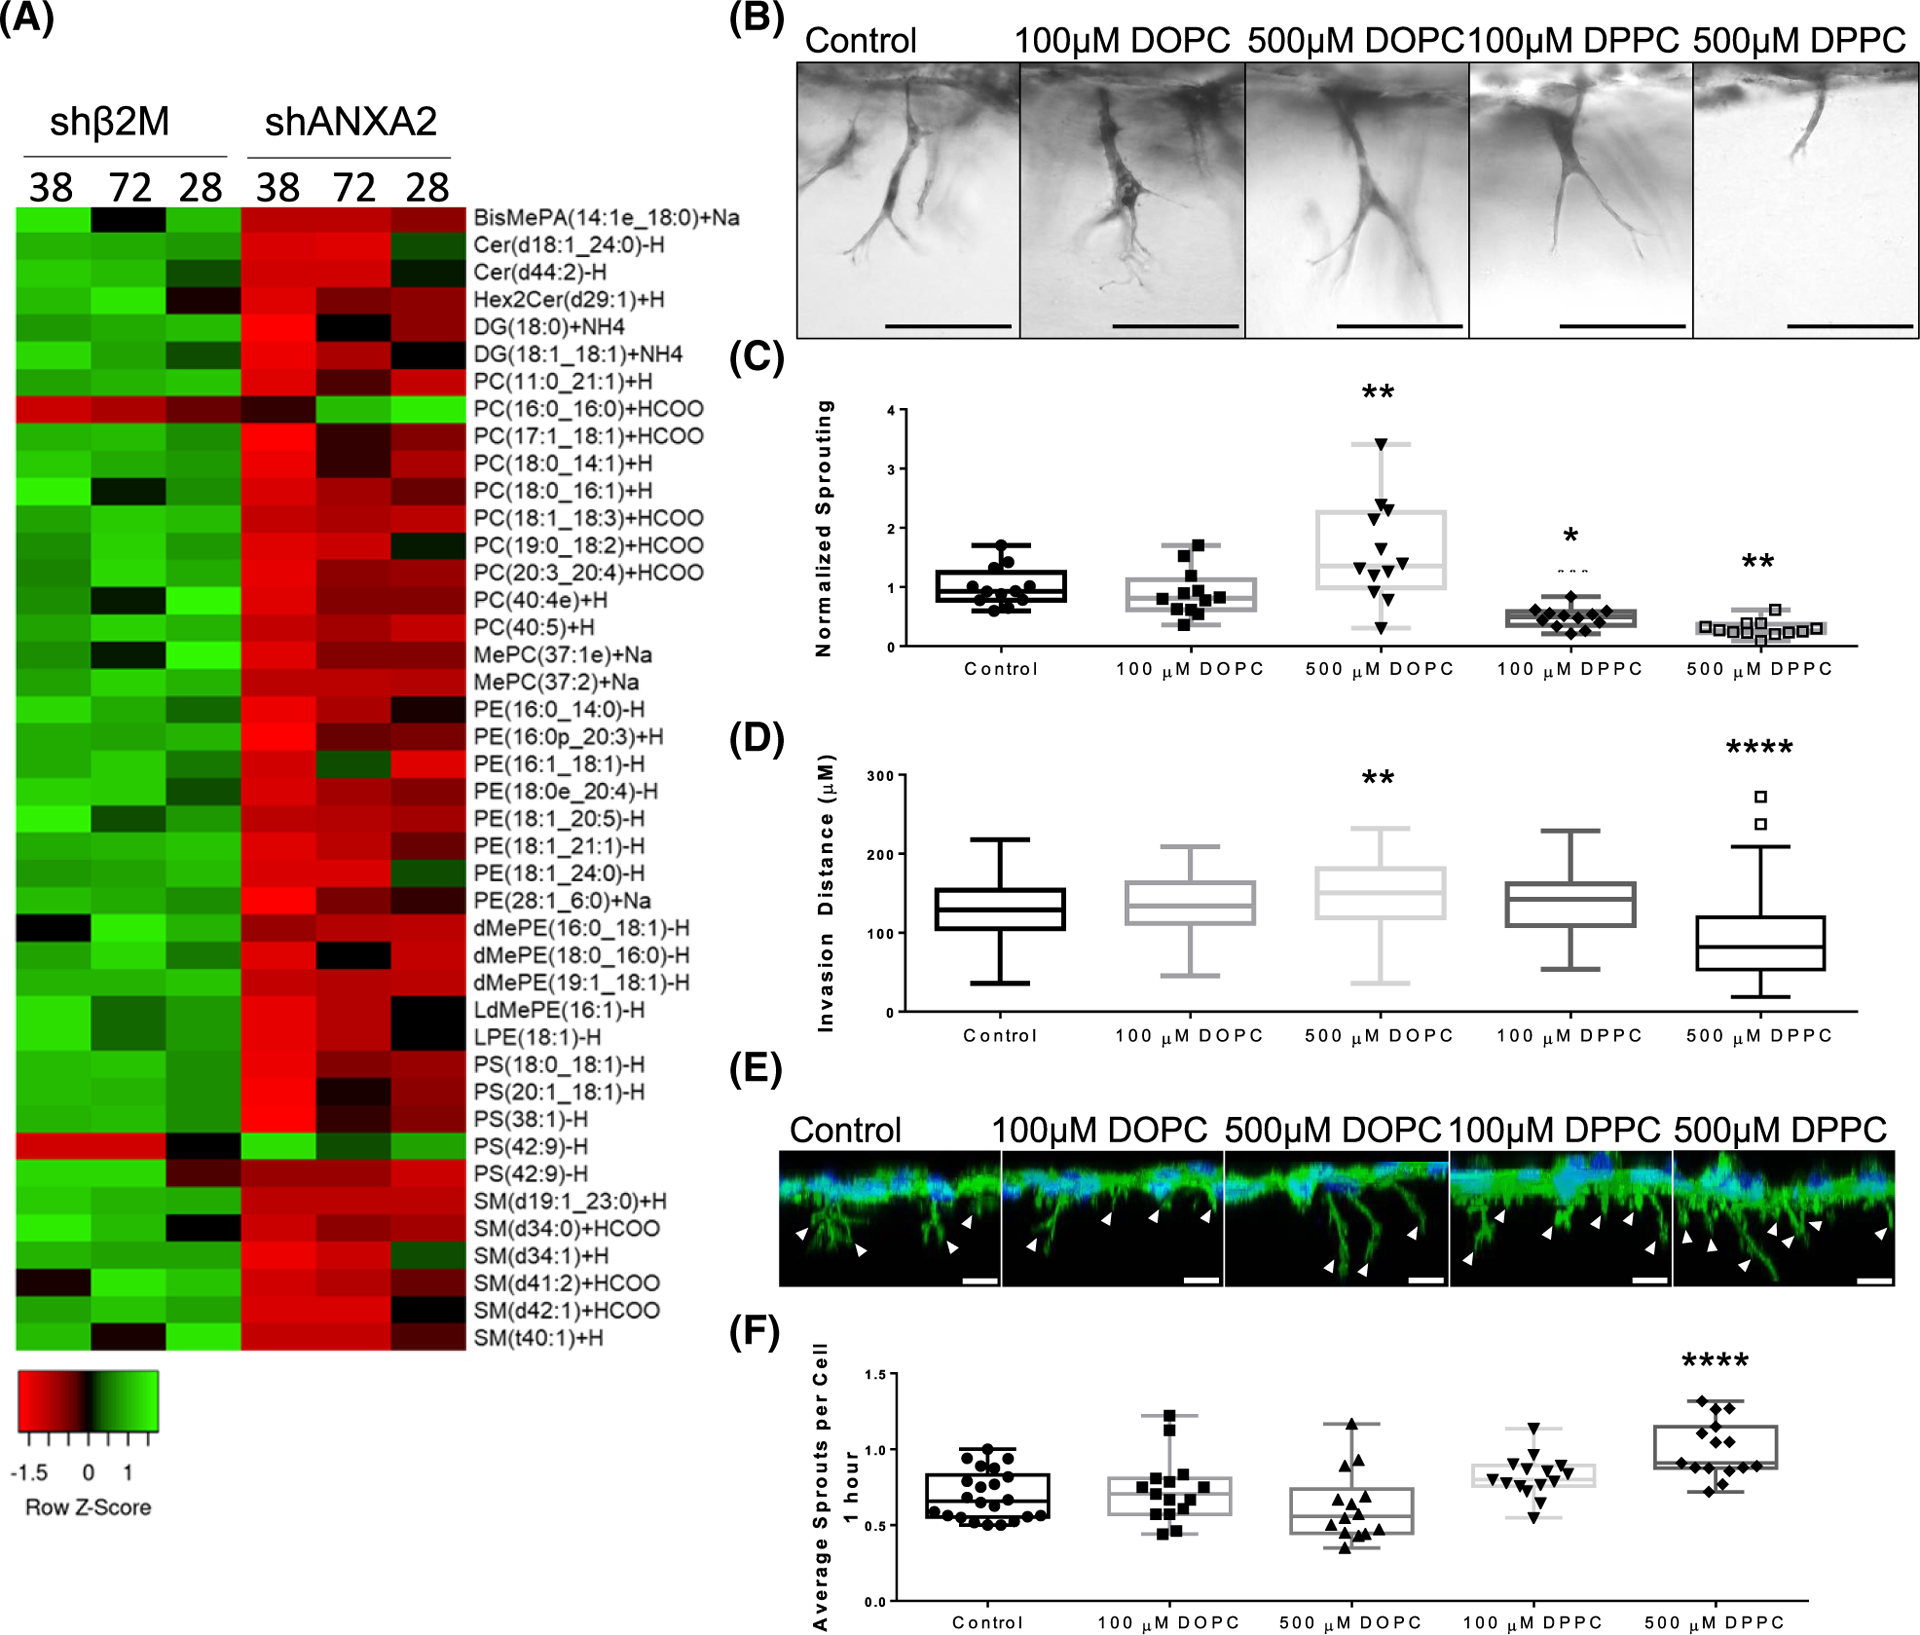
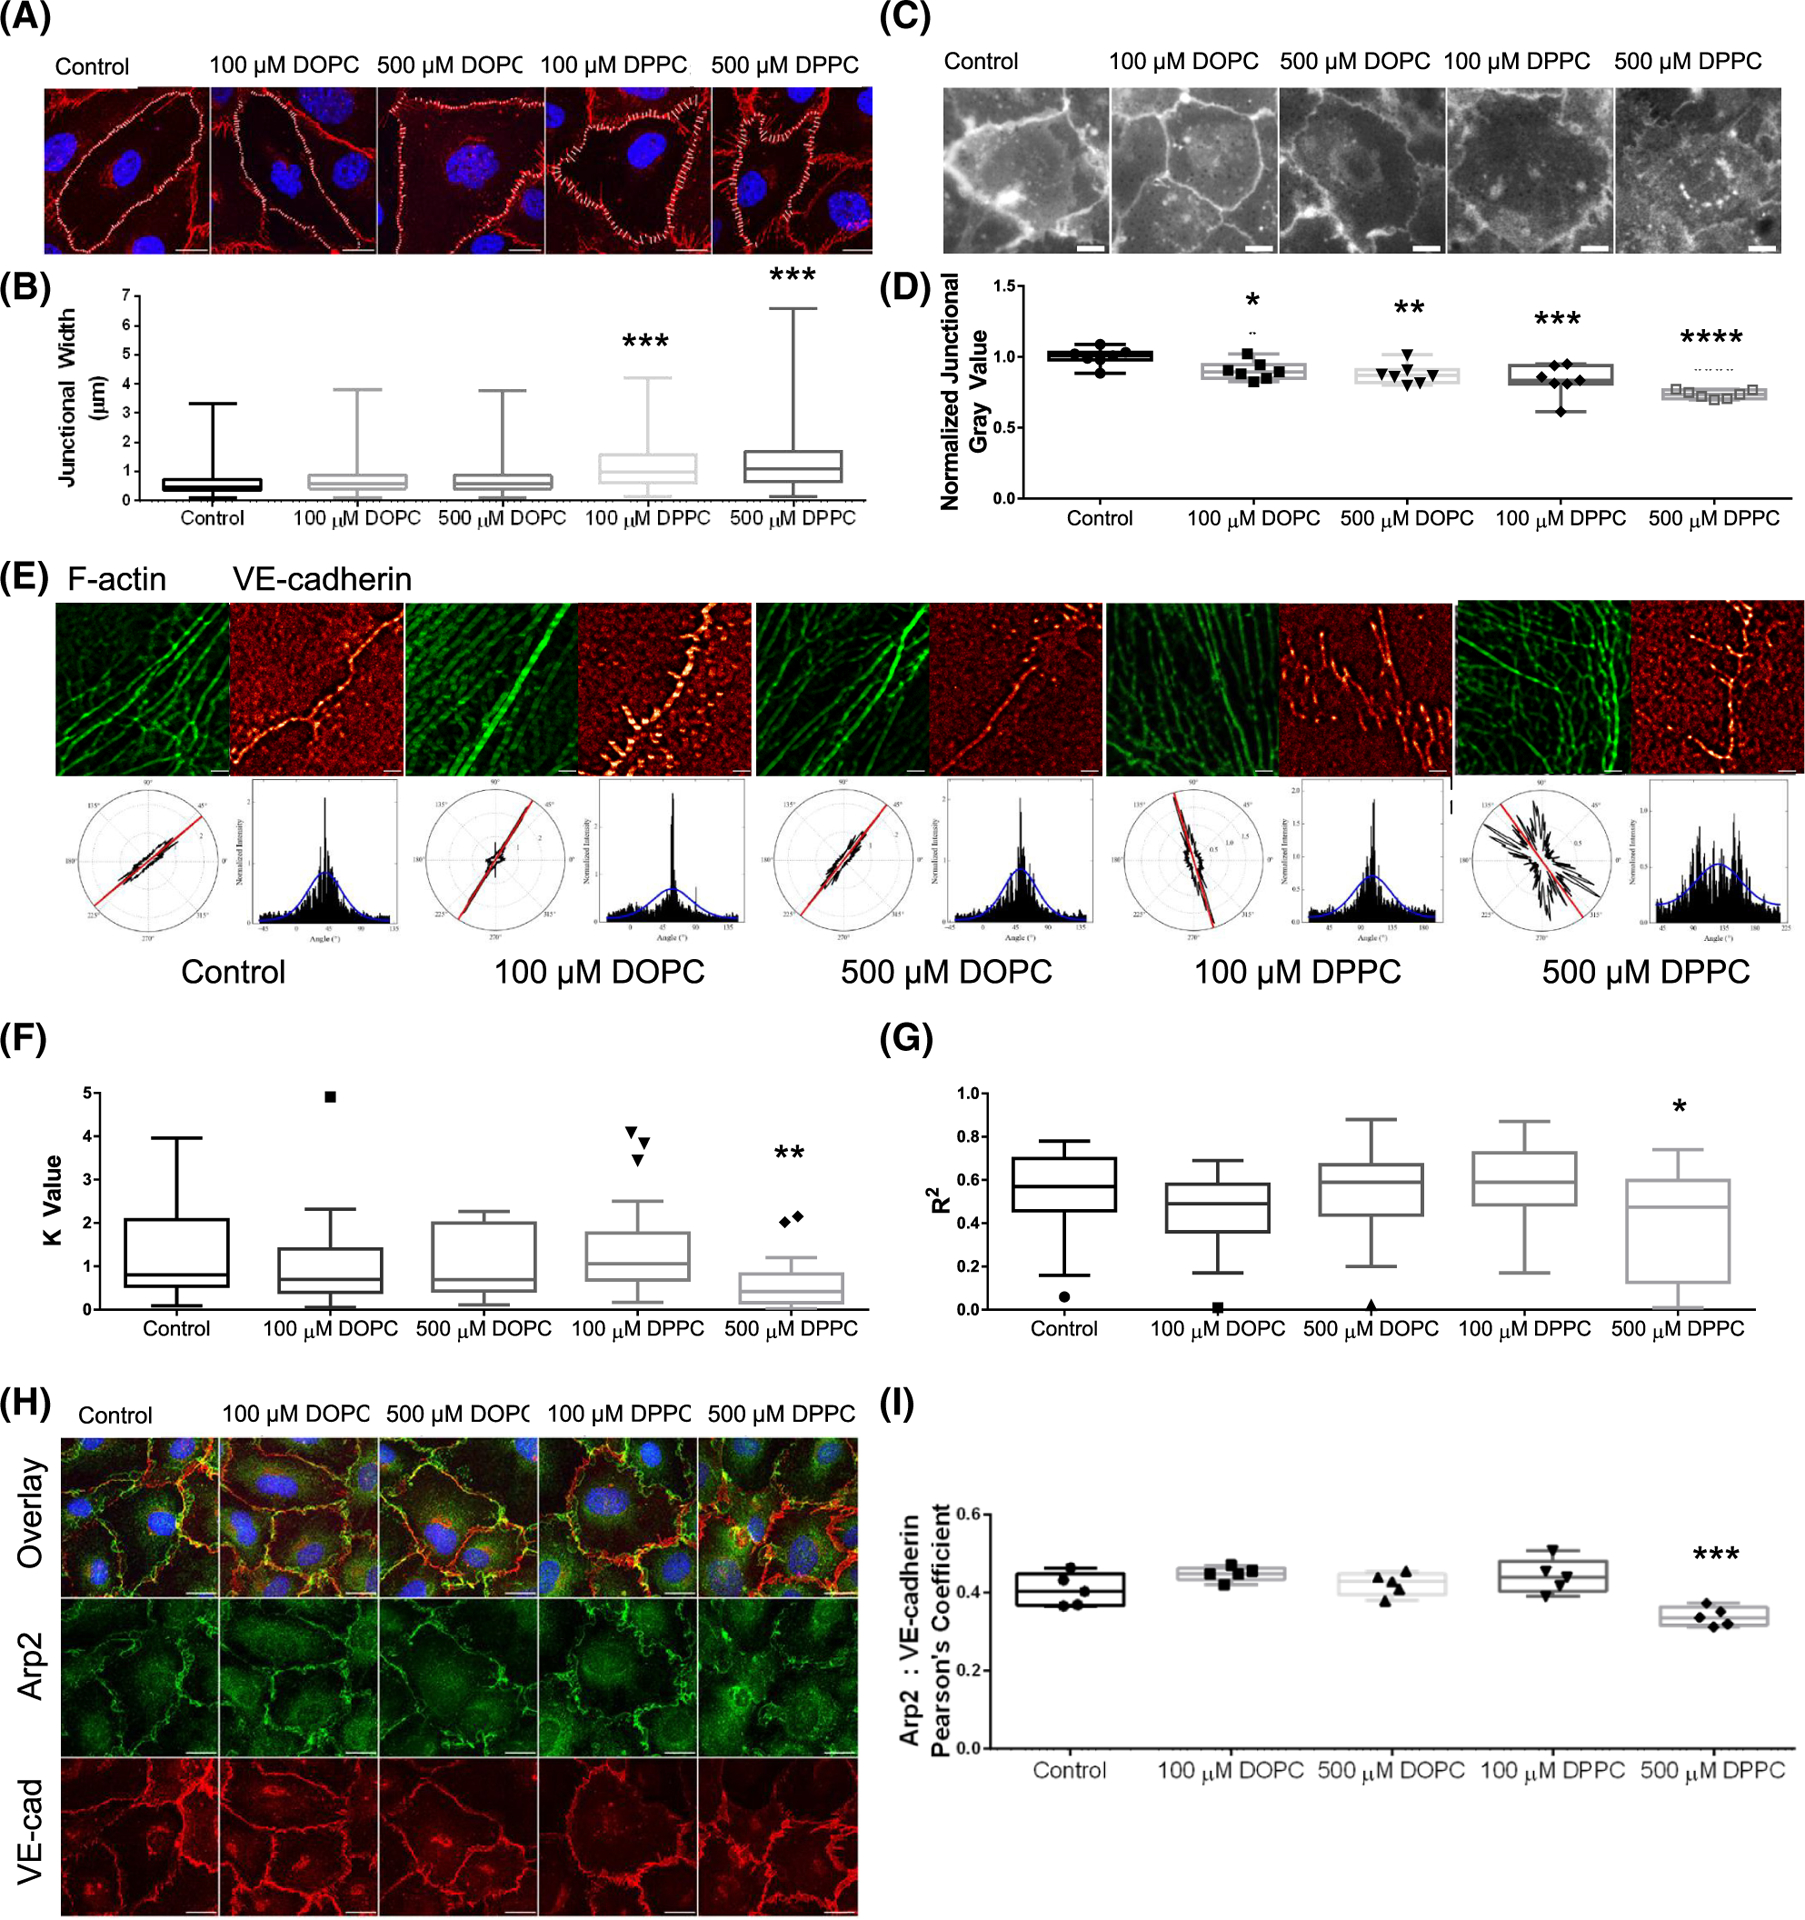
The intersection of protein and lipid biology is of growing importance for understanding how cells address structural challenges during adhesion and migration. While protein complexes engaged with the cytoskeleton play a vital role, support from the phospholipid membrane is crucial for directing localization and assembly of key protein complexes. During angiogenesis, dramatic cellular remodeling is necessary for endothelial cells to shift from a stable monolayer to invasive structures. However, the molecular dynamics between lipids and proteins during endothelial invasion are not defined. Here, we utilized cell culture, immunofluorescence, and lipidomic analyses to identify a novel role for the membrane binding protein Annexin A2 (ANXA2) in modulating the composition of specific membrane lipids necessary for cortical F-actin organization and adherens junction stabilization. In the absence of ANXA2, there is disorganized cortical F-actin, reduced junctional Arp2, excess sprout initiation, and ultimately failed sprout maturation. Furthermore, we observed reduced filipin III labeling of membrane cholesterol in cells with reduced ANXA2, suggesting there is an alteration in phospholipid membrane dynamics. Lipidomic analyses revealed that 42 lipid species were altered with loss of ANXA2, including an accumulation of phosphatidylcholine (16:0_16:0). We found that supplementation of phosphatidylcholine (16:0_16:0) in wild-type endothelial cells mimicked the ANXA2 knock-down phenotype, indicating that ANXA2 regulated the phospholipid membrane upstream of Arp2 recruitment and organization of cortical F-actin. Altogether, these data indicate a novel role for ANXA2 in coordinating events at endothelial junctions needed to initiate sprouting and show that proper lipid modulation is a critical component of these events.

Keywords: Annexin A2; actin-related protein 2; adherens junctions; cholesterol; cytoskeleton; endothelial cells; lipidomics; membrane lipids; phosphatidylcholines; phospholipids.


Conflict of interest statement

DISCLOSURES

The authors have no competing interests in this work, financial or otherwise.

Figures

FIGURE 1
FIGURE 1
ANXA2 knock-down results in excess sprout initiation, but failed maturation. (A) Representative side views of shβ2M and shANXA2 human umbilical vein endothelial cell (HUVEC) on collagen matrices after 1 h with sphingosine 1-phosphate (S1P) + growth factors (GFs). Arrowheads denote F-Actin positive (green) processes entering the matrix. Cell nuclei are labeled with DAPI (blue). Scale bar: 10 μm. (B) Average number of initiating sprouts per cell at 1 h for fields of equal cell density. Student’s t-test, ****p < .0001. n = 15, 40× fields per treatment. Representative side views of (C) shβ2M and (D) shANXA2 HUVEC on collagen matrices after 1, 5, 10, or 20 h of invasion with S1P + GFs. Samples were stained for nuclei with DAPI (blue), F-Actin (green), VE-cadherin (red), and Arp2 (purple). Scale bar: 10 μm. (E) Quantified average cell count per invading structure after 20 h. Student’s t-test, *p = .0104. n = 25 sprout structures. shANXA2 cells fail to incorporate into multicellular structures that possess stabilized, linear junctions as labeled by VE-cadherin. (F) Western blot of ANXA2, β2M, and Zyxin (loading control). (G) Normalized signal of ANXA2 and β2M from western blots of three independent experiments as confirmation of knock-down. Error bar denotes standard deviation. All experiments repeated three times with representative data shown in panels (A–F).
FIGURE 2
FIGURE 2
Endothelial sprout initiation favors junctions. (A) Top view of human umbilical vein endothelial cell (HUVEC) seeded on collagen matrices, activated with S1P for 1 h, then vascular endothelial growth factor (VEGF) and basic fibroblast growth factor (bFGF) for an additional hour. Cells were labeled for F-Actin (green), VE-cadherin (red). Nuclei stained with DAPI (blue). (B) Side view of 3D reconstruction from the Z-stack shown in A. White arrowheads denote origin points of sprouts. Scale bars: 10 μm. (C) Bar graph of average sprout origins (percent) of three independent experiments, +/− standard deviation. Student’s t-test: **p = .0036, n = 375 sprouts total.
FIGURE 3
FIGURE 3
ANXA2 knock-down results in disorder of Actin fibers at junctions following sphingosine 1-phosphate (S1P) treatment. (A) Whole field of shβ2M and shANXA2 cells on coverslips following 1 h S1P treatment, labeled for VE-cadherin (red) and F-Actin (green). White boxes denote ROIs chosen for analysis in FiberFit Software. Scale bar: 10 μm. (B) Example ROIs that were loaded into FiberFit Software with corresponding VE-cadherin channel as reference (only F-Actin channel was analyzed). Lower left panel denotes radial graph of F-Actin signal. Lower right graph is the radial graph plotted as a histogram. Blue line denotes Gaussian curve. Scale bar: 1 μm. (C) Averaged results from B. Graph shows the relative degree of order, quantified as K value. n = 3 fields, at least 12 junctions per treatment. **p = .002, Student’s t-test. (D) Graph shows fit to normal curve, reflecting average fit of the blue line in B. **p = .0053, Student’s t-test. All experiments independently repeated at least three times with representative data shown.
FIGURE 4
FIGURE 4
Junctional localization of Arp2, α-actinin 1, and Vinculin with ANXA2 knock-down. In all experiments, shβ2M and shANXA2 cells seeded on coverslips received 1 h sphingosine 1-phosphate (S1P) treatment prior to analysis. (A) Cells were labeled for Arp2 (green), VE-cadherin (red), and DAPI (blue). (B) Quantified colocalization between Arp2 and VE-cadherin as measured by Pearson’s Coefficient. N = 4 fields per treatment; Student’s t-test: *p = .0197. (C) Cells were then labeled for α-actinin 1 (green), VE-cadherin (red), and DAPI (blue). (D) Pearson’s Coefficient as quantification of colocalization between α-actinin 1 and VE-cadherin. N = 3 fields per treatment; Student’s t-test: NS = not significant. (E) Cells were labeled for Arp2 (green), VE-cadherin (red), and DAPI (blue). (F) Colocalization of Vinculin and VE-cadherin, measured by Pearson’s Coefficient. N = 5 fields per treatment; Student’s t-test: NS = not significant. Scale bars: 10 μm. All experiments repeated independently three times with representative data shown.
FIGURE 5
FIGURE 5
Arp2 is required for sprout maturation in 3D collagen matrices but does not affect sprout initiation. (A) Top view of sprouts in collagen matrices after 21 h. Scale bar: 100 μm. (B) Quantified sprouts per field; n = 4 fields per group. Student’s t-test: ****p < .0001. (C) Western confirmation of Arp2 and β2M knock-down, along with Zyxin loading control. (D) Side view of sprouts in collagen matrices after 21 h. Scale bar: 100 μm. (E) Quantified invasion distance. n = 100 sprouts per group; Student’s t-test: ****p < .0001. (F) Relative protein expression of Arp2 and β2M from western blots of three independent experiments. (G) 3D reconstructed Z-stack of F-Actin (green) in shβ2M or shArp2 cells after 1 h invasion. Nuclei were counterstained with DAPI (blue). Arrowheads denote initiating processes. (H) Average number of sprouts per cell after 1 h. n = 15 fields per treatment. Student’s t-test: p > .05, NS, not significant. (I) Immunofluorescence labeling of F-Actin (green), VE-cadherin (VE-cad; red), and DAPI (blue) in shβ2M and shArp2 cells after overnight invasion. Scale bar = 10 μm. (J) Average number of cells per invading structure at 20 h. n ≥ 35 sprouts per treatment; Student’s t-test: ***p = .0003.
FIGURE 6
FIGURE 6
Loss of Arp2 does not impact organization of cortical F-Actin or localization of ANXA2. (A) Immunofluorescence of shβ2M and shArp2 cells on coverslips, labeled for F-Actin (green) and VE-cadherin (red). Scale bar: 10 μm. (B) Example output from FiberFit analysis. Scale bar: 1 μm. (C) Quantified order of cortical F-Actin from FiberFit. n = 17 junctional regions of interest from at least three fields per treatment. Student’s t-test: p > .05, NS, not significant. (D) Quantified Gaussian distribution of cortical F-Actin from FiberFit. n = 17 junctional regions of interest from at least three fields per treatment. Student’s t-test: p > .05, NS, not significant. (E) Immunofluorescence of ANXA2 (green), VE-cadherin (red), and DAPI (blue) after 1 h of S1P activation. Scale bar: 10 μm. (F) Quantified colocalization between ANXA2 and VE-cadherin in shβ2M and shArp2 cells. Student’s t-test: p > .05, NS, not significant. All experiments were performed three times, and representative results are shown.
FIGURE 7
FIGURE 7
Loss of ANXA2 impairs filipin III labeling of cholesterol within intact membranes, without reducing total cholesterol. (A) shβ2M and shANXA2 cells on coverslips after 1 h of sphingosine 1-phosphate (S1P) treatment, stained with filipin III with or without permeabilization. (B) Quantified junctional filipin III signal in shβ2M and shANXA2 without permeabilization. Student’s t-test, ***p = .0004. n ≥ 6 fields per treatment. (C) Quantified whole field filipin III signal in cells with permeabilization. Student’s t-test, p > .05, NS = not significant. n = 6 fields per treatment. The Amplex-Red assay was used to quantify ng of (D) Total Cholesterol (E) Free Cholesterol, and (F) Cholesterol Esters. Cholesterol levels were normalized relative to μg protein for non-treated control, shB2M, and shANXA2 human umbilical vein endothelial cell (HUVEC). Statistical significance was determined using the Mann–Whitney test. NS, not significant.
FIGURE 8
FIGURE 8
Overview of lipid profile in shβ2M versus shANXA2 cells. (A) Breakdown of total lipid profile by lipid class, averaged between three independent lots of primary human umbilical vein endothelial cell (HUVEC; 28, 38, and 72). No significance detected according to Student’s t-test across the three cell lots. (B) Breakdown of acyl chain length and saturation with loss of ANXA2. Data shown are averaged between three cell lots. Error bars represent standard deviation. Student’s t-test: *p = .021, .027, and .033 for 6, 15, and 16 carbons on sn-2, respectively. Very long chains (>28 carbons) likely include both sn-1 and sn-2 chains, which liquid chromatography–mass spectrometry (LC–MS) could not identify at higher resolution under the given parameters.
FIGURE 9
FIGURE 9
Supplementation with PC (16:0_16:0) (DPPC) impairs sprouting. (A) Heat map of lipid species altered by loss of ANXA2 in three independent lots of primary human umbilical vein endothelial cell (HUVEC; 38, 72, and 28). (B) Side view of invasion after 21 h while supplemented with DPPC or dioleoylphosphatidylcholine (DOPC). (C) Sprouting density normalized to the average control density. ANOVA, Dunnett’s multiple comparisons: **p = .0088, *p = .0241, **p = .0013 versus Control. n = 12 fields per treatment across three independent experiments. (D) Quantified average invasion distance with lipid supplementation. ANOVA, Dunnett’s multiple comparisons: **p = .0067, ****p < .0001 versus Control. n = 100 sprouts per treatment. (E) 3D reconstruction from Z-stack of HUVEC after 1 h of invasion. F-Actin (green) and DAPI (blue) was used to reveal initiating sprouts, denoted by white arrowheads. Scale bar: 10 μm. (F) Quantified initiating sprouts per cell after 1 h. ANOVA, Dunnett’s multiple comparisons: ****p < .0001 versus Control. Experiments were repeated independently at least three times with representative data shown.
FIGURE 10
FIGURE 10
Supplementation with dipalmitoylphosphatidylcholine (DPPC) negatively alters junctional organization. (A) VE-cadherin signal of wild-type cells on coverslips after overnight treatment with DPPC and dioleoylphosphatidylcholine (DOPC), then treated with sphingosine 1-phosphate (S1P) for 1 h. Cells were stained with VE-cadherin (red) and DAPI (blue). Scale bar: 10 μm. (B) Average junctional width from A. ANOVA, Dunnett’s multiple comparisons: ***p = .0009, .0001 for 100 and 500 μM DPPC, respectively versus Control. n = 4 fields per treatment. (C) Filipin III signal of HUVEC after lipid supplementation overnight and 1 h S1P treatment. Scale bar: 10 μm. (D) Average junctional gray value per field, normalized to the control. ANOVA, Dunnett’s multiple comparisons: *p = .0483, **p = .0093, ***p = .0002, ****p < .0001 versus Control. n = 7 fields per treatment. (E) FiberFit analysis of human umbilical vein endothelial cell (HUVEC) seeded on coverslips overnight with DPPC or DOPC treatment, followed by 1 h S1P treatment. (F) K value of F-Actin organization from FiberFit. ANOVA, Dunnett’s multiple comparisons: **p = .0048. n = 20 ROIs from 4 fields per treatment. (G) R2 value of F-Actin distribution from FiberFit. ANOVA, Dunnett’s multiple comparisons: *p = .0272. n = 20 ROIs from 4 fields per treatment. (H) Immunofluorescence staining of Arp2 (green), VE-cadherin (VE-cad; red), and DAPI (blue) localization after overnight lipid supplementation and 1 h S1P treatment. Scale bar: 10 μm. (I) Quantified colocalization between Arp2 and VE-cadherin using Pearson’s Coefficient. ANOVA, Dunnett’s multiple comparisons: ***p = .0003 versus Control. n = 5 fields per treatment. All experiments were repeated independently at least three times with representative data shown.

References

    1. Giannotta M, Trani M, Dejana E. VE-cadherin and endothelial adherens junctions: active guardians of vascular integrity. Dev Cell. 2013;26(5):441–454. doi:10.1016/j.devcel.2013.08.020 - DOI - PubMed
    1. Fonseca CG, Barbacena P, Franco CA. Endothelial cells on the move: dynamics in vascular morphogenesis and disease. Vasc Biol. 2020;2(1):H29–H43. doi:10.1530/vb-20-0007 - DOI - PMC - PubMed
    1. Carmeliet P, Jain RK. Molecular mechanisms and clinical applications of angiogenesis. Nature. 2011;473(7347):298–307. doi:10.1038/nature10144 - DOI - PMC - PubMed
    1. Dejana E, Vestweber D. Chapter six—the role of VE-cadherin in vascular morphogenesis and permeability control. In: van Roy F, ed. The Molecular Biology of Cadherins. Vol 116. Academic Press; 2013:119–144. doi:10.1016/B978-0-12-394311-8.00006-6 - DOI - PubMed
    1. Duran CL, Howell DW, Dave JM, et al. Molecular regulation of sprouting angiogenesis. Compr Physiol. 2018;8(1):153–235. doi:10.1002/cphy.c160048 - DOI - PubMed

Publication types

LinkOut - more resources