. 2023 Feb:203:108158.
doi: 10.1016/j.visres.2022.108158. Epub 2022 Dec 15.

Consistency of preferred retinal locus across tasks and participants trained with a simulated scotoma

Affiliations

Consistency of preferred retinal locus across tasks and participants trained with a simulated scotoma

Marcello Maniglia et al. Vision Res. 2023 Feb.

Abstract

After loss of central vision following retinal pathologies such as macular degeneration (MD), patients often adopt compensatory strategies including developing a "preferred retinal locus" (PRL) to replace the fovea in tasks involving fixation. A key question is whether patients develop multi-purpose PRLs or whether their oculomotor strategies adapt to the demands of the task. While most MD patients develop a PRL, clinical evidence suggests that patients may develop multiple PRLs and switch between them according to the task at hand. To understand this, we examined a model of central vision loss in normally seeing individuals and tested whether they used the same or different PRLs across tasks after training. Nineteen participants trained for 10 sessions on contrast detection while in conditions of gaze-contingent, simulated central vision loss. Before and after training, peripheral looking strategies were evaluated during tasks measuring visual acuity, reading abilities and visual search. To quantify strategies in these disparate, naturalistic tasks, we measured and compared the amount of task-relevant information at each of 8 equally spaced, peripheral locations, while participants performed the tasks. Results showed that some participants used consistent viewing strategies across tasks whereas other participants' strategies differed depending on task. This novel method allows quantification of peripheral vision use even in relatively ecological tasks. These results represent one of the first examinations of peripheral viewing strategies across tasks in simulated vision loss. Results suggest that individual differences in peripheral looking strategies following simulated central vision loss may model those developed in pathological vision loss.

Keywords: Central vision loss; Eye movements; Macular Degeneration; Peripheral vision.


Conflict of interest statement

Declaration of Competing Interest The authors declare that they have no known competing financial interests or personal relationships that could have appeared to influence the work reported in this paper.

Figures

Figure 1:
Figure 1:. Layout of the study:
each participant underwent 14 sessions, structured as follows: two sessions of PRL induction, one session of pre-tests, 10 training sessions and one session of post-tests.
Figure 2:
Figure 2:. Training types:
examples of two trials for each type of training. During SPL (top), the target always appeared in the center of the screen. During CAT (bottom), the target could appear anywhere on the screen, accompanied by an auditory cue (whose pitch and inter-aural time difference would indicate its position on the screen), and a visual cue (bright circle, left, or dim circle, right). During both training types, a gaze contingent simulated scotoma of 10° diameter would obstruct participant’s central vision in real time (exemplified here by the different position of the scotoma on the screen).
Figure 3:
Figure 3:
A: visual space divided into 8 radially distributed candidate PRL locations outside the simulated scotoma B: Example of the analysis for a frame during the MNRead task, in which mostly upper PRLs are used to see the stimuli. In this case, the amount of target information (number of ‘target pixels’) within each region would be skewed towards PRL 1, 2 and 8, and to lesser extent to 3 and 7. No target pixels fall within the remaining PRLs. C: same as B but an example where mostly left PRLs have target information. D: proportional distribution of target pixels (percentage of total target pixels) within each of the 8 regions for a full session of MNRead. In this example the analysis shows that for this participant most of the target elements (i.e., the words in the MNRead) were observed through regions 3 and 7, corresponding to areas to the left and to the right of the scotoma.
Figure 4:
Figure 4:
Polar graph representing the average PRL location (radial axis representing the % of use of each PRL per session) during MNread (red), visual search (green) and visual acuity (blue) after contrast detection training in conditions of simulated scotoma. Error bars represent SEM.
Figure 5:
Figure 5:
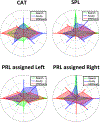
Above: Polar graph representing the average PRL location during MNread (red), visual search (green) and visual acuity (blue) after CAT and SPL training (left and right, respectively). Below: average PRL location during MNread (red), visual search (green) and visual acuity (blue) for participants that underwent PRL induction with Assigned PRL to the left and to the right. Error bars represent SEM.
Figure 6:
Figure 6:
Individual participant data for the PRL use across tasks, divided by induction (assigned vs annulus) and training (CAT vs SPL) condition

References

    1. Abrams J, Nizam A, & Carrasco M (2012). Isoeccentric locations are not equivalent: The extent of the vertical meridian asymmetry. Vision Research, 52(1). 10.1016/j.visres.2011.10.016 - DOI - PMC - PubMed
    1. Afraz A, Pashkam MV, & Cavanagh P (2010). Spatial heterogeneity in the perception of face and form attributes. Current Biology, 20(23). 10.1016/j.cub.2010.11.017 - DOI - PMC - PubMed
    1. Altpeter E, Mackeben M, & Trauzettel-Klosinski S (2000). The importance of sustained attention for patients with maculopathies. In Vision Research (Vol. 40, pp. 1539–1547). 10.1016/S0042-6989(00)00059-6 - DOI - PubMed
    1. Baldwin AS, Meese TS, & Baker DH (2012). The attenuation surface for contrast sensitivity has the form of a witch’s hat within the central visual field. Journal of Vision, 12(11). 10.1167/12.11.23 - DOI - PubMed
    1. Barbot A, Xue S, & Carrasco M (2021). Asymmetries in visual acuity around the visual field. Journal of Vision, 21(1). 10.1167/JOV.21.1.2 - DOI - PMC - PubMed

Publication types