. 2023 Jan 9;33(1):86-97.e10.
doi: 10.1016/j.cub.2022.11.042. Epub 2022 Dec 16.

Genetic architecture and evolution of color variation in American black bears

Affiliations

Genetic architecture and evolution of color variation in American black bears

Emily E Puckett et al. Curr Biol. .

Abstract

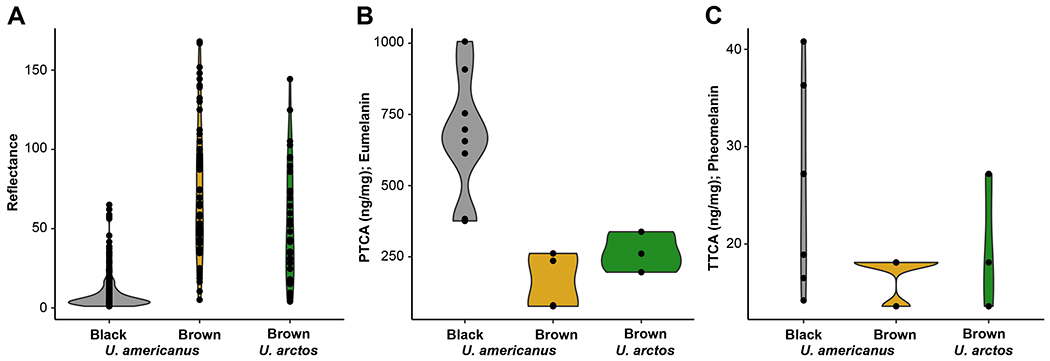
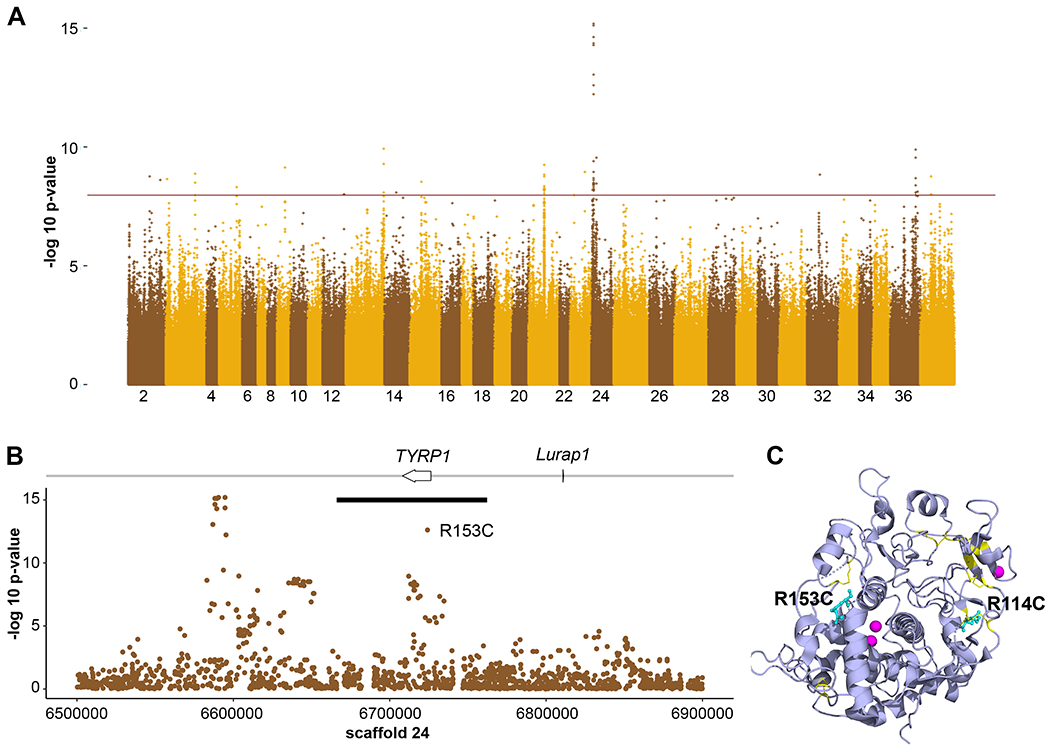
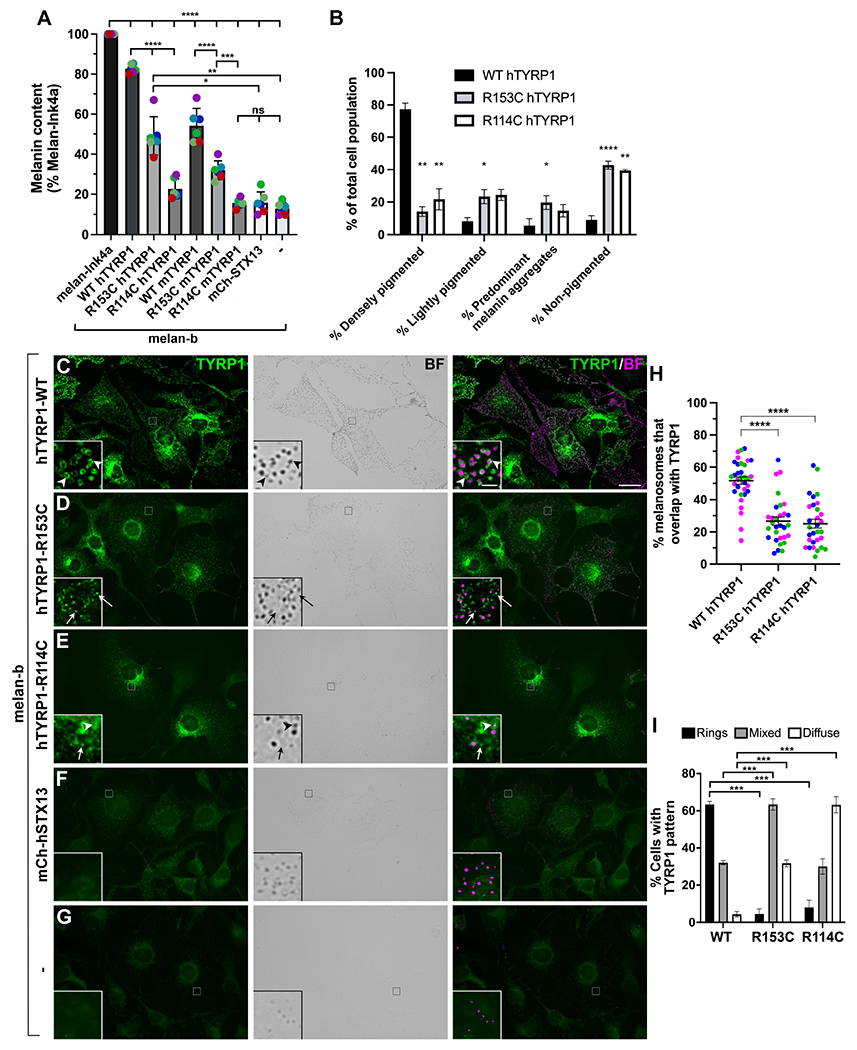
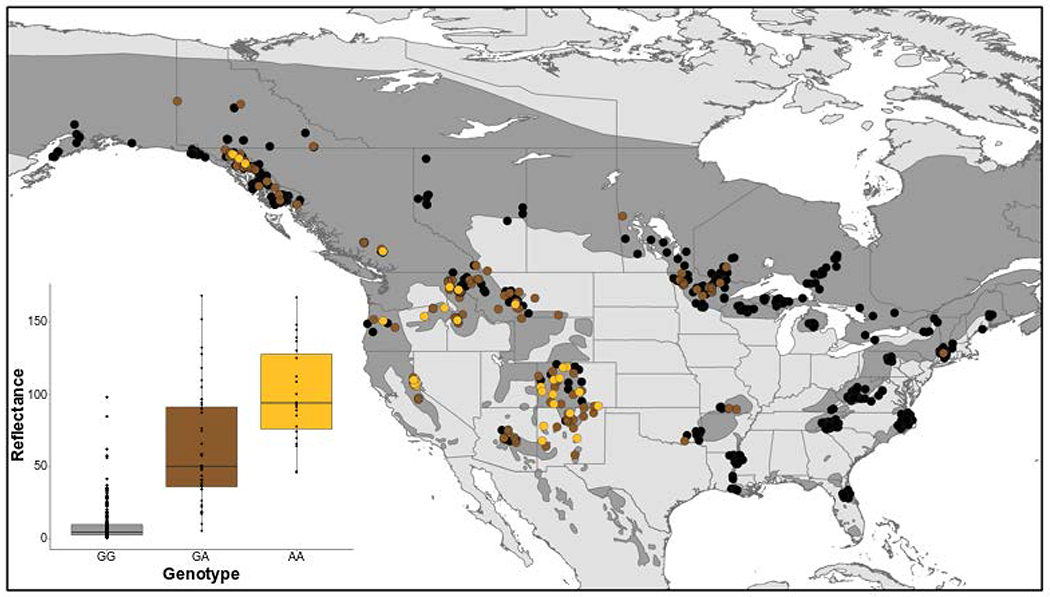
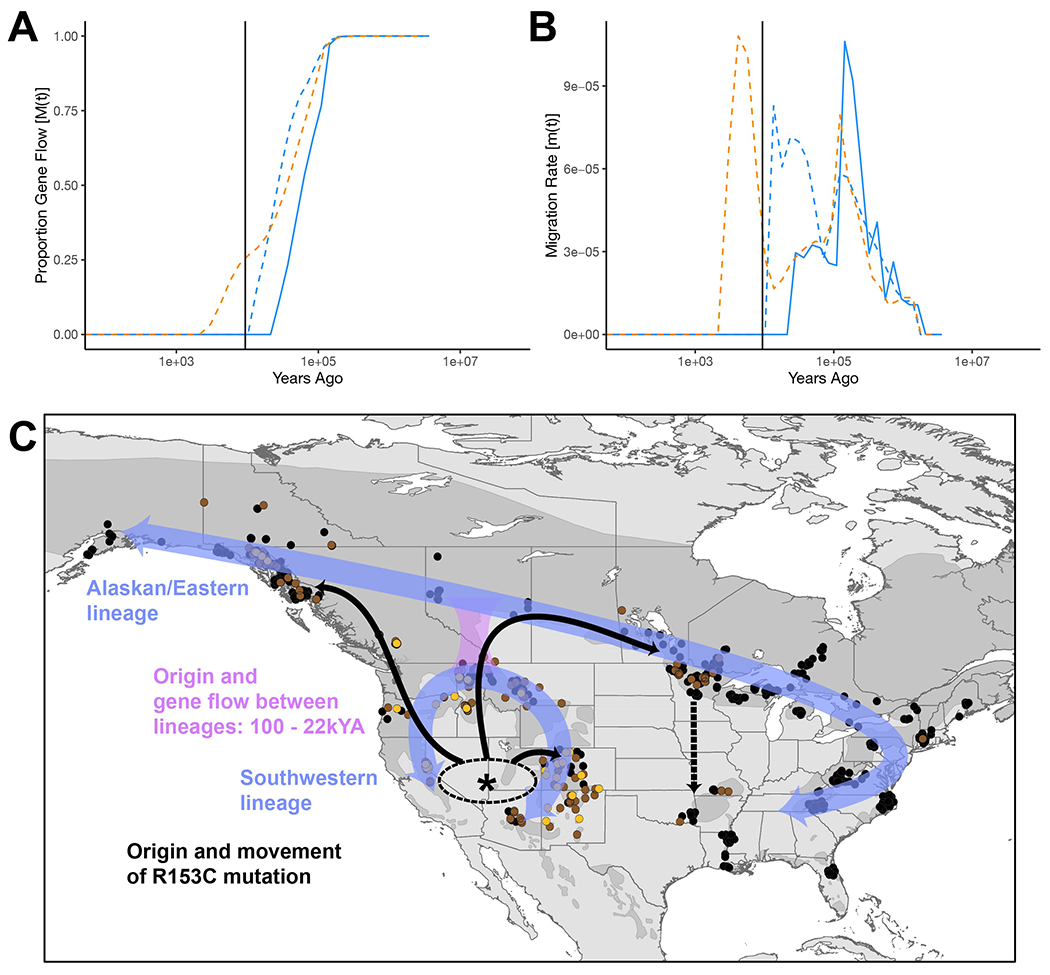
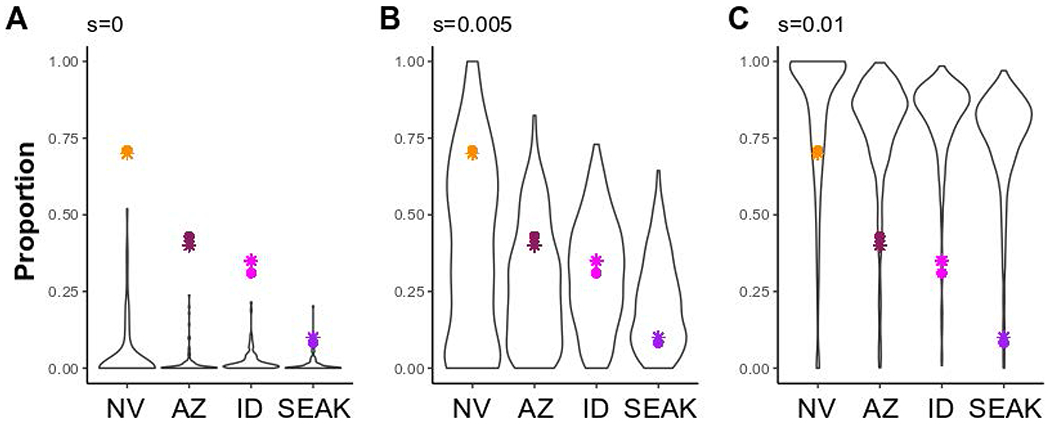
Color variation is a frequent evolutionary substrate for camouflage in small mammals, but the underlying genetics and evolutionary forces that drive color variation in natural populations of large mammals are mostly unexplained. The American black bear, Ursus americanus (U. americanus), exhibits a range of colors including the cinnamon morph, which has a similar color to the brown bear, U. arctos, and is found at high frequency in the American southwest. Reflectance and chemical melanin measurements showed little distinction between U. arctos and cinnamon U. americanus individuals. We used a genome-wide association for hair color as a quantitative trait in 151 U. americanus individuals and identified a single major locus (p < 10-13). Additional genomic and functional studies identified a missense alteration (R153C) in Tyrosinase-related protein 1 (TYRP1) that likely affects binding of the zinc cofactor, impairs protein localization, and results in decreased pigment production. Population genetic analyses and demographic modeling indicated that the R153C variant arose 9.36 kya in a southwestern population where it likely provided a selective advantage, spreading both northwards and eastwards by gene flow. A different TYRP1 allele, R114C, contributes to the characteristic brown color of U. arctos but is not fixed across the range.

Keywords: GWAS; OCA3; TYRP1; functional phylogeography; melan-b; migration.


Conflict of interest statement

Declaration of interests The authors declare no competing interests.

Figures

Figure 1-
Figure 1-. Characterization of bear hair color.
Violin plots of hair reflectance for two bear species (Ursus americanus [n = 327] and U. arctos [n = 33]) categorized by qualitative phenotyping from photos as either black or brown animals (black U. americanus- grey; brown U. americanus- yellow; brown U. arctos- green). Chemical analysis via alkaline hydrogen peroxide oxidation followed by high performance liquid chromatography (HPLC) of 13 U. americanus and three U. arctos individuals’ hair for the concentration of (B) eumelanin (as PTCA; ANOVA F=14.512; P<0.001) or (C) pheomelanin (as TTCA; ANOVA F=2.0297; P=0.17). PTCA concentration in hair ranged from 75–1010 ng mg−1, where TTCA was limited to 13–40 ng mg−1 in U. americanus. Specifically, two-tailed t-tests between U. americanus black and brown animals (P<0.001), and U. americanus black and U. arctos were significantly different (P<0.001); whereas, no difference was observed between species with brown coloration (P=0.17). In U. arctos, PTCA and TTCA ranged respectively from 200–340 ng mg−1 and 13–27 ng mg−1. Both species indicate a dilution of eumelanin, and not an increase in pheomelanin, produces the characteristic hair-lightening.
Figure 2-
Figure 2-. Genome-wide association study of American black bear coat color.
GWAS of both high and low coverage WGS data from Ursus americanus (n = 151) to identify loci associated with coat color. (A) A genome-wide Manhattan plot with a significance cut-off of 10−8 (horizontal brown line) identified a single strong peak on scaffold 24 (additional peaks in Table S6). (B) A detailed view of scaffold 24 surrounding the peak identified two genes, including TYRP1. The black bar denotes the length of the haplotype identified within the Nevada population that contains the R153C derived allele. (C) The locations of R114 and R153 (cyan, shown in atomic format) are shown within a ribbon diagram of the 3D structure of the human TYRP1 luminal domain (purple, from PDB ID 5M8L, ). Cysteine residues involved in disulfide bonds are yellow and the zinc cofactors are magenta. Note the proximity of R114 to a native disulfide bond and of R153 to a break between two alpha helices that are part of the zinc binding region.
Figure 3-
Figure 3-. Functional characterization of TYRP1 alleles.
(A) TYRP1-deficient melan-b cells that were untransduced (−) or stably expressed the WT, R153C, or R114C variants of human (h) or mouse (m) TYRP1 or mCh-STX13 as a control were analyzed by quantitative melanin content assay and normalized to protein content. Data represent percent normalized melanin content relative to that of WT melan-Ink4a cells from six experiments (colored dots), each performed in duplicate, and analyzed by two-way ANOVA and Tukey’s multiple comparison test. (B) Stable melan-b transductants expressing WT, R153C, or R114C hTYRP1 variants were analyzed by bright field microscopy, and individual cells were characterized as densely pigmented, lightly pigmented, light with dense aggregates, or non-pigmented. Data from three experiments with 200 of each cell type per experiment were analyzed by a mixed effect analysis with Tukey’s multiple comparison test relative to WT hTYRP1. (C-I). Indicated untransduced (-; G) or stable melan-b transductants (C-F) were analyzed by immunofluorescence microscopy for TYRP1 (left, green) and bright field microscopy (BF) for pigment granules (middle); right, overlay with pigment granules pseudocolored magenta. Insets, 7X magnification of boxed regions (intensities of TYRP1 and pigment granules optimized to better visualized overlap). Arrowheads, TYRP1 in rings around pigment granules; arrows, TYRP1 in separate punctate structures. (H) Quantification of cellular pattern of TYRP1 as predominantly rings, diffuse/punctate, or mixed among transduced cells expressing each of the TYRP1 variants. Data from four experiments with 150 of each cell type per experiment were analyzed by two-way ANOVA with Dunnett’s multiple comparison test relative to WT TYRP1. (I) Quantification of the percent of melanin-containing structures within densely pigmented cells that overlapped with TYRP1. Data from three experiments with 8-14 cells of each type (at least 30 total) per experiment were analyzed by Kruskal-Wallis with Dunn’s multiple comparison tests.
Figure 4-
Figure 4-. Spatial distribution of TYRP1R153C across the American black bear range.
Quantitative and spatial assessment of TYRP1R153C in Ursus americanus. (Inset) Hair color reflectance was compared to the SNP genotype (n = 317). We used t-tests to compare reflectance values between genotypes: homozygous ancestral and heterozygous P=2.02 x 10⁻¹¹; and heterozygous and homozygous derived P=1.41 x 10⁻⁴. These results indicate the allele acts with semidominance. The geospatial pattern of R153C across the range (n = 906) where color denotes genotype (black: homozygous ancestral GG; brown: heterozygous GA; gold: homozygous derived AA), with the species range shown in dark grey.
Figure 5-
Figure 5-. American black bear demographic history and TYRP1R153C allele expansion.
Ursus americanus demographic estimates over time. (A) Approximate completion of divergence and (B) bidirectional migration between lineage pairs including: eastern and western (solid blue line), eastern and Southeast Alaska (dashed blue line), and western and Southeast Alaska (dashed orange line). The vertical black line represents the estimated allele age of TYRP1R153C (also see Figure S4). (C) Our working model of historic lineage divergence (purple arrows), approximate geographic region of TYRP1R153C mutation (asterisks, *), and migration across the species’ geographic range (solid black arrows; dashed black arrow indicating recent translocation).
Figure 6-
Figure 6-. Simulation models of population allele frequencies under increasing selection coefficients.
Simulation models for the frequency of a derived allele (h = 0.75) following 1,440 generations in four populations of Ursus americanus (Nevada: NV; Arizona: AZ; Idaho: ID; and Southeast Alaska: SEAK) connected via gene flow (see Figure S8). Models varied by selection coefficients (s; A- 0; B- 0.005; and C- 0.01), and accounted for population expansion and bottlenecks. Each simulation model was run for 1,000 iterations and panels represent runs in which the derived allele did not go extinct within a run; thus, sample size varies (A- 95; B- 394; and C- 614). Colored points represent R153C genotypic frequencies (circles) estimated in this study for each respective population, or phenotypic frequencies (stars) inferred from contour maps.

References

    1. Hoekstra HE, Hirschmann RJ, Bundey RA, Insel PA, and Crossland JP (2006). A single amino acid mutation contributes to adaptive beach mouse color pattern. Science 313, 101–104. 10.1126/science.1126121. - DOI - PubMed
    1. Basu Mallick C, Iliescu FM, Möls M, Hill S, Tamang R, Chaubey G, Goto R, Ho SYW, Gallego Romero I, Crivellaro F, et al. (2013). The light skin allele of SLC24A5 in South Asians and Europeans shares identity by descent. PLoS Genetics 9, e1003912. 10.1371/journal.pgen.1003912. - DOI - PMC - PubMed
    1. Benjamin-Fink N, and Reilly BK (2017). Conservation implications of wildlife translocations; The state’s ability to act as conservation units for wildebeest populations in South Africa. Global Ecology and Conservation 12, 46–58. 10.1016/j.gecco.2017.08.008. - DOI
    1. Wikipedia (2021). The Cinnamon Bear. https://en.wikipedia.org/wiki/The_Cinnamon_Bear.
    1. Rounds RC (1987). Distribution and analysis of colourmorphs of the black bear (Ursus americanus). Journal of Biogeography 14, 521–538.

Publication types