. 2023 Jan 23;33(2):215-227.e3.
doi: 10.1016/j.cub.2022.11.039. Epub 2022 Dec 16.

Food memory circuits regulate eating and energy balance

Affiliations

Food memory circuits regulate eating and energy balance

Thibaut R Pardo-Garcia et al. Curr Biol. .

Abstract

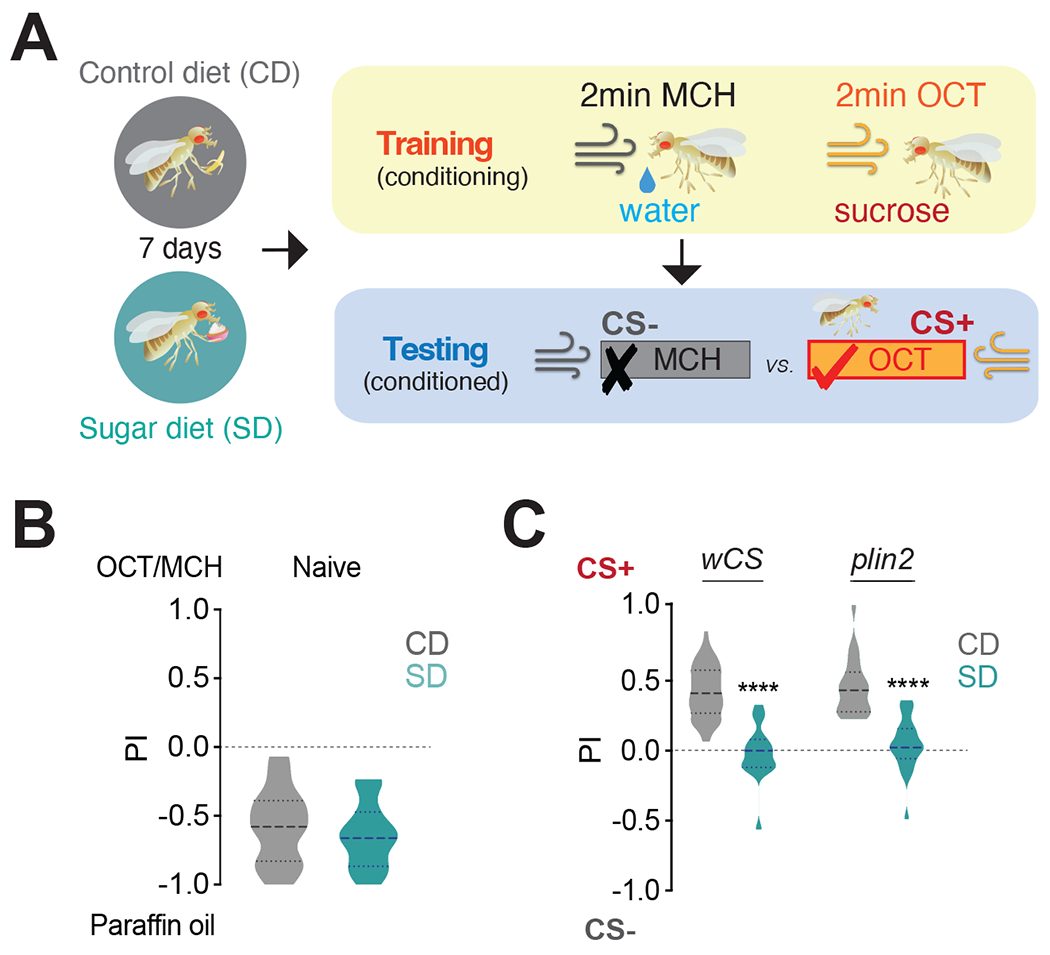
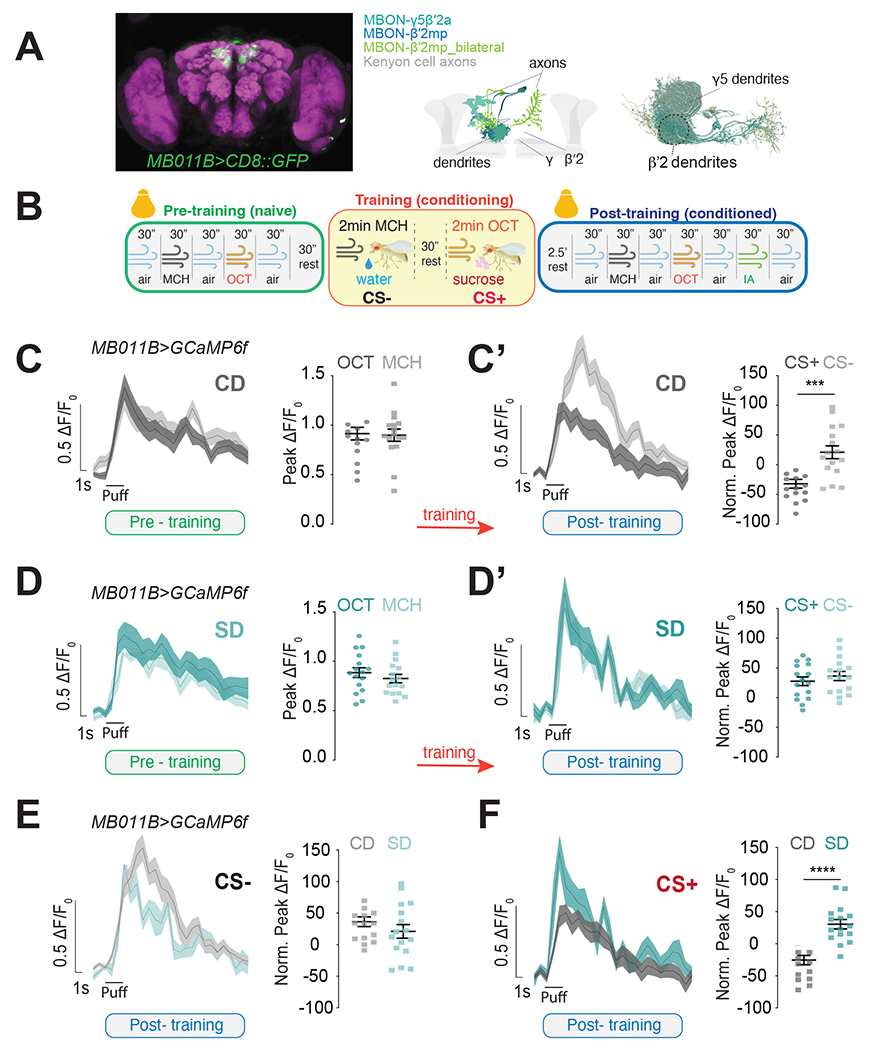
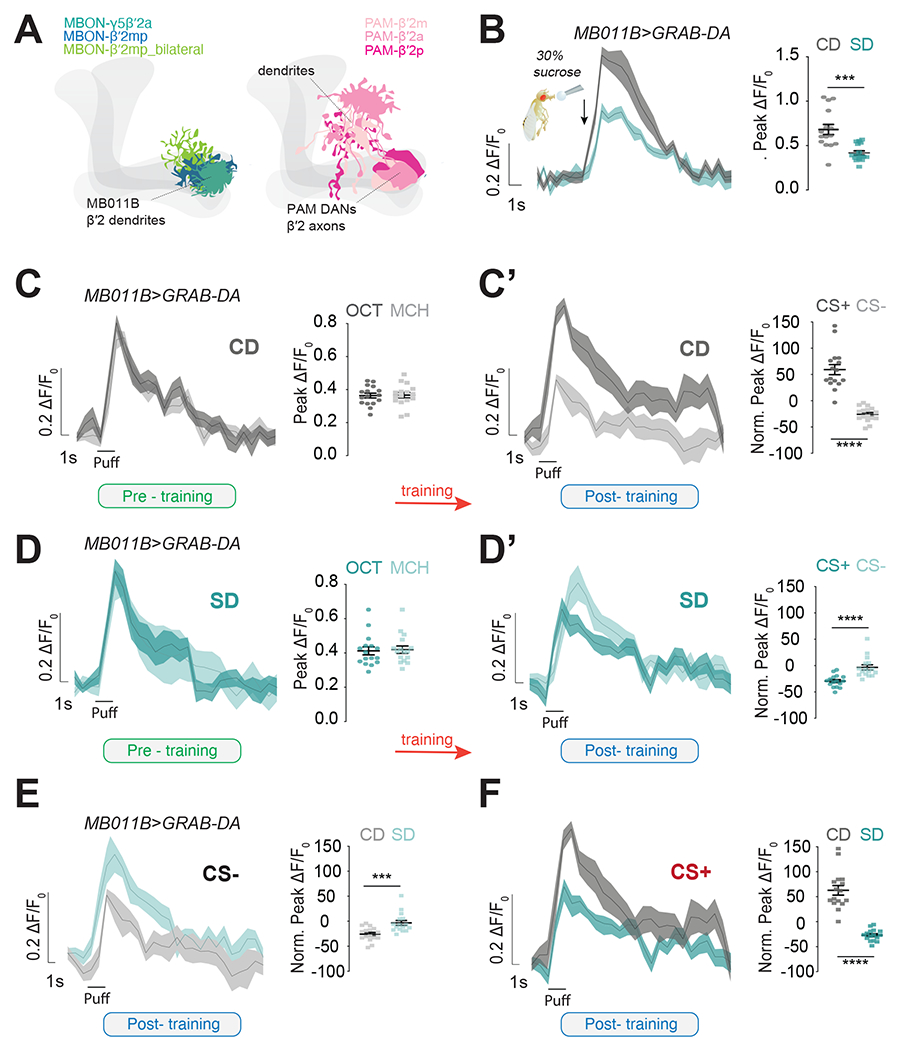
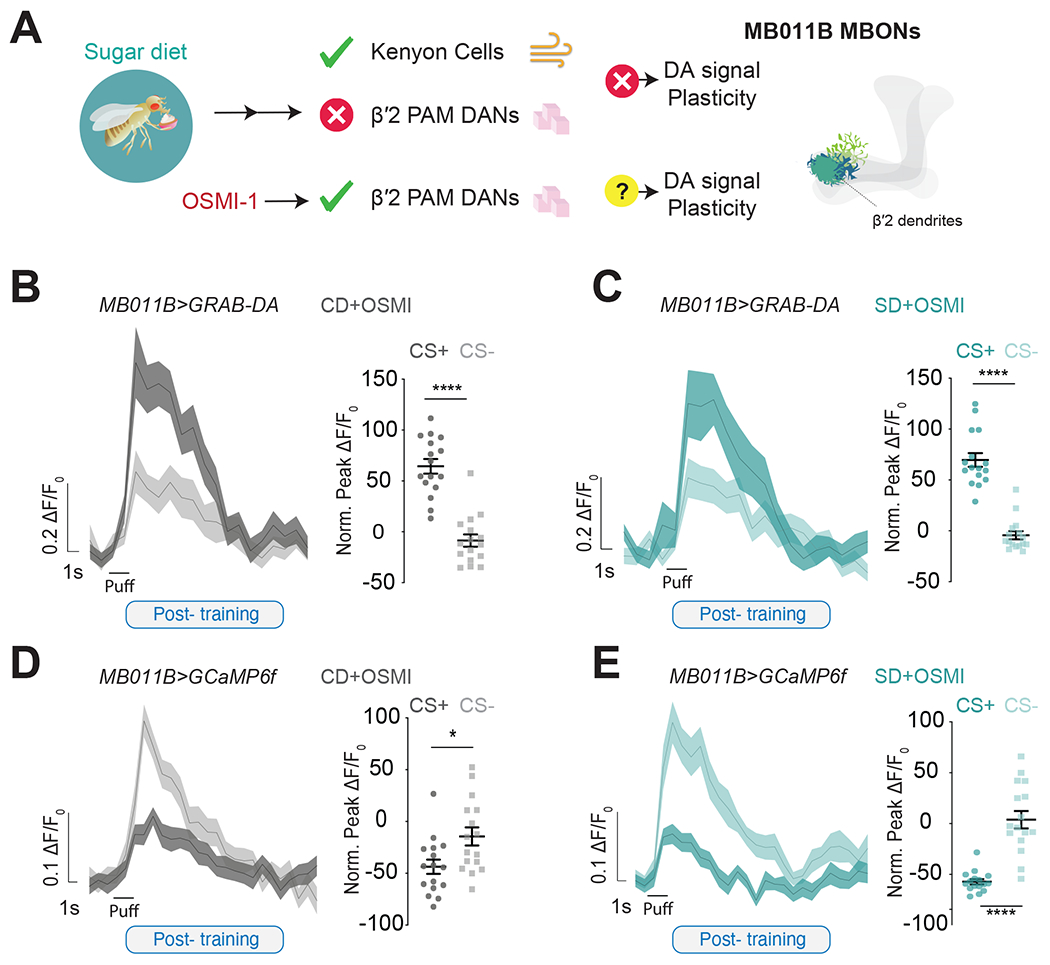
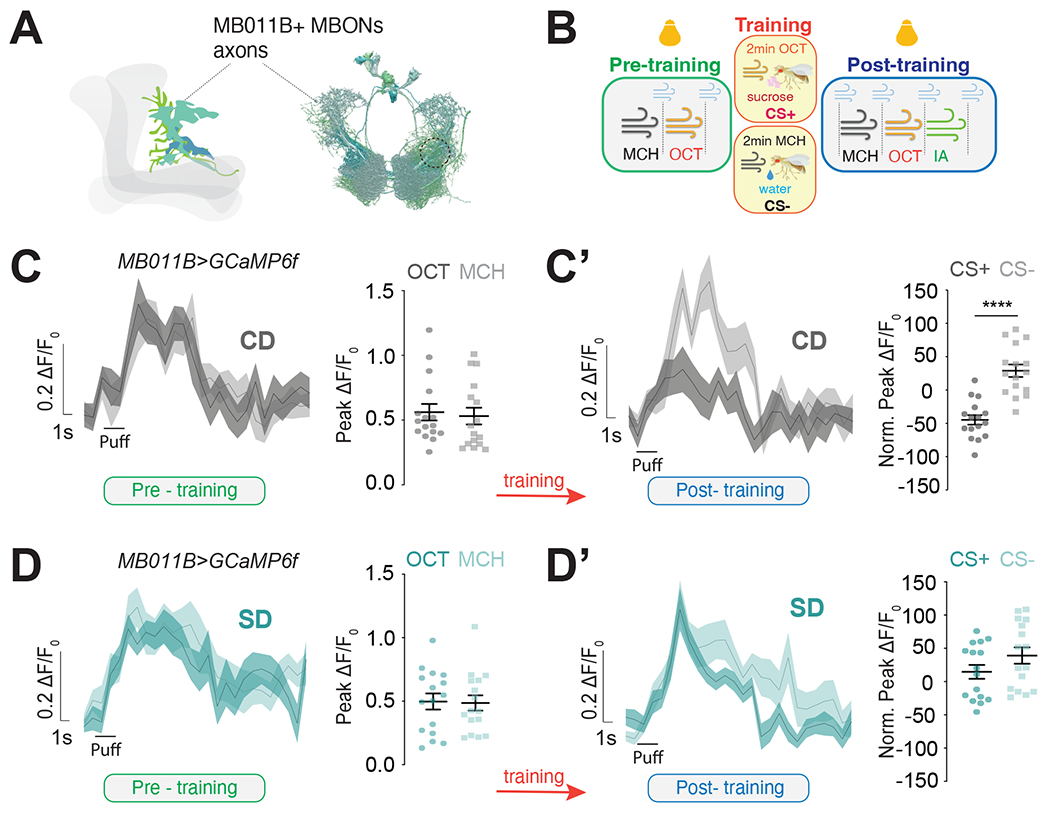
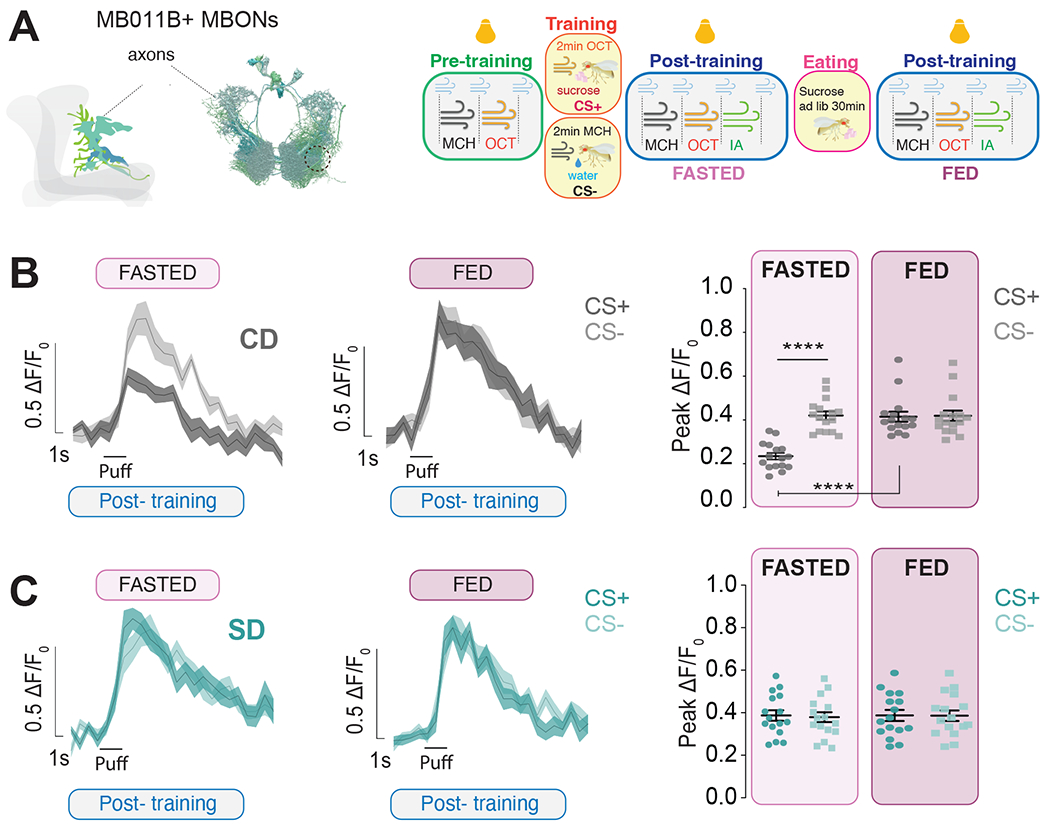
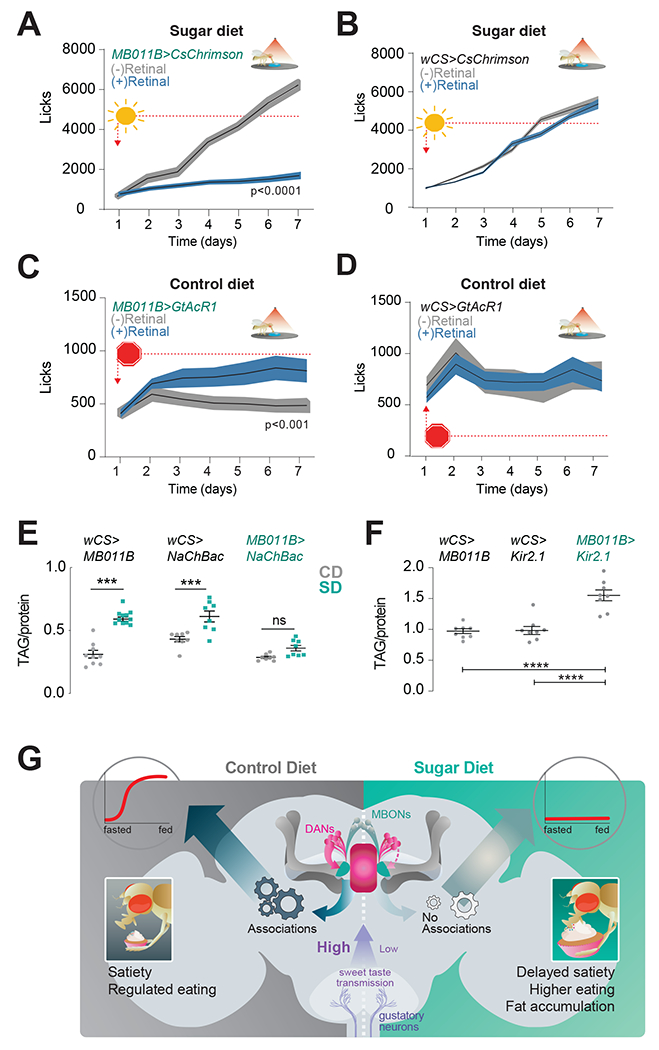
In mammals, learning circuits play an essential role in energy balance by creating associations between sensory cues and the rewarding qualities of food. This process is altered by diet-induced obesity, but the causes and mechanisms are poorly understood. Here, we exploited the relative simplicity and wealth of knowledge about the D. melanogaster reinforcement learning network, the mushroom body, in order to study the relationship between the dietary environment, dopamine-induced plasticity, and food associations. We show flies that are fed a high-sugar diet cannot make associations between sensory cues and the rewarding properties of sugar. This deficit was caused by diet exposure, not fat accumulation, and specifically by lower dopamine-induced plasticity onto mushroom body output neurons (MBONs) during learning. Importantly, food memories dynamically tune the output of MBONs during eating, which instead remains fixed in sugar-diet animals. Interestingly, manipulating the activity of MBONs influenced eating and fat mass, depending on the diet. Altogether, this work advances our fundamental understanding of the mechanisms, causes, and consequences of the dietary environment on reinforcement learning and ingestive behavior.

Keywords: nutrition; reinforcement learning; sensory plasticity; taste.


Conflict of interest statement

Declaration of interests The authors declare no competing interests.

Figures

Figure 1:
Figure 1:. A high sugar diet impairs the formation of food memories independently of fat accumulation.
A) Schematic of appetitive conditioning: flies were fed a Control (CD) or Sugar Diet (SD) for 7 days, trained to pair an odor with either water (CS−) or sucrose (CS+), and then tested for the preference between the CS− or CS+; odors, MCH, 4-methylcyclohexanol and OCT, 3-octanol. B) Performance index (PI) for naive olfaction between paraffin oil and MCH or OCT in wCS flies fed a CD (gray) or SD (teal). Data consist of a combined set with half of the flies tested with OCT and the other half with MCH. n=24, 1n=25 flies, Mann-Whitney test. The thicker dotted line in the violin plot shows the mean. C) The PI of control wCS (n=53 CD, n=17 SD) and obesity-resistant plin2 mutant flies (n=22) on CD (gray) and SD (teal). Kruskal-Wallis with Dunn’s multiple comparison test, ****p<0.0001. See also Figure S1.
Figure 2:
Figure 2:. Exposure to a high sugar diet abolishes the neural signatures of food associations.
A) (left)) Maximum intensity projection showing the expression of MB011B>CD8::GFP (green) in the fly brain, co-labeled with an antibody against bruchpilot to label the presynapses (magenta). (Mid) Diagram of the different types of MBONs labeled by the MB011B-GAL4 in shades of blue (MBON-γ5β′2a, MBON-β′2mp and MBON-β′2mp_bilateral) and the Kenyon Cells (KCs) axons in gray . Connectome reconstruction of MB011B+ MBONs with region used for imaging experiments shown inside the dotted circle. Only cells in one brain hemisphere are shown for clarity. B) Schematic of the appetitive conditioning protocol under the 2-photon microscope in pre-training (naive, green), training (yellow), and post-training (conditioned, blue) phases; bulbs represent imaging; reverse pairing not shown for clarity. C-D’) The calcium responses to MCH and OCT (puff) in the β′2 dendrites of MB011B>GcAMP6f neurons before (C, D, green) and after (C’, D’ blue) training (orange arrow) in Control Diet, CD (C-C’) and Sugar Diet, SD (D-D’) flies. E, F) Comparison of CS− (E) and CS+ (F) responses in the β’2 dendrites of CD (gray) and SD (teal) MB011B>GcAMP6f flies after training (data from C’ and D’). Data are shown as mean +/− SEM, ΔF/F0 traces and quantified as maximum peak ΔF/F0 response (pre-training) or normalized to naïve responses (post-training). n=16 (n=8 with OCT as the CS+, and n=8 as MCH as the CS+); Student’s t-test; ***p<0.001, ****p<0.0001. See also Figure S2.
Figure 3:
Figure 3:. A sugar diet decreases dopamine-mediated plasticity onto MBONs during learning.
A) Graphics showing the dendrites of MB011B+ MBONs (blue/green shades) and the axons and dendrites of β’2 PAM DANs (pink shades). B) Mean ΔF/F0 traces and quantification of maximum peak ΔF/F0 response to stimulation of the proboscis with 30% sucrose (arrow) in the β’2 dendrites of Control Diet, CD (gray) and Sugar Diet, SD (Teal) MB011B>GRAB-DA flies. n=15-16, Mann-Whitney test, ***p<0.001. C-D’) The mean ΔF/F0 traces and quantification of maximum or normalized peak ΔF/F0 response to OCT or MCH in the β’2 dendrites of CD (C-C’, gray, Student’s t-test) and SD (D-D’, teal; left, Student’s t-test and right Mann-Whitney test) MB011B>GRAB-DA flies before training (C and D, naive, green) and after training (C’ and D’, conditioned, blue); ****p<0.0001. E, F) Comparison of CS− (E, Mann-Whitney Test) and CS+ (F, Student’s t-test) responses in the β’2 dendrites of CD (gray) and SD (teal) MB011B>GRAB-DA flies after training (data from C’ and D’). n=16, ***p<0.001, ****p<0.0001. Half of the flies experienced OCT=CS+ and half MCH=CS+. Data are shown as mean +/− SEM. See also Figure S3.
Figure 4:
Figure 4:. Correcting DA-induced plasticity restores appetitive learning in sugar-diet flies.
A) (left) Schematic representation of the action of OSMI-1 on the reinforcing signal carried by β’2 PAM DANs and (right) a diagram showing the dendrites in the β’2 region where imaging occurred. B, C) The mean ΔF/F0 traces and quantification of normalized peak ΔF/F0 response to CS+ or CS− in the β’2 dendrites of Control Diet, CD+OSMI-! (B, gray, Student’s t-test, ****p<0.001) and Sugar Diet, SD +OSMI-1 (C, teal, Mann-Whitney test, ****p<0.001) MB011B>GRAB-DA flies after training. n=16, (half of the flies experienced OCT=CS+ and half MCH=CS+). D, E) The mean ΔF/F0 traces and quantification of normalized peak ΔF/F0 response to CS+ or CS− in the β’2 dendrites of CD+OSMI-1 (D, gray, Student’s t-test, *p<0.01) and SD+OSMI-1 (E, Student’s t-test, ****p<0.001) MB011B>GCaMP6f flies after training. n=16, (half of the flies experienced OCT=CS+ and half MCH=CS+). Data shown as mean +/− SEM. See also Figure S4 and S5A.
Figure 5:
Figure 5:. Learning changes the presynaptic responses of the MB011B+ MBONs to cues.
A) Graphic (left) and connectome reconstruction (right) of MB011B+ β’2mp axons; in the graphic only cells in one hemisphere are shown; dotted circle shows the region imaged. B) Schematic of the appetitive conditioning protocol under the 2-photon microscope in pre-training (naive, green), training (yellow), and post-training (testing, blue) phases; yellow bulbs represent imaging. C-D) The calcium responses to MCH and OCT (puff) in the β′2mp axons of MB011B>GcAMP6f neurons before (C and D, green) and after (C’ and D’, blue) training (red arrow) in Control Diet, CD (C-C’) and Sugar Diet, SD (D-D’) flies. Data are shown as mean +/− SEM ΔF/F0 traces and quantified as maximum peak ΔF/F0 response (pre-training) or normalized to naive responses (post-training). C-C’) left Mann-Whitney and right student t-test, D-D’) left student t-test and right Mann-Whitney test; ****p<0.0001. See also Figure S5.
Figure 6:
Figure 6:. Learning shapes the output of MBONs during eating.
A) Left, Graphic and connectome reconstruction of β’mp axons of MB011B MBONs; in the cartoon, only cells in one hemisphere are shown; dotted line shows the region imaged. Right, Schematic of the appetitive conditioning protocol under the 2-photon microscope in pre-training (naive, green), training (yellow), and post-training (testing, blue) phases, 30 minutes apart, one before (light pink) and one after eating 2M sucrose (dark pink); yellow bulbs represent imaging and blue puffs air. B-C) The calcium responses to MCH and OCT (puff) in the β′2mp axons of MB011B>GcAMP6f neurons post training but before (light pink, fasted) or after (dark pink, fed) consuming sucrose in Control Diet, CD (B) and Sugar Diet, SD (C) flies; n=16, data are shown as mean +/− SEM, B) ****p<0.0001 CD fasted CS+ vs fasted CS− (student’s t-test) and CD fasted CS+ vs fed CS+ (Wilcoxon test); ns, CD fed CS+ vs fed CS− (Mann-Whitney test), CD fed CS+ vs fed CS− (Wilcoxon test); C) respective comparisons ns, (Student’s t-test). See also Figure S6.
Figure 7:
Figure 7:. The activity of MB011B+ MBONs affects eating and energy balance.
A) The number of food interactions (licks) per day on a high sugar diet in experimental MB011B>CSChrimson +retinal (blue) flies or control MB011B>CSChrimson - retinal (gray) flies. n=27 flies, Two-way Repeated Measure ANOVA with Sidak’s test, p<0.0001. B) The number of food interactions (licks) per day on a high sugar diet in control CSChrimson>wCS + retinal (blue) or - retinal (gray) flies. n=27 flies, Two-way Repeated Measure ANOVA with Sidak’s test, p>0.05. C) The number of food interactions (licks) per day on a control diet in experimental MB011B>GtAcR1 +retinal (blue) flies or control n MB011B>GtAcR1-retinal (gray) flies n=24-25, Two-way ANOVA with Sidak’s test, **p<0.001. D) The number of food interactions (licks) per day on a 20% sucrose diet in control GtAcR1>wCS +retinal (blue) or - retinal (gray) flies. n=24 flies, Two-way Repeated Measure ANOVA with Sidak’s test, p>0.05. E) Triglyceride levels normalized to protein in age-matched male MB011B>NaChBac and control flies on Control Diet, CD (gray) or Sugar Diet, SD (teal). n=8-11, one-way ANOVA with Tukey’s test, comparisons to control diet within genotype, ***p<0.001, ns, not significant. Additional comparisons, within control diet: MB011B>wcs vs. MB011B>NaChBac (p=0.9864), NaChBac>wCS vs. MB011B>wcs and NaChBac>wCS vs MB011B>NaChBac p<0.05; within sugar diet, MB011B>wCS vs. MB011B>NaChBac (p<0.05), NaChBac>wcs vs. MB011B>wcs, p<0.01, and NaChBac>wCS vs. MB011B>NaChBac p<0.0001. F) Triglyceride levels normalized to protein in age-matched male MB011B>Kir2.1 and control flies on a CD (containg 10% sucrose in food). n=8, One-way ANOVA with Tukey’s test, ****p<0.001 and MB011B>wCS vs. NaChBac>wCS p=0.9919. G) A circuit model for how the dietary environment affects food reinforcement learning. Data shown as mean +/− SEM. See also Figure S7.

Comment in

Similar articles

Cited by

References

    1. Benelam B (2009). Satiation, satiety and their effects on eating behaviour. Nutr. Bull 34, 126–173.
    1. Bellisle F, and Blundell JE (2013). Satiation, satiety: concepts and organisation of behaviour. Satiation, Satiety and the Control of Food Intake, 3–11. 10.1533/9780857098719.1.3. - DOI
    1. Davidson TL, and Martin AA (2014). Obesity: Cognitive impairment and the failure to “eat right.” Curr. Biol 24, R685–7. - PubMed
    1. Melhorn SJ, Krause EG, Scott KA, Mooney MR, Johnson JD, Woods SC, and Sakai RR (2010). Acute exposure to a high-fat diet alters meal patterns and body composition. Physiol. Behav 99, 33–39. - PMC - PubMed
    1. Hall KD, Ayuketah A, Brychta R, Cai H, Cassimatis T, Chen KY, Chung ST, Costa E, Courville A, Darcey V, et al. (2019). Ultra-Processed Diets Cause Excess Calorie Intake and Weight Gain: An Inpatient Randomized Controlled Trial of Ad Libitum Food Intake. Cell Metabolism 30, 67–77.e3. 10.1016/j.cmet.2019.05.008. - DOI - PMC - PubMed

Publication types

LinkOut - more resources