. 2023 Feb;299(2):102799.
doi: 10.1016/j.jbc.2022.102799. Epub 2022 Dec 15.

A solution structure analysis reveals a bent collagen triple helix in the complement activation recognition molecule mannan-binding lectin

Affiliations

A solution structure analysis reveals a bent collagen triple helix in the complement activation recognition molecule mannan-binding lectin

Hina Iqbal et al. J Biol Chem. 2023 Feb.

Abstract

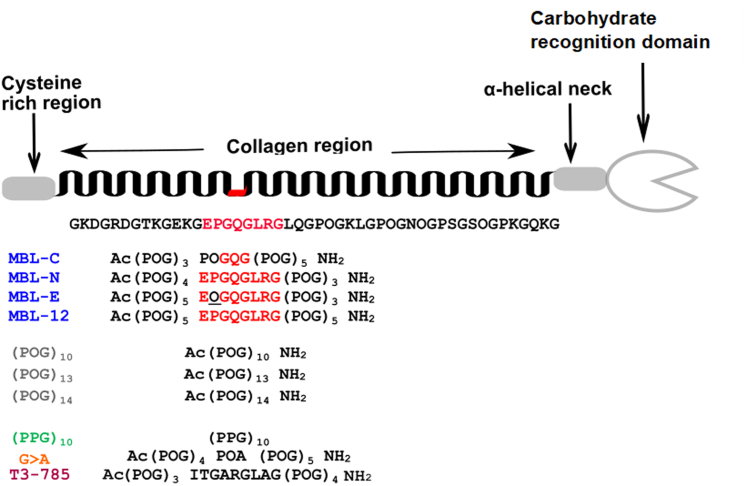
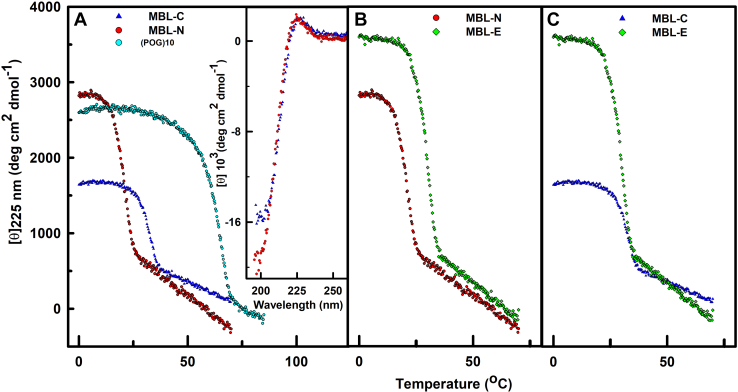
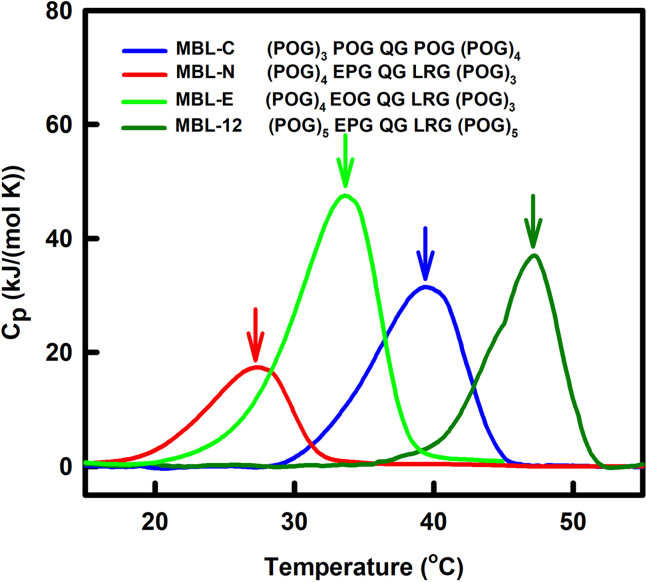
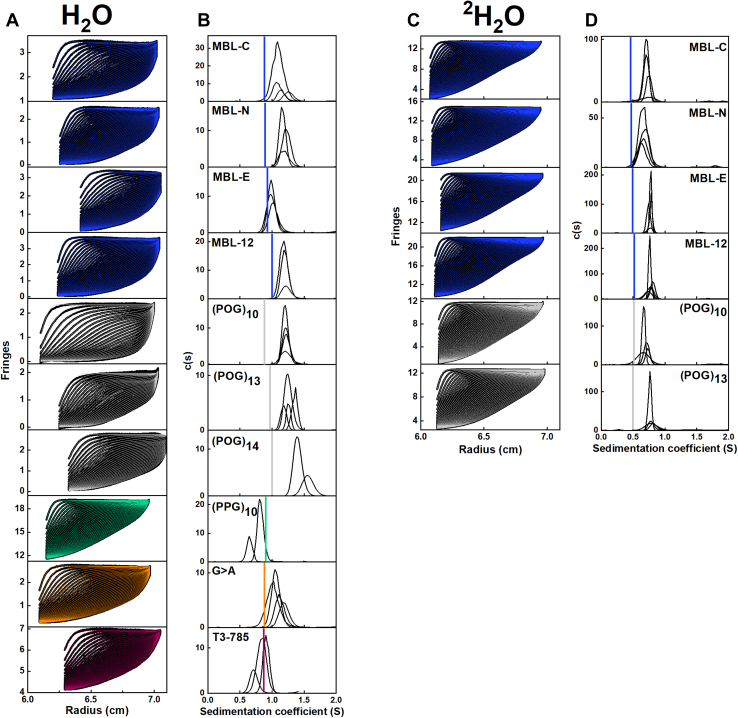
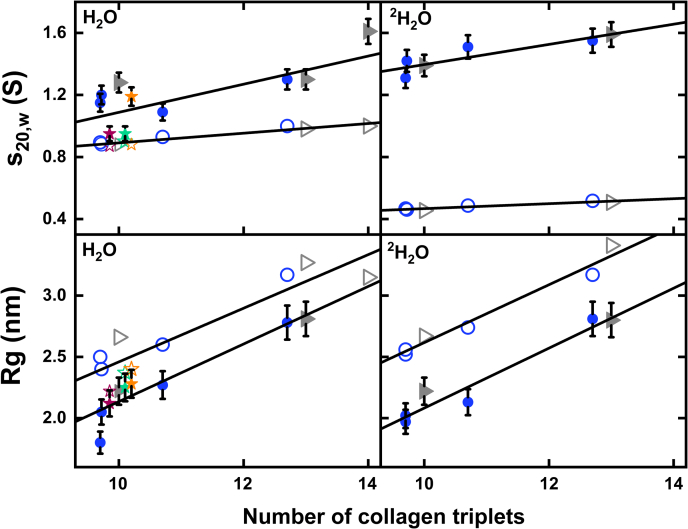
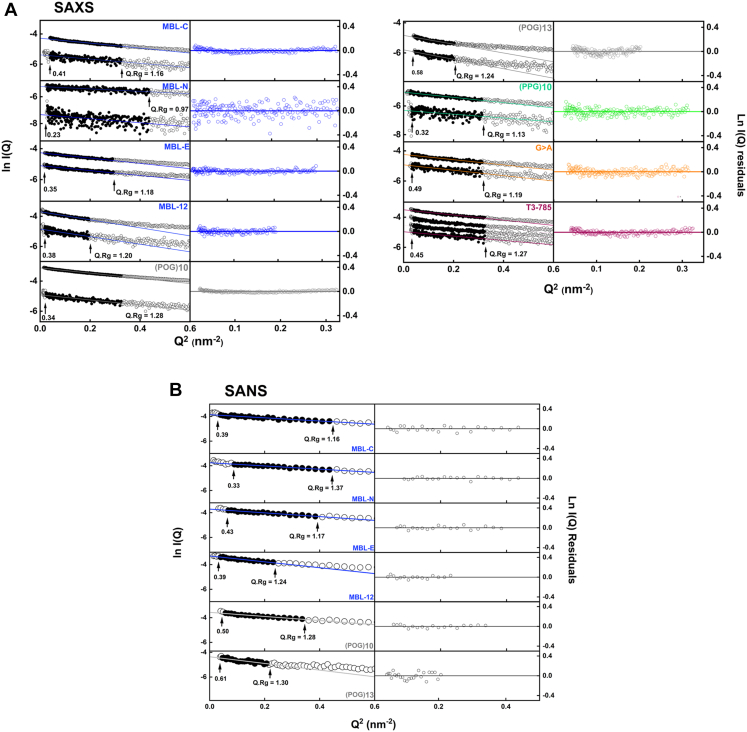
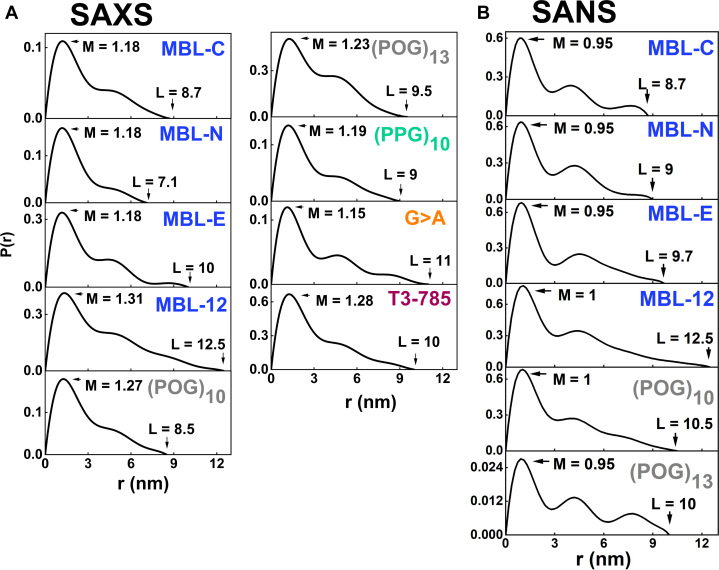
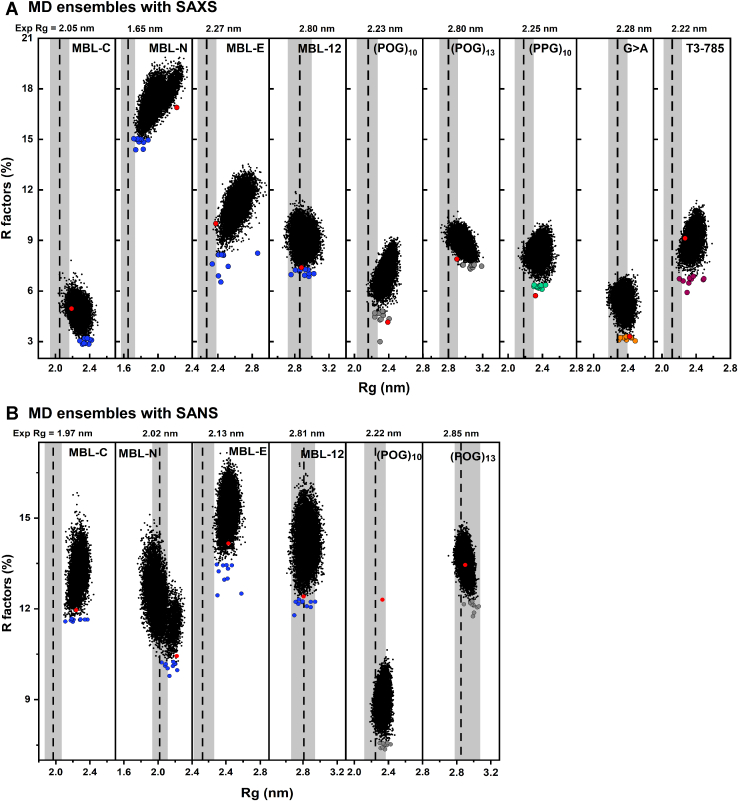
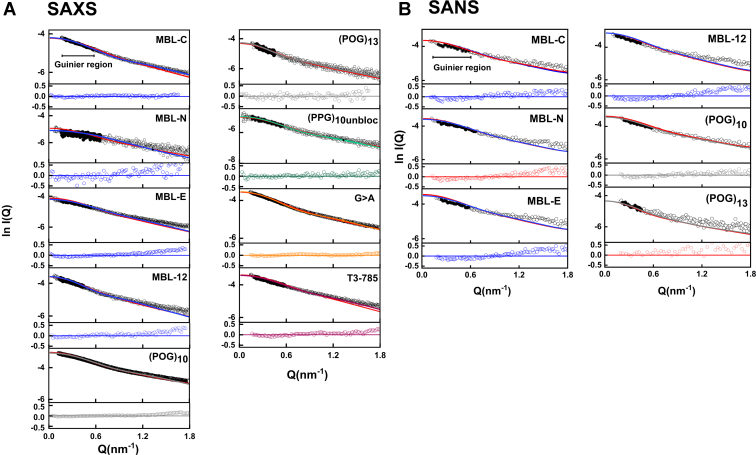
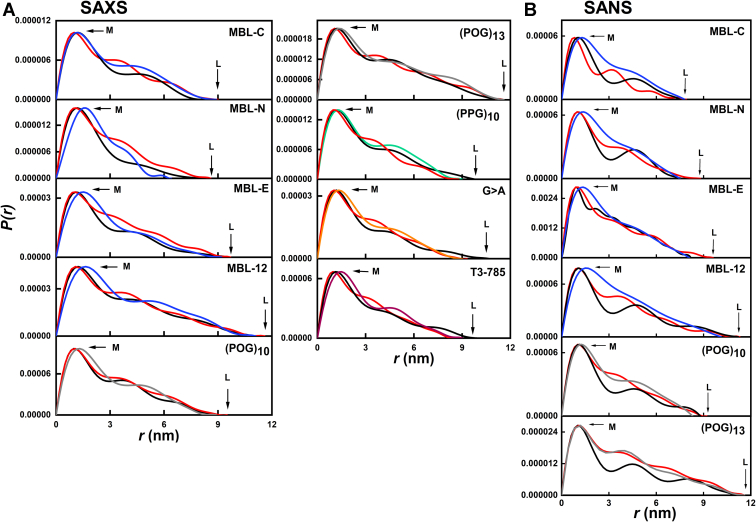
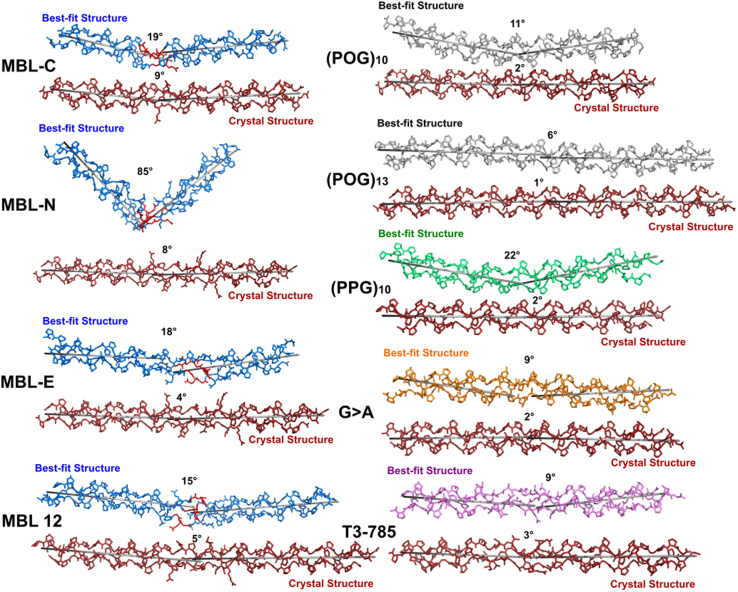
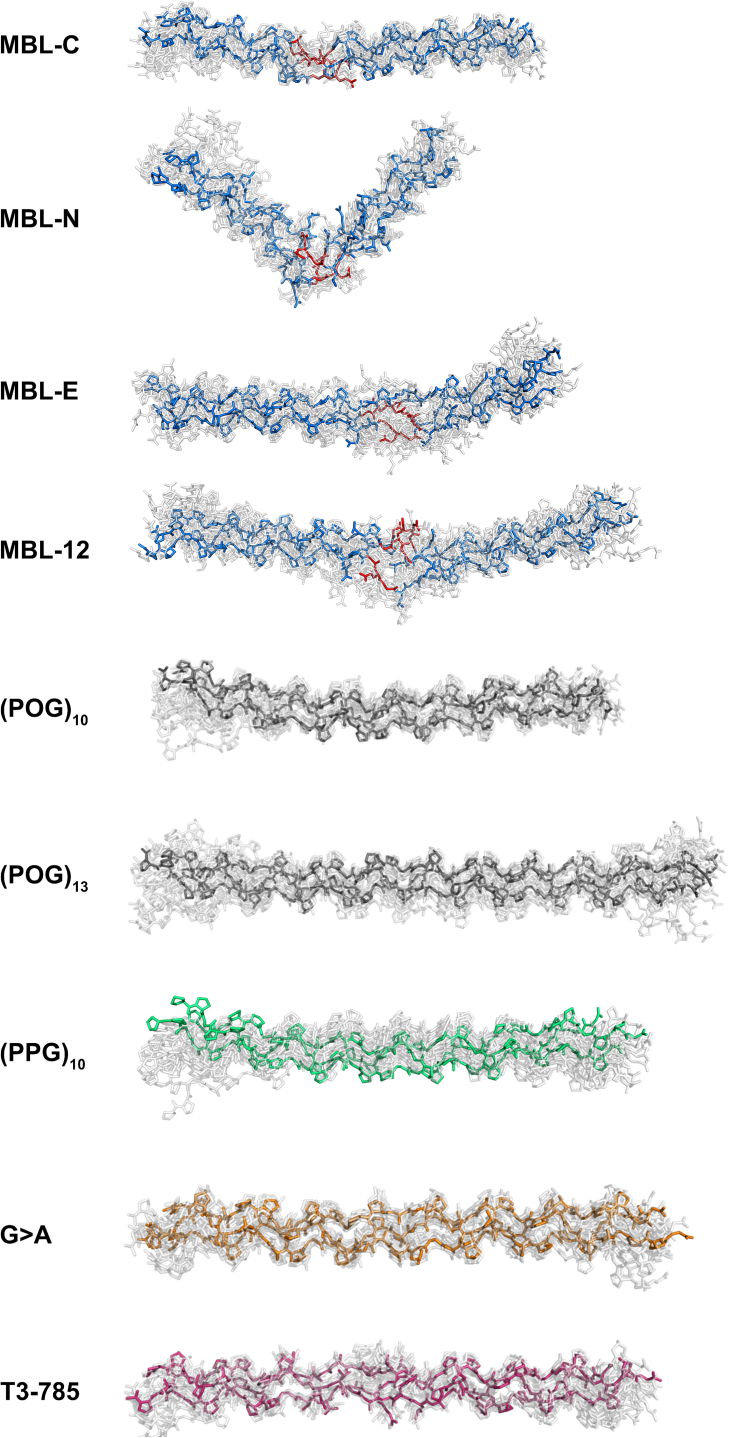
Collagen triple helices are critical in the function of mannan-binding lectin (MBL), an oligomeric recognition molecule in complement activation. The MBL collagen regions form complexes with the serine proteases MASP-1 and MASP-2 in order to activate complement, and mutations lead to common immunodeficiencies. To evaluate their structure-function properties, we studied the solution structures of four MBL-like collagen peptides. The thermal stability of the MBL collagen region was much reduced by the presence of a GQG interruption in the typical (X-Y-Gly)n repeat compared to controls. Experimental solution structural data were collected using analytical ultracentrifugation and small angle X-ray and neutron scattering. As controls, we included two standard Pro-Hyp-Gly collagen peptides (POG)10-13, as well as three more peptides with diverse (X-Y-Gly)n sequences that represented other collagen features. These data were quantitatively compared with atomistic linear collagen models derived from crystal structures and 12,000 conformations obtained from molecular dynamics simulations. All four MBL peptides were bent to varying degrees up to 85o in the best-fit molecular dynamics models. The best-fit benchmark peptides (POG)n were more linear but exhibited a degree of conformational flexibility. The remaining three peptides showed mostly linear solution structures. In conclusion, the collagen helix is not strictly linear, the degree of flexibility in the triple helix depends on its sequence, and the triple helix with the GQG interruption showed a pronounced bend. The bend in MBL GQG peptides resembles the bend in the collagen of complement C1q and may be key for lectin pathway activation.

Keywords: analytical ultracentrifugation; atomistic modeling; collagen; complement; molecular dynamics; small-angle X-ray scattering; small-angle neutron scattering.


Conflict of interest statement

Conflict of interest The authors declare that they have no conflicts of interest with the contents of this article.

Figures

Figure 1
Figure 1
Synthetic collagen peptides used in the study. A cartoon of a single chain of mannan-binding lectin (MBL) monomer is shown at the top, with the collagen interruption region shown in red. Beneath, the blocked ends refer to N-terminal acetylation and C-terminal amidation. The peptides as shown correspond to those used in the AUC, SAXS, and SANS experiments below. From top to bottom, the sequences are shown for four peptides (blue) based on the MBL collagen region, namely MBL-C, MBL-N, MBL-E, and MBL-12. The corresponding sequence in native MBL is highlighted in red, flanked with (POG)n triplets and blocked ends. The sequences of three of four standard peptides with blocked ends (POG)10, (POG)13, and (POG)14 are colored gray, whereas one standard unblocked peptide (PPG)10 is colored green. The peptide G > A containing a Gly>Ala substitution in (POG)10 with blocked ends is colored orange. The peptide T3-785 containing the partial sequence of near matrix metalloproteinase-1 collagenase cleavage site in type III collagen is colored pink. POG, the tripeptide sequence Pro-Hyp-Gly; SANS, small angle neutron scattering; SAXS, small angle X-ray scattering; AUC, analytical ultracentrifugation.
Figure 2
Figure 2
Circular dichroism study of the melting temperatures of the MBL collagen peptides. The wavelength at 226 nm is monitored in all samples between approximately 5 to 70 °C. The insets in panel A show the full CD spectrum between 195 and 255 nm at 20 °C. A, comparison of MBL-C (blue), MBL-N (red), and (POG)10 (cyan) as in Figure 1. B, comparison of MBL-N (red) and MBL-E (green) except that MBL-E has one fewer N-terminal POG triplet compared to Figure 1. C, comparison of MBL-C (blue) and MBL-E (green) except that MBL-E has one fewer POG triplet at the N terminus compared to Figure 1. POG, the tripeptide sequence Pro-Hyp-Gly; MBL, mannan-binding lectin; CD, circular dichroism.
Figure 3
Figure 3
Differential scanning calorimetry study of the melting temperatures of the MBL collagen peptides. The four peptides correspond to MBL-C, MBL-N, and MBL-E with one fewer N-terminal POG compared to Figure 1, and MBL-12. Asymmetric features can arise from nonequilibrium conditions in part of the transition. The melting temperatures are arrowed. MBL, mannan-binding lectin; POG, the tripeptide sequence Pro-Hyp-Gly.
Figure 4
Figure 4
Sedimentation velocity analyses of the 10 collagen peptides. A and C, the experimental sedimentation boundaries of the collagen peptides obtained in 137 mM PBS or 20 mM L-His buffer in H2O and in 20 mM L-His buffer with 2H2O, respectively. The experimental boundary scans (black lines) were acquired at 20 °C and 50,000 rpm using interference/absorbance optics at 222 nm. Up to 45 scans (every third scan) were fitted using SEDFIT (colored lines to follow Fig. 1). The meniscus positions varied depending on sample availability. B and D, the corresponding peaks are shown from the size distribution analyses c(s) in H2O and 2H2O, respectively. The vertical colored lines correspond to the theoretical s20,w values calculated from the linear crystal-derived models for the helices (Table 2). The 2 to 4 c(s) curves from the concentration series for each sample are shown together in each panel to indicate the reproducibility of the velocity analyses. The peptide concentrations for experiments in H2O were 0.25 to 1 mg/ml for MBL-C, 0.25 to 1 mg/ml for MBL-N, 0.25 to 1.25 mg/ml for MBL-E, 0.25 to 1.25 mg/ml for MBL-12, 0.25 to 1 mg/ml for (POG)10, 0.20 to 0.75 mg/ml for (POG)13, 0.40 to 0.80 mg/ml for (POG)14, 1 to 2.5 mg/ml for (PPG)10, 0.40 to 0.95 mg/ml for G > A, and 0.3 to 1.1 mg/ml for T3-785, respectively. The concentrations for experiments in 2H2O were 0.94 to 3.7 mg/ml for MBL-C, 1.5 to 4 mg/ml for MBL-N, 0.75 to 4 mg/ml for MBL-E, 1 to 4 mg/ml for MBL-12, 1 to 4 mg/ml for (POG)10, and 1 to 3.5 mg/ml for (POG)13 respectively. MBL, mannan-binding lectin; POG, the tripeptide sequence Pro-Hyp-Gly.
Figure 5
Figure 5
Comparison of the experimental and crystallographic s20,wand Rg values. The left and right panels display data for the collagen helices in 137 mM PBS or 20 mM L-histidine buffer in H2O and 20 mM L-histidine buffer in 2H2O, respectively. The top panels compare the s20,w values against the peptide length. The bottom panels compare the Rg values against the peptide length. The noninteger values correspond to partial triplets (Fig. 1). The theoretical values were calculated from the nine linear crystal-derived models (open symbols). The experimental s20,w and Rg values (filled symbols with error bars; Table 2) were subjected to linear fits (black lines). To follow Figure 1, blue circles represent the MBL-C, MBL-N, MBL-E, and MBL-12 peptides with 9.67, 9.67, 10.67, and 12.67 triplets, respectively, gray triangles represent the (POG)10, (POG)13, and (POG)14 peptides, the green star represents the unblocked (PPG)10 peptide, the orange star represents the blocked G > A peptide, and the pink star represents the unblocked T3-785 peptide. MBL, mannan-binding lectin; POG, the tripeptide sequence Pro-Hyp-Gly.
Figure 6
Figure 6
Experimental X-ray and neutron GuinierRgfor the collagen peptides. The peptide concentrations ranged between 1 and 2.5 mg/ml for SAXS and 4.0 and 5.5 mg/ml for SANS. A, the SAXS Guinier Rg plots at low Q values are shown in two columns. To the left, the filled symbols (black) denote the Q ranges used to determine the Guinier Rg from the linear fits (colored lines) of the I(Q) curves (open symbols). The Q.Rg limits for each fit are indicated with arrows. The Q ranges of the Guinier SAXS fits were between 0.20 and 0.57 nm−1 for MBL-C, 0.16 to 0.66 nm−1 for MBL-N, 0.16 to 0.54 nm−1 for MBL-E and 0.14 to 0.44 nm−1 for MBL-12. For the (POG)n peptides, the Q ranges of the Guinier SAXS fits were successively reduced from 0.15 to 0.57 nm−1 for (POG)10 to 0.21 to 0.45 nm−1 for (POG)13. The SAXS Q ranges were between 0.16 and 0.56 nm−1 for (PPG)10, 0.18 and 0.56 nm−1 for G > A, and 0.20 and 0.57 nm−1 for T3-785. To the right, the residuals of the Guinier fits are shown relative to the fitted line. B, for the SANS Guinier Rg plots, the Q ranges of the corresponding fits were 0.20 to 0.57 nm−1 for MBL-C, 0.20 to 0.66 nm-1 for MBL-N, 0.24 to 0.58 nm−1 for MBL-E, 0.14 to 0.44 nm−1 for MBL-12 0.24 to 0.58 nm-1 for (POG)10 and 0.21 to 0.45 nm-1 for (POG)13. MBL, mannan-binding lectin; POG, the tripeptide sequence Pro-Hyp-Gly; SANS, small angle neutron scattering; SAXS, small angle X-ray scattering.
Figure 7
Figure 7
Experimental X-ray and neutron pair distance distribution P(r) analyses for the collagen peptides. A and B, the distance distribution curves for the collagen peptides from the experimental SAXS and SANS data are shown in two panels. The r values at the maximum lengths L (nm) and peak maxima M (nm) are indicated by arrows. The vertical scales are multiplied by 1000 for reason of clarity. MBL, mannan-binding lectin; POG, the tripeptide sequence Pro-Hyp-Gly; SANS, small angle neutron scattering; SAXS, small angle X-ray scattering.
Figure 8
Figure 8
Comparison of the molecular dynamics (MD) ensembles with the experimental scattering data. A, 12,000 R factors were compared with X-ray Rg values computed for nine collagen models (MBL-C, MBL-N, MBL-E, MBL-12, (POG)10, (POG)13, (PPG)10, G > A, and T3-785). B, R factors of models compared with neutron Rg values calculated for six collagen models (MBL-C, MBL-N, MBL-E, MBL-12, (POG)10, and (POG)13). All models in an ensemble are shown as black dots. The 10 best-fit structures with the lowest R factors are shown as filled symbols, blue for MBL-C, MBL-N, MBL-E, and MBL-12; gray for (POG)10 and (POG)13; green for (PPG)10; orange for G > A, and pink for T3-785 collagens. The Rg and R factor values for each of the crystal-derived linear models are shown in red circles. The dashed lines represent the experimentally calculated Rg values, and the shaded bands represent ± 5% error range in these values. MBL, mannan-binding lectin; POG, the tripeptide sequence Pro-Hyp-Gly.
Figure 9
Figure 9
Comparison of the crystal derived linear and best-fit MD modeled curves with the experiment.A and B, the superimpositions of the linear and best-fit MD I(Q) scattering curves with the experimental curves are shown for the SAXS data (left) and SANS data (right). Black represents the experimental data, red represents the linear model curves, and blue, gray, green, orange, and pink represent the MD-modeled curves using the color scheme of Figure 1. The filled circles and horizontal bars represent the Guinier Rg range. Underneath each panel, the residuals of the curve fits compared to each modeled curve are shown. MBL, mannan-binding lectin; POG, the tripeptide sequence Pro-Hyp-Gly; MD, molecular dynamics; SANS, small angle neutron scattering; SAXS, small angle X-ray scattering.
Figure 10
Figure 10
Comparison of the crystal derived linear and best-fit MD modeled curves with the experiment. A and B, the superimpositions of the linear and best-fit MD P(r) scattering curves with the experimental curves are shown for the SAXS data (left) and SANS data (right). Black represents the experimental data, red represents the linear model curves, and blue, gray, green, orange, and pink represents the MD-modeled curves using the color scheme of Figure 1. MBL, mannan-binding lectin; POG, the tripeptide sequence Pro-Hyp-Gly; MD, molecular dynamics; SANS, small angle neutron scattering; SAXS, small angle X-ray scattering.
Figure 11
Figure 11
Best-fit MD and linear crystal-derived structures of the collagen peptides. The best-fit MD structures and the linear crystal-derived structures are shown in pairs for the MBL-C, MBL-N, MBL-E, MBL-12, (POG)10, (POG)13, (PPG)10, G > A, and T3-785 collagen peptides. Blue, gray, green, orange, and pink represent the MD-modeled curves using the color scheme of Figure 1. The GQG interruption in the four best-fit MBL peptides is highlighted in red. The linear models are shown in red. Note that the (PPG)10, G > A and T3-785 linear structures corresponded to their crystal structures and not to homology-modeled structures as for the MBL peptides. The angles were determined using the anglebetweenhelices.py module in PyMol. MBL, mannan-binding lectin; POG, the tripeptide sequence Pro-Hyp-Gly; MD, molecular dynamics.
Figure 12
Figure 12
Overlap of the top ten MD models for the collagen peptides that were best-fitted to the experimental scattering curves.Blue, gray, green, orange, and pink represent the MD-modeled curves using the color scheme of Figure 1, while the remaining nine are grayed. The GQG interruption in the four MBL peptides is highlighted in red. MBL, mannan-binding lectin; POG, the tripeptide sequence Pro-Hyp-Gly; MD, molecular dynamics.

Similar articles

Cited by

References

    1. Ramachandran G.N., Kartha G. Structure of collagen. Nature. 1954;174:269–270. - PubMed
    1. Rich A., Crick F.H. The molecular structure of collagen. J. Mol. Biol. 1961;3:483–506. - PubMed
    1. Bella J. Collagen structure: new tricks from a very old dog. Biochem. J. 2016;473:1001–1025. - PubMed
    1. Shoulders M.D., Raines R.T. Collagen structure and stability. Annu. Rev. Biochem. 2009;78:929–958. - PMC - PubMed
    1. Domene C., Jorgensen C., Abbasi S.W. A perspective on structural and computational work on collagen. Phys. Chem. Chem. Phys. 2016;18:24802–24811. - PubMed

Publication types