

Projecting the COVID-19 immune landscape in Japan in the presence of waning immunity and booster vaccination
- PMID: 36528092
- PMCID: PMC9749381
- DOI: 10.1016/j.jtbi.2022.111384
Projecting the COVID-19 immune landscape in Japan in the presence of waning immunity and booster vaccination
Abstract
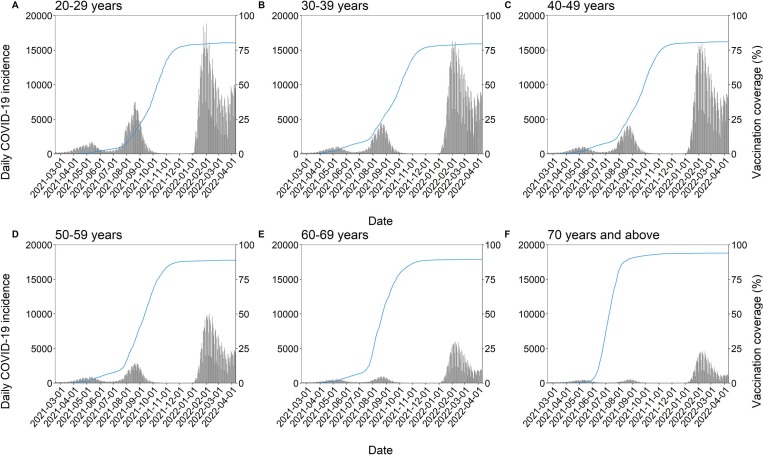
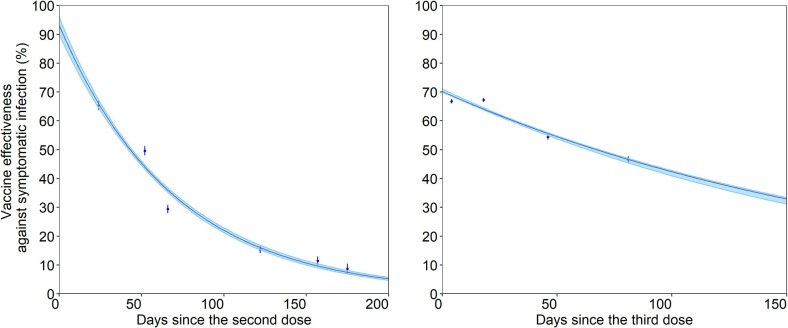
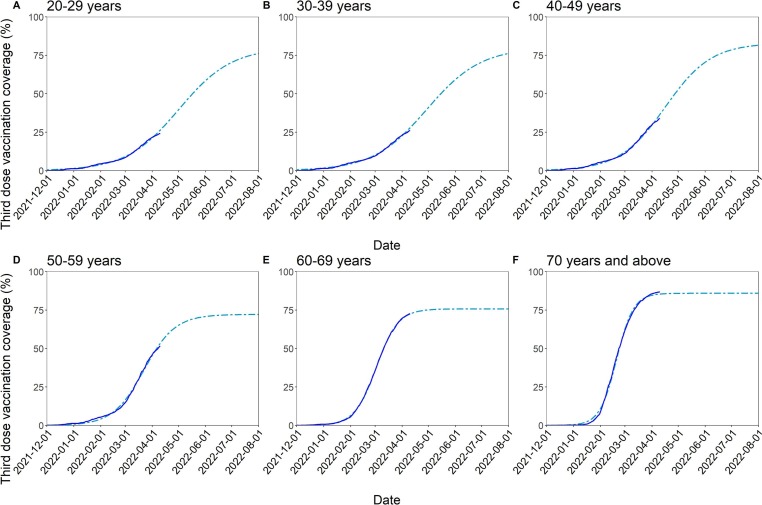
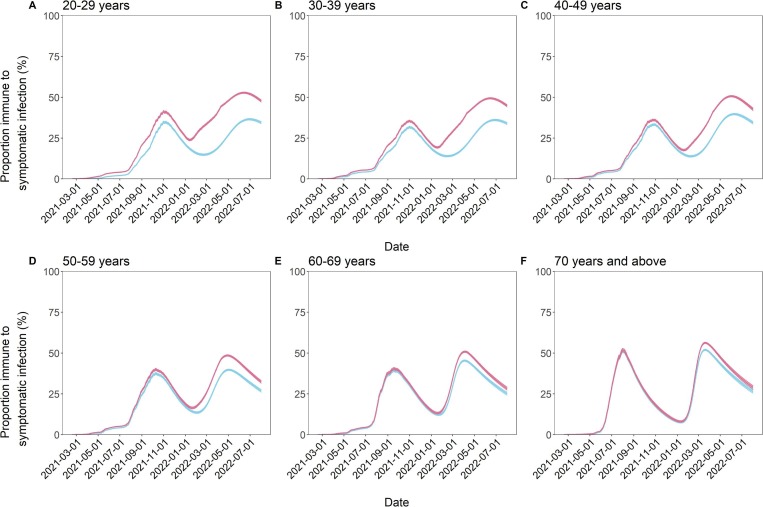
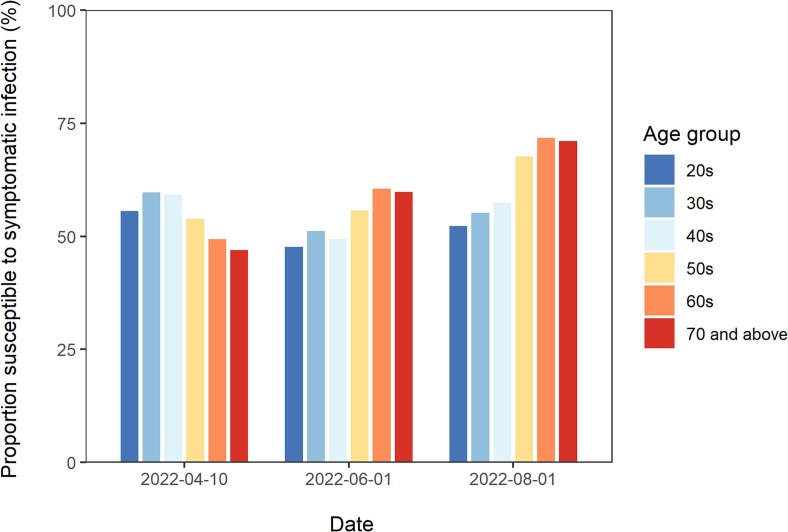
Coronavirus disease 2019 (COVID-19) booster vaccination has been implemented globally in the midst of surges in infection due to the Delta and Omicron variants of severe acute respiratory syndrome coronavirus 2 (SARS-CoV-2). The objective of the present study was to present a framework to estimate the proportion of the population that is immune to symptomatic SARS-CoV-2 infection with the Omicron variant (immune proportion) in Japan, considering the waning of immunity resulting from vaccination and naturally acquired infection. We quantified the decay rate of immunity against symptomatic infection with Omicron conferred by the second and third doses of COVID-19 vaccine. We estimated the current and future vaccination coverage for the second and third vaccine doses from February 17, 2021 to August 1, 2022 and used data on the confirmed COVID-19 incidence from February 17, 2021 to April 10, 2022. From this information, we estimated the age-specific immune proportion over the period from February 17, 2021 to August 1, 2022. Vaccine-induced immunity, conferred by the second vaccine dose in particular, was estimated to rapidly wane. There were substantial variations in the estimated immune proportion by age group because each age cohort experienced different vaccination rollout timing and speed as well as a different infection risk. Such variations collectively contributed to heterogeneous immune landscape trajectories over time and age. The resulting prediction of the proportion of the population that is immune to symptomatic SARS-CoV-2 infection could aid decision-making on when and for whom another round of booster vaccination should be considered. This manuscript was submitted as part of a theme issue on "Modelling COVID-19 and Preparedness for Future Pandemics".
Keywords: Mathematical model; Severe acute respiratory syndrome coronavirus 2 (SARS-CoV-2); Statistical model; Vaccine effectiveness; Waning immunity.
Copyright © 2022 The Author(s). Published by Elsevier Ltd.. All rights reserved.
Conflict of interest statement
Declaration of Competing Interest The authors declare that they have no known competing financial interests or personal relationships that could have appeared to influence the work reported in this paper.
Figures
Similar articles
-
Coronavirus Disease 19 (COVID-19) Vaccine Effectiveness Against Symptomatic Severe Acute Respiratory Syndrome Coronavirus 2 (SARS-CoV-2) Infection During Delta-Dominant and Omicron-Dominant Periods in Japan: A Multicenter Prospective Case-control Study (Factors Associated with SARS-CoV-2 Infection and the Effectiveness of COVID-19 Vaccines Study).Clin Infect Dis. 2023 Feb 8;76(3):e108-e115. doi: 10.1093/cid/ciac635. Clin Infect Dis. 2023. PMID: 35918782 Free PMC article.
-
Effectiveness of BNT162b2 and CoronaVac COVID-19 vaccination against asymptomatic and symptomatic infection of SARS-CoV-2 omicron BA.2 in Hong Kong: a prospective cohort study.Lancet Infect Dis. 2023 Apr;23(4):421-434. doi: 10.1016/S1473-3099(22)00732-0. Epub 2022 Dec 12. Lancet Infect Dis. 2023. PMID: 36521506 Free PMC article.
-
Facing the Omicron variant-how well do vaccines protect against mild and severe COVID-19? Third interim analysis of a living systematic review.Front Immunol. 2022 Aug 24;13:940562. doi: 10.3389/fimmu.2022.940562. eCollection 2022. Front Immunol. 2022. PMID: 36091023 Free PMC article.
-
Effect of mRNA Vaccine Boosters against SARS-CoV-2 Omicron Infection in Qatar.N Engl J Med. 2022 May 12;386(19):1804-1816. doi: 10.1056/NEJMoa2200797. Epub 2022 Mar 9. N Engl J Med. 2022. PMID: 35263534 Free PMC article.
-
Evaluation of Waning of SARS-CoV-2 Vaccine-Induced Immunity: A Systematic Review and Meta-analysis.JAMA Netw Open. 2023 May 1;6(5):e2310650. doi: 10.1001/jamanetworkopen.2023.10650. JAMA Netw Open. 2023. PMID: 37133863 Free PMC article.
Cited by
-
Science-based exit from stringent countermeasures against COVID-19: Mortality prediction using immune landscape between 2021 and 2022 in Japan.Vaccine X. 2024 Aug 12;20:100547. doi: 10.1016/j.jvacx.2024.100547. eCollection 2024 Oct. Vaccine X. 2024. PMID: 39238533 Free PMC article.
-
Assessing exit screening of SARS-CoV-2 in Japan: an analysis of the airport screening data of passengers from the United Kingdom, 2020-2022.BMC Infect Dis. 2024 Sep 12;24(1):962. doi: 10.1186/s12879-024-09894-w. BMC Infect Dis. 2024. PMID: 39267012 Free PMC article.
-
Cost-effectiveness analysis of COVID-19 booster doses and oral antivirals: Case studies in the Indo-Pacific.PLoS One. 2024 Sep 30;19(9):e0294091. doi: 10.1371/journal.pone.0294091. eCollection 2024. PLoS One. 2024. PMID: 39348348 Free PMC article.
-
When should lockdown be implemented? Devising cost-effective strategies for managing epidemics amid vaccine uncertainty.PLoS Comput Biol. 2024 Jul 18;20(7):e1012010. doi: 10.1371/journal.pcbi.1012010. eCollection 2024 Jul. PLoS Comput Biol. 2024. PMID: 39024382 Free PMC article.
-
Understanding factors affecting Chinese medical staff's fear of receiving the fourth dose of COVID-19 vaccine: A cross-sectional study in Taizhou.Hum Vaccin Immunother. 2023 Aug;19(2):2261201. doi: 10.1080/21645515.2023.2261201. Epub 2023 Nov 3. Hum Vaccin Immunother. 2023. PMID: 37920885 Free PMC article.
References
-
- N. Andrews J. Stowe F. Kirsebom S. Toffa T. Rickeard E. Gallagher C. Gower M. Kall N. Groves A.-M. O’Connell D. Simons P.B. Blomquist A. Zaidi S. Nash I.B.A. Aziz N., Thelwall, S., Dabrera, G., Myers, R., Amirthalingam, G., Gharbia, S., Barrett, J.C., Elson, R., Ladhani, S.N., Ferguson, N., Zambon, M., Campbell, C.N.J., Brown, K., Hopkins, S., Chand, M., Ramsay, M., Lopez Bernal, J., Covid-19 Vaccine Effectiveness against the Omicron (B.1.1.529) Variant New England Journal of Medicine 1–15 2022 10.1056/nejmoa2119451. - PMC - PubMed
-
- Antonelli M., Penfold R.S., Merino J., Sudre C.H., Molteni E., Berry S., Canas L.S., Graham M.S., Klaser K., Modat M., Murray B., Kerfoot E., Chen L., Deng J., Österdahl M.F., Cheetham N.J., Drew D.A., Nguyen L.H., Pujol J.C., Hu C., Selvachandran S., Polidori L., May A., Wolf J., Chan A.T., Hammers A., Duncan E.L., Spector T.D., Ourselin S., Steves C.J. Risk factors and disease profile of post-vaccination SARS-CoV-2 infection in UK users of the COVID Symptom Study app: a prospective, community-based, nested, case-control study. Lancet Infect. Dis. 2022;22:43–55. doi: 10.1016/S1473-3099(21)00460-6. - DOI - PMC - PubMed
-
- Bergwerk M., Gonen T., Lustig Y., Amit S., Lipsitch M., Cohen C., Mandelboim M., Levin E.G., Rubin C., Indenbaum V., Tal I., Zavitan M., Zuckerman N., Bar-Chaim A., Kreiss Y., Regev-Yochay G. Covid-19 breakthrough infections in vaccinated health care workers. N. Engl. J. Med. 2021;385:1474–1484. doi: 10.1056/nejmoa2109072. - DOI - PMC - PubMed
-
- Brown C.M., Vostok J., Johnson H., Burns M., Gharpure R., Sami S., Sabo R.T., Hall N., Foreman A., Schubert P.L., Gallagher G.R., Fink T., Madoff L.C., Gabriel S.B., MacInnis B., Park D.J., Siddle K.J., Harik V., Arvidson D., Brock-Fisher T., Dunn M., Kearns A., Laney A.S. Outbreak of SARS-CoV-2 infections, including COVID-19 Vaccine breakthrough infections, associated with large public gatherings — Barnstable County, Massachusetts, July 2021. MMWR Morb. Mortal. Wkly Rep. 2021;70:1059–1062. doi: 10.15585/mmwr.mm7031e2. - DOI - PMC - PubMed
Publication types
MeSH terms
Substances
Supplementary concepts
LinkOut - more resources
Full Text Sources
Medical
Miscellaneous
