

Defining the serum proteomic signature of hepatic steatosis, inflammation, ballooning and fibrosis in non-alcoholic fatty liver disease
- PMID: 36528237
- PMCID: PMC10165617
- DOI: 10.1016/j.jhep.2022.11.029
Defining the serum proteomic signature of hepatic steatosis, inflammation, ballooning and fibrosis in non-alcoholic fatty liver disease
Abstract
Background & aims: Despite recent progress, non-invasive tests for the diagnostic assessment and monitoring of non-alcoholic fatty liver disease (NAFLD) remain an unmet need. Herein, we aimed to identify diagnostic signatures of the key histological features of NAFLD.
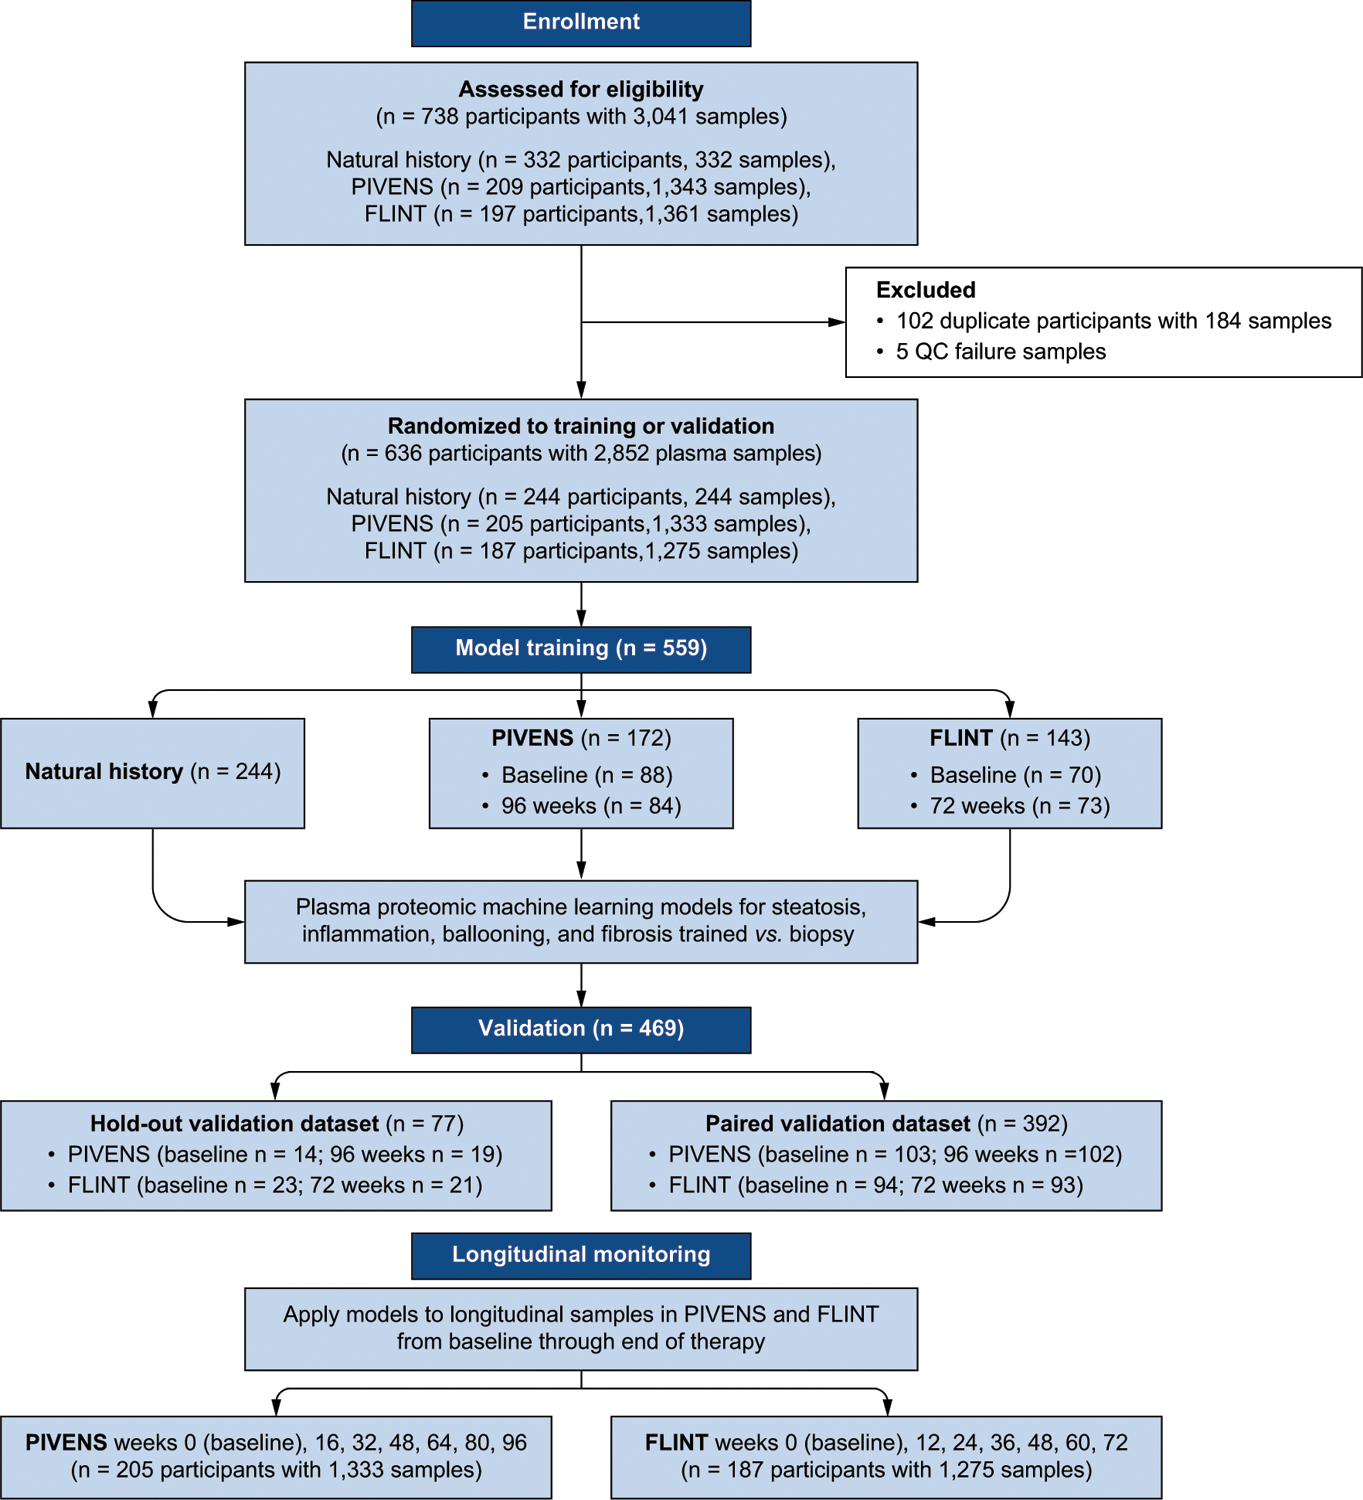
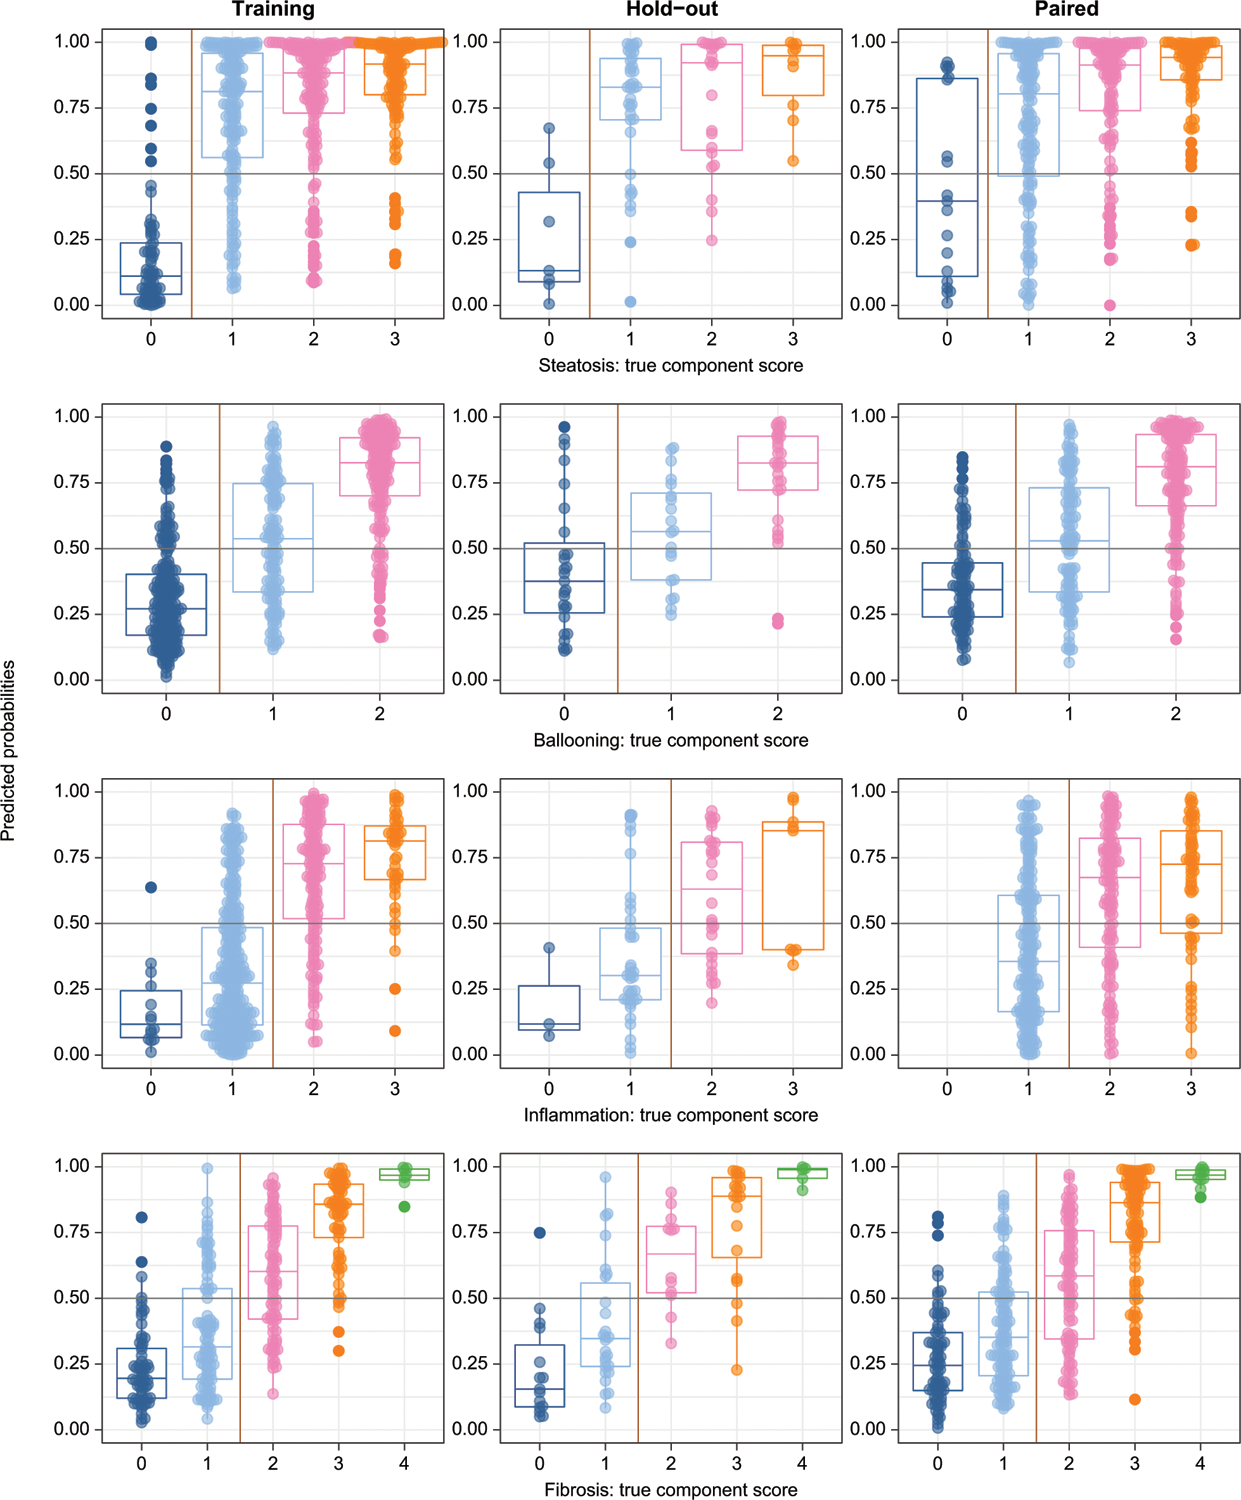
Methods: Using modified-aptamer proteomics, we assayed 5,220 proteins in each of 2,852 single serum samples from 636 individuals with histologically confirmed NAFLD. We developed and validated dichotomized protein-phenotype models to identify clinically relevant severities of steatosis (grade 0 vs. 1-3), hepatocellular ballooning (0 vs. 1 or 2), lobular inflammation (0-1 vs. 2-3) and fibrosis (stages 0-1 vs. 2-4).
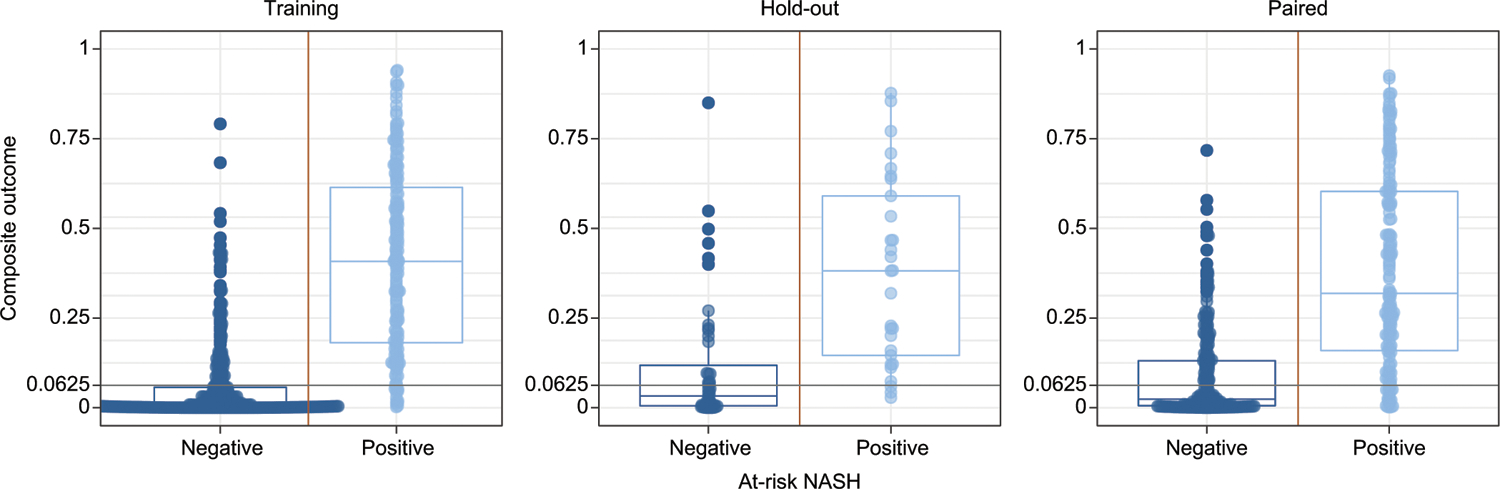
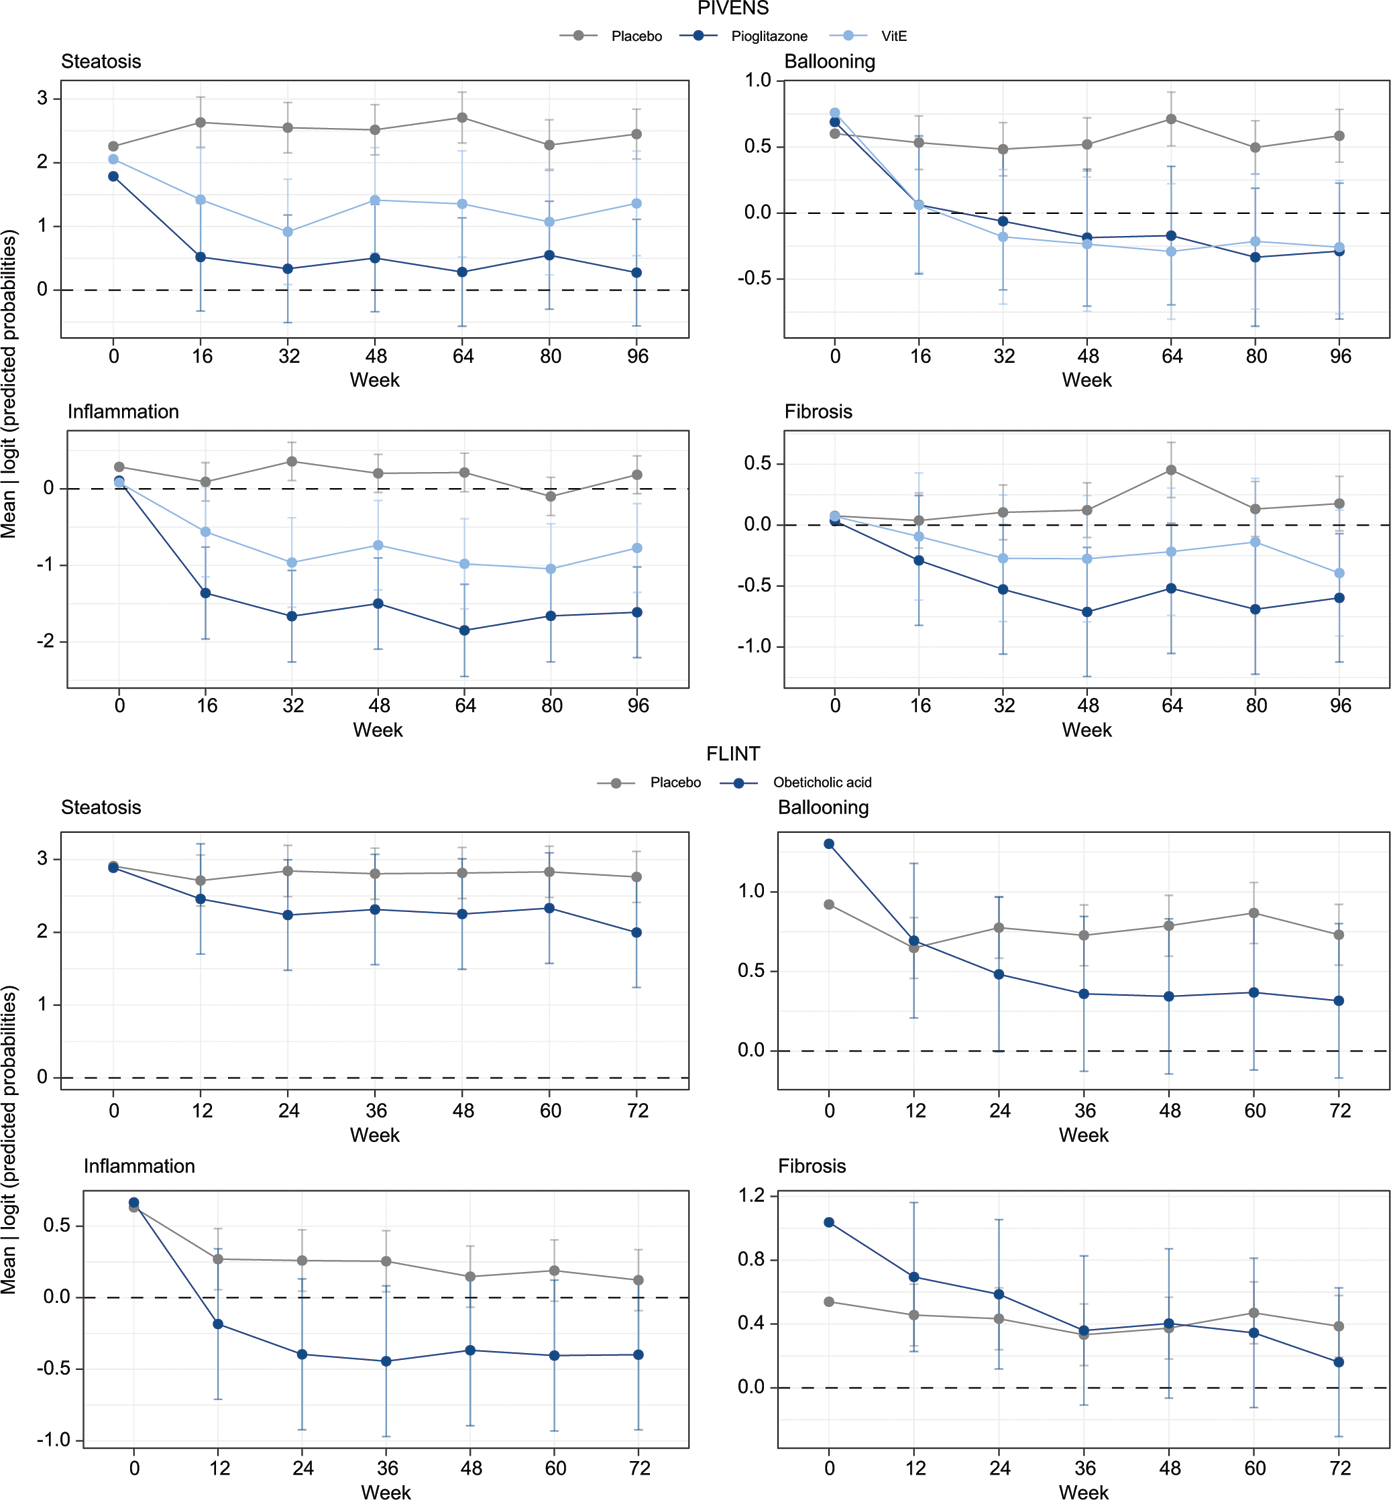
Results: The AUCs of the four protein models, based on 37 analytes (18 not previously linked to NAFLD), for the diagnosis of their respective components (at a clinically relevant severity) in training/paired validation sets were: fibrosis (AUC 0.92/0.85); steatosis (AUC 0.95/0.79), inflammation (AUC 0.83/0.72), and ballooning (AUC 0.87/0.83). An additional outcome, at-risk NASH, defined as steatohepatitis with NAFLD activity score ≥4 (with a score of at least 1 for each of its components) and fibrosis stage ≥2, was predicted by multiplying the outputs of each individual component model (AUC 0.93/0.85). We further evaluated their ability to detect change in histology following treatment with placebo, pioglitazone, vitamin E or obeticholic acid. Component model scores significantly improved in the active therapies vs. placebo, and differential effects of vitamin E, pioglitazone, and obeticholic acid were identified.
Conclusions: Serum protein scanning identified signatures corresponding to the key components of liver biopsy in NAFLD. The models developed were sufficiently sensitive to characterize the longitudinal change for three different drug interventions. These data support continued validation of these proteomic models to enable a "liquid biopsy"-based assessment of NAFLD.
Clinical trial number: Not applicable.
Impact and implications: An aptamer-based protein scan of serum proteins was performed to identify diagnostic signatures of the key histological features of non-alcoholic fatty liver disease (NAFLD), for which no approved non-invasive diagnostic tools are currently available. We also identified specific protein signatures related to the presence and severity of NAFLD and its histological components that were also sensitive to change over time. These are fundamental initial steps in establishing a serum proteome-based diagnostic signature of NASH and provide the rationale for using these signatures to test treatment response and to identify several novel targets for evaluation in the pathogenesis of NAFLD.
Keywords: NAFLD activity score (NAS); Nonalcoholic fatty liver disease (NAFLD); Nonalcoholic steatohepatitis (NASH); aptamers; cirrhosis; fibrosis; fibrosis stage; hepatocellular ballooning; lobular inflammation; proteomics; steatohepatitis; steatosis.
Copyright © 2022. Published by Elsevier B.V.
Conflict of interest statement
Conflict of interest
The authors declare no conflicts of interest that pertain to this work. Please refer to the accompanying ICMJE disclosure forms for further details.
Figures
References
-
- Younossi Z, Tacke F, Arrese M, Chander Sharma B, Mostafa I, Bugianesi E, et al. Global Perspectives on nonalcoholic fatty liver disease and nonalcoholic steatohepatitis. Hepatology (Baltimore, Md) 2019;69:2672–2682. - PubMed
-
- Estes C, Anstee QM, Arias-Loste MT, Bantel H, Bellentani S, Caballeria J, et al. Modeling NAFLD disease burden in China, France, Germany, Italy, Japan, Spain, United Kingdom, and United States for the period 2016–2030. J Hepatol 2018;69:896–904. - PubMed
-
- Chalasani N, Younossi Z, Lavine JE, Charlton M, Cusi K, Rinella M, et al. The diagnosis and management of nonalcoholic fatty liver disease: practice guidance from the American Association for the Study of Liver Diseases. Hepatology 2018;67:328–357. - PubMed
Publication types
MeSH terms
Substances
Grants and funding
- U01 DK130190/DK/NIDDK NIH HHS/United States
- U01 DK061732/DK/NIDDK NIH HHS/United States
- U01 DK061731/DK/NIDDK NIH HHS/United States
- UL1 TR000006/TR/NCATS NIH HHS/United States
- P30 DK120515/DK/NIDDK NIH HHS/United States
- UL1 TR000058/TR/NCATS NIH HHS/United States
- UL1 TR000436/TR/NCATS NIH HHS/United States
- U01 DK061728/DK/NIDDK NIH HHS/United States
- U01 DK061738/DK/NIDDK NIH HHS/United States
- UL1 TR000448/TR/NCATS NIH HHS/United States
- U01 DK061734/DK/NIDDK NIH HHS/United States
- P01 HL147835/HL/NHLBI NIH HHS/United States
- UL1 TR000004/TR/NCATS NIH HHS/United States
- R01 DK106419/DK/NIDDK NIH HHS/United States
- U01 DK061737/DK/NIDDK NIH HHS/United States
- U01 DK061713/DK/NIDDK NIH HHS/United States
- U01 DK061718/DK/NIDDK NIH HHS/United States
- UL1 TR001442/TR/NCATS NIH HHS/United States
- U01 DK061730/DK/NIDDK NIH HHS/United States
- U24 DK061730/DK/NIDDK NIH HHS/United States
- UL1 TR000439/TR/NCATS NIH HHS/United States
- R01 DK124318/DK/NIDDK NIH HHS/United States
- R01 DK121378/DK/NIDDK NIH HHS/United States
- UL1 TR000423/TR/NCATS NIH HHS/United States
- UL1 TR000100/TR/NCATS NIH HHS/United States
