. 2023 Feb 1:266:119813.
doi: 10.1016/j.neuroimage.2022.119813. Epub 2022 Dec 14.

A mean-field model of glutamate and GABA synaptic dynamics for functional MRS

Affiliations

A mean-field model of glutamate and GABA synaptic dynamics for functional MRS

Caroline A Lea-Carnall et al. Neuroimage. .

Abstract

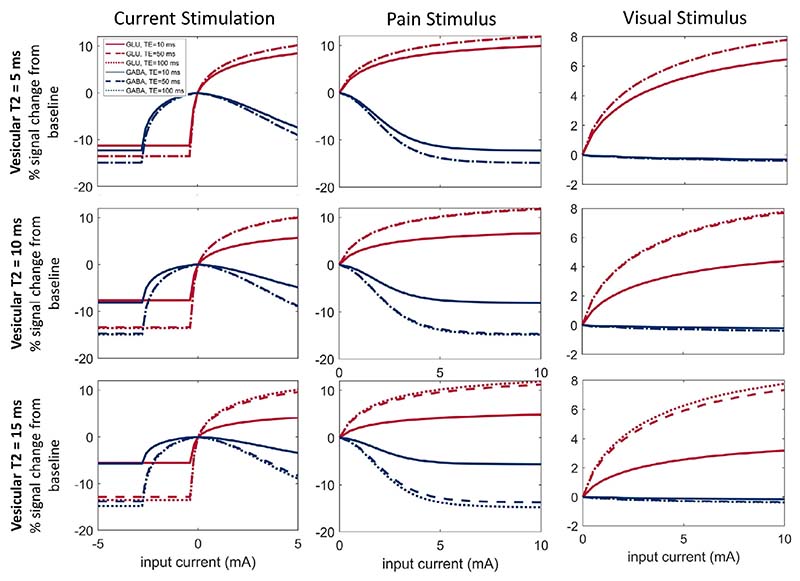
Advances in functional magnetic resonance spectroscopy (fMRS) have enabled the quantification of activity-dependent changes in neurotransmitter concentrations in vivo. However, the physiological basis of the large changes in GABA and glutamate observed by fMRS (>10%) over short time scales of less than a minute remain unclear as such changes cannot be accounted for by known synthesis or degradation metabolic pathways. Instead, it has been hypothesized that fMRS detects shifts in neurotransmitter concentrations as they cycle from presynaptic vesicles, where they are largely invisible, to extracellular and cytosolic pools, where they are detectable. The present paper uses a computational modelling approach to demonstrate the viability of this hypothesis. A new mean-field model of the neural mechanisms generating the fMRS signal in a cortical voxel is derived. The proposed macroscopic mean-field model is based on a microscopic description of the neurotransmitter dynamics at the level of the synapse. Specifically, GABA and glutamate are assumed to cycle between three metabolic pools: packaged in the vesicles; active in the synaptic cleft; and undergoing recycling and repackaging in the astrocytic or neuronal cytosol. Computational simulations from the model are used to generate predicted changes in GABA and glutamate concentrations in response to different types of stimuli including pain, vision, and electric current stimulation. The predicted changes in the extracellular and cytosolic pools corresponded to those reported in empirical fMRS data. Furthermore, the model predicts a selective control mechanism of the GABA/glutamate relationship, whereby inhibitory stimulation reduces both neurotransmitters, whereas excitatory stimulation increases glutamate and decreases GABA. The proposed model bridges between neural dynamics and fMRS and provides a mechanistic account for the activity-dependent changes in the glutamate and GABA fMRS signals. Lastly, these results indicate that echo-time may be an important timing parameter that can be leveraged to maximise fMRS experimental outcomes.

Keywords: FMRS; GABA; Glutamate; Magnetic resonance spectroscopy; Mathematical modelling; Mean field model.


Figures

Fig. 1
Fig. 1. Neurotransmitter cycling
Schematic diagram of generalised NT cycling process as per the kinetic model of Tsodyks and Markram (Tsodyks and Markram, 1997). The presynaptic cell is shown in pink and the postsynaptic in blue. Steady state (top): the presynaptic cell fires an action potential releasing NT (GABA or Glu) into the cleft. NT is characterised as belonging to one of three states: NT in the vesicular pool (R), where the NT is packaged in the vesicles ready to be released into the cleft upon activation; NT in the extracellular space (X), where it has been released into the cleft and is acting at receptor sites on the postsynaptic cell; and NT in the cytosolic pool (N), is awaiting repackaging into the vesicles. Decreased firing (left): if the firing rate is reduced, the NT will start to accumulate in the vesicles due to the mismatch between the rate of exocytosis and the rate of repackaging into the vesicles. A shift of NT from the cytosol to the vesicles will result in a decreased MRS signal as we assume the vesicular compartment is largely invisible to MRS. Increased firing (right): if the firing rate increases, then NT from the vesicles will be used more quickly. Upon exocytosis it will transfer rapidly from the cleft to the cytosol and start to accumulate there. A shift of NT from the vesicles to the ECS and the cytosol will result in an increased MRS signal under the current hypothesis.
Fig. 2
Fig. 2. Schematic of the mean-field model
The MFM is intended to approximately represent a generic cortical MRS voxel. It consists of an excitatory (E) and inhibitory (I) population representing the averaged activity of billions of cells. These are both self and inter-connected via the weights ωEE, ωII, ωEI, ωIE. All connection strengths are fixed. Inhibitory connections are mediated via GABA receptors and excitatory connections via AMPA receptors.
Fig. 3
Fig. 3. Effect of firing rate and amplitude of firing on NT cycling dynamics
The proportion of neurotransmitter (averaged over 100 s of simulation) found in the vesicular pool (left, R), the ECS (middle, X), and the cytosolic pool (right, N) is presented as a function of firing rate and neural synchrony (amplitude). As the firing rate increases, the NT concentration shifts from the vesicles to the ECS and cytosolic compartments. If vesicular NT is invisible to MRS then this would be reflected as an increase in the MRS signal. Additionally, the amplitude of the input signal was varied between 0.5 (light blue), 1 (dark blue) and 2 (purple); we found that increasing the amplitude enhanced the shift of NT from the vesicular to the ECS and cytosolic pools for the same firing rate whereas reducing the amplitude inhibited this effect.
Fig. 4
Fig. 4. Effect of τr on vesicle refilling times.
The effect of τr on the refilling time of the vesicular pool. Here τr is varied between 1000 and 5000 ms and the time course of the vesicular pool to reach its steady state value (from empty) is shown. We fix the value of τr to be 1800 ms for the following simulations which results in refilling of the pool in approximately 10 seconds in line with (Stevens and Tsujimoto, 1995) using a firing rate of 10 spikes s−1.
Fig. 5
Fig. 5. Temporal dynamics of NT concentrations in response to polarity-specific current stimulation
We assess the effect of applying an input current on the NT dynamics within each pool and describe the expected effect on the resulting MRS signal assuming that the vesicular compartment is MR-invisible. Left panels: the network is allowed to run for 30 seconds so as to reach steady-state and then the excitatory stimulus (IextE=2mA) was applied for the remaining duration of the simulation (see coloured bars). In the case of the excitatory population (orange), we observe a shift of Glu from the vesicles to the cytosolic pool indicating an increased Glu MRS signal. In the case of the inhibitory population (blue), we observe the opposite effect in that GABA accumulates in the vesicles and is reduced in the cytosolic compartment. This would be reflected as a reduction in the GABA MRS signal in this condition. Note only 10 s of pre-stimulus activity is shown here. Right panels: an inhibitory current is applied in the same way (IextE=2mA), causing the percentage of Glu and GABA in the vesicular pools to increase with a corresponding decrease in the cytosolic pool. The effect of this would be a reduction in both the Glu and GABA MRS signals.
Fig. 6
Fig. 6. Effect of polarity-specific current stimulation on mean NT concentrations in each pool
We evaluate the proportion of Glu (red) and GABA (blue) in each of the three pools in response to current stimulation averaged over the 30 s of the simulation for a range of positive and negative currents. We note that the x-axis refers to the excitatory input current IextE. Inhibitory (negative) current reduces GABA and Glu in the cytosolic pool, and increases them in the vesicles. Excitatory (positive) current reduces GABA and increases Glu in cytosolic pools, and has the opposite effect in the vesicles. The direction and magnitude of the change in the cytosol coincide with the direction and magnitude of change of the empirically measured GABA and Glu-MRS: inhibitory current reduces both neurotransmitters, while excitatory current decreases GABA and increases Glu. We conclude that the observed MRS concentrations and changes reflect the dynamics of the neurotransmitters within the cytosol and ECS, while their passage through the vesicles remains invisible to MR. Concentrations in the ECS appear negligible due to their rapid clearance rate. Vertical dashed lines indicate the specific current values of Fig. 5 (IextE=±2mA).
Fig. 7
Fig. 7. Model predictions for pain, visual, and current stimulation
We stimulate the model with the 3 input types: tDCS (left), Pain (middle), and Vision (right). Top panel: the percentage of total NT in the ’visible’ pool (ECS and cytosol). Lower panel: we calculate the predicted MRS signal (ST using the ’Observation Model’) as a weighted sum of NT from each compartment. ST is calculated using specific T2 values assigned to NT within each compartment with an assumed TE of 30 ms for Glu and 68 ms for GABA (see Table 1 for a list of all parameters). Results are expressed as a percentage difference from the baseline case, where IextE=0mA. For sensory stimulation (pain and vision), we only consider input currents greater than 5 as that is the minimum input current required to elicit cell firing in this model.
Fig. 8
Fig. 8. Effect of vesicular T2 and TE
We recreate Fig. 7 (lower panel) with different values for TE and assumed values for vesicular T2. Each column relates to the stimulation type, described as before: left, tDCS; middle, pain; right, visual. The top row assumes vesicular T2 to be 5 ms, the middle row 10 ms, and the lower row 15 ms. Echo times used are 10 ms (solid lines) and 50 (dashed lines), and 100 ms (dotted lines indistinguishable from TE = 50 ms for vesicular T2 less than 15 ms).

References

    1. Abbott LF, Chance FS. Drivers and modulators from push-pull and balanced synaptic input. Prog Brain Res. 1995;149:147–155. doi: 10.1016/S0079-6123(05)49011-1. - DOI - PubMed
    1. An H, Lin W. Spin Density, T1, T2, T2 ∗ Relaxation and Bloch Equations. Current Protocols in Magnetic Resonance Imaging. 2001;00:B3.1.1–B3.1.10. doi: 10.1002/0471142719.mib0301s00. - DOI
    1. Apšvalka D, Gadie A, Clemence M, Mullins PG. Event-related dynamics of glutamate and BOLD effects measured using functional magnetic resonance spectroscopy (fMRS) at 3T in a repetition suppression paradigm. Neuroimage. 2015;118:292–300. doi: 10.1016/j.neuroimage.2015.06.015. - DOI - PubMed
    1. Bachtiar V, Near J, Johansen-Berg H, Stagg CJ. Modulation of GABA and resting state functional connectivity by transcranial direct current stimulation. eLife. 2015;4:e08789. doi: 10.7554/eLife.08789. - DOI - PMC - PubMed
    1. Barbour B, Häusser M. Intersynaptic diffusion of neurotransmitter. Trends in Neurosciences. 1997 Sep;20(9):377–384. doi: 10.1016/s0166-2236(96)20050-5. - DOI - PubMed

Publication types

MeSH terms