. 2022 Dec 1:12:1022511.
doi: 10.3389/fcimb.2022.1022511. eCollection 2022.

Sodium houttuyfonate effectively treats acute pulmonary infection of Pseudomonas aeruginosa by affecting immunity and intestinal flora in mice

Affiliations

Sodium houttuyfonate effectively treats acute pulmonary infection of Pseudomonas aeruginosa by affecting immunity and intestinal flora in mice

Tian Zhuang et al. Front Cell Infect Microbiol. .

Abstract

Introduction: Pseudomonas aeruginosa is a major nosocomial pathogen that frequently causes ventilator-associated pneumonia in specific populations. Sodium houttuyfonate (SH) has shown mild antibacterial activity against P. aeruginosa in vitro, but the mechanism of potent antimicrobial activity of SH against P. aeruginosa infection in vivo remains unclear.

Methods: Here, using the mouse pneumonia model induced by P. aeruginosa nasal drip to explore the therapeutic effects of SH.

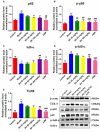
Results: We found that SH exhibits dose-dependent therapeutic effects of reducing P. aeruginosa burden and systemic inflammation in pneumonia mice. SH ameliorates inflammatory gene expression and production of inflammatory proteins, such as interleukin-6 (IL-6), nuclear factor kappa-B (NF-κB) and toll-like receptor 4 (TLR4), associated with the TLR4/NF-κB pathway in mice with P. aeruginosa pneumonia. Furthermore, we analyzed the intestinal flora of mice and found that compared with the model group, the abundance and diversity of beneficial bacterial flora of SH treatment groups increased significantly, suggesting that SH can improve the intestinal flora disorder caused by inflammation. In addition, SH improves alpha and beta diversity index and reduces species abundance differences of intestinal flora in pneumonia mice.

Discussion: Taken together, our presented results indicate that SH may effectively alleviate the acute pulmonary infection induced by P. aeruginosa by reducing the disturbance of regulating immunity and intestinal flora in mice.

Keywords: Pseudomonas aeruginosa; Sodium houttuyfonate; TLR4/NF-κB pathway; inflammatory factor; intestinal flora.


Conflict of interest statement

The authors declare that the research was conducted in the absence of any commercial or financial relationships that could be construed as a potential conflict of interest.

Figures
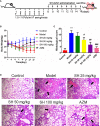
Figure 1
Figure 1
SH ameliorates histopathological changes in the lungs of mice induced by P. aeruginosa. (A) Experimental design of P. aeruginosa administration in pneumonia mice and SH treatment. (B) comparison of body weight of different treatment groups. (C) Histological scores. (D) Observe the pathological changes in the lung tissues of the mice by HE staining (×40 magnification). Scale bar, 20 µm. Arrows indicate reduced alveolar air space and infiltration of inflammatory cells. Data are represented as mean ± SD (n=3). ***P<0.001 mean significance of model group compared with control group. #P<0.05, ##P<0.01 and ###P<0.001 mean significance of drug treatments compared with the model group.
Figure 2
Figure 2
SH reduces P. aeruginosa burden and systemic inflammation in pneumonia mice. (A) The homogenized culture of mice lung tissue at different treatment after P. aeruginosa infection. (B) The number of viable P. aeruginosa isolated from the lung of mice. (C) Spleen index. (D) Serum IL-6, (E) CXCL1 and (F) IL-17 amounts were assessed by ELISA. Data are represented as mean ± SD (n=9). ***P<0.001 mean significance of model group compared with control group. #P<0.05, ##P<0.01 and ###P<0.001 mean significance of drug treatments compared with the model group.
Figure 3
Figure 3
The expression of inflammatory genes in pneumonia mice after SH treatment. (A) TLR4. (B) TNF-α. (C) NF-κB. (D) IL-1β. (E) IFN-γ. (F) IL-10. Data are represented as mean ± SD (n=6). **P<0.01 and ***P<0.001 mean significance of model group compared with control group. #P<0.05, ##P<0.01 and ###P<0.001 mean significance of drug treatments compared with the model group.
Figure 4
Figure 4
The expression of inflammatory proteins in pneumonia mice after SH treatment. (A) p65. (B) p-p65. (C) IκB-α. (D) p-IκB-α. (E) TLR4. (F) The expression of proteins. Staining intensity was assessed with Image J. Data are represented as mean ± SD (n=3). **P<0.01 and ***P<0.001 mean significance of model group compared with control group. #P<0.05, ##P<0.01 and ###P<0.001 mean significance of drug treatments compared with the model group.
Figure 5
Figure 5
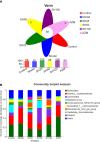
Analysis of species composition of gut microbiota. (A) Venn diagram: Different colors represent different populations (or samples), overlapping portions represent species common to multiple populations (or samples), non-overlapping portions represent species-specific to that population (or sample), and numbers indicate the corresponding number of species. (B) Community barplot histogram at genus level. Control group represents the control group without any treatment, Model, P. aeruginosa without any drug treatment. SH25, SH50 and SH100 mean SH 25 mg/kg, SH 50 mg/kg and SH 100 mg/kg.
Figure 6
Figure 6
Alpha diversity analysis of gut microbiota. (A) Chao diversity index histogram. (B) Chao diversity test group t-test histogram. The X axe represents the group name, and The Y axe represents the exponential average of each group. *0.001<P ≤ 0.05, **0.001<P ≤ 0.01, ***P ≤ 0.001. SH25, SH50 and SH100 mean SH 25 mg/kg, SH 50 mg/kg and SH 100 mg/kg.
Figure 7
Figure 7
Analysis of comparison of gut microflora samples. (A) Sample distances heatmap on Genus level: The X and Y axes are samples, and the distance between samples is represented by different color gradients (the right side of the figure is the value represented by the color gradient). (B) Bray_Curtis analysis of similarities: The X axe represents the distance value within or Between groups, The Y axe represents the distance value, the box corresponding to Between represents the distance value Between groups, and the other boxes represent the distance value within the group, to analyze the explanation degree of different grouping factors for sample differences. (C) Partial least-squares discriminant analysis: Dots of different colors or shapes represent sample populations in different environments or conditions. The scale of the X and Y axes is relative distance and has no practical significance. Comp1 and Comp2 represent the suspected influencing factors of microbial composition bias of the two groups of samples, respectively. Kruskal-Wallis H-test bar plot analysis of differences in the abundance of intestinal flora species. (D) The vertical axis represents the species names at a taxonomic level. The column lengths corresponding to species indicate the average relative abundance of species in each sample group, and the different colors indicate the different groupings. **0.001<P ≤ 0.01. SH25, SH50 and SH100 mean SH 25 mg/kg, SH 50 mg/kg and SH 100 mg/kg.
Figure 8
Figure 8
Multilevel species hierarchy tree diagram for LEfSe analysis. Different color nodes represent the microbial groups that are significantly enriched in the corresponding groups and significantly influence the differences between groups. The pale yellow nodes indicate the microbial groups that have no significant difference among different groups or have no significant effect on the difference between groups. SH25, SH50 and SH100 mean SH 25 mg/kg, SH 50 mg/kg and SH 100 mg/kg.
Figure 9
Figure 9
Schematic diagram of the possible mechanism of sodium hottuyfonate against acute pulmonary infection by P. aeruginosa. SH can regulate the immune and intestinal flora disorders of mice through TLR4/NF-κB signaling pathway, and effectively alleviate acute lung infection caused by P. aeruginosa.

References

    1. Alipour M., Omri A., Lui E. M., Suntres Z. E. (2013). Co-Administration of aqueous ginseng extract with tobramycin stimulates the pro-inflammatory response and promotes the killing of pseudomonas aeruginosa in the lungs of infected rats. Can. J. Physiol. Pharmacol. 91 (11), 935–940. doi: 10.1139/cjpp-2013-0073 - DOI - PubMed
    1. Allewelt M., Coleman F. T., Grout M., Priebe G. P., Pier G. B. (2000). Acquisition of expression of the pseudomonas aeruginosa ExoU cytotoxin leads to increased bacterial virulence in a murine model of acute pneumonia and systemic spread. Infect. Immun. 68 (7), 3998–4004. doi: 10.1128/iai.68.7.3998-4004.2000 - DOI - PMC - PubMed
    1. Bernasconi E., Pattaroni C., Koutsokera A., Pison C., Kessler R., Benden C., et al. . (2016). Airway microbiota determines innate cell inflammatory or tissue remodeling profiles in lung transplantation. Am. J. Respir. Crit. Care Med. 194 (10), 1252–1263. doi: 10.1164/rccm.201512-2424OC - DOI - PubMed
    1. Chen G., Zhang W., Kong L., Wang C., Lai X., Yu X., et al. . (2022). Qiguiyin decoction improves multidrug-resistant pseudomonas aeruginosa infection in rats by regulating inflammatory cytokines and the TLR4/MyD88/NF-κB signaling pathway. BioMed. Res. Int. 2022, 5066434. doi: 10.1155/2022/5066434 - DOI - PMC - PubMed
    1. Chen F., Zhu X., Sun Z., Ma Y. (2018). Astilbin inhibits high glucose-induced inflammation and extracellular matrix accumulation by suppressing the TLR4/MyD88/NF-κB pathway in rat glomerular mesangial cells. Front. Pharmacol. 9. doi: 10.3389/fphar.2018.01187 - DOI - PMC - PubMed

Publication types

LinkOut - more resources