

One-carbon pathway metabolites are altered in the plasma of subjects with Down syndrome: Relation to chromosomal dosage
- PMID: 36530924
- PMCID: PMC9751312
- DOI: 10.3389/fmed.2022.1006891
One-carbon pathway metabolites are altered in the plasma of subjects with Down syndrome: Relation to chromosomal dosage
Erratum in
-
Corrigendum: One-carbon pathway metabolites are altered in the plasma of subjects with Down syndrome: relation to chromosomal dosage.Front Med (Lausanne). 2024 Jun 18;11:1432559. doi: 10.3389/fmed.2024.1432559. eCollection 2024. Front Med (Lausanne). 2024. PMID: 38957303 Free PMC article.
Abstract
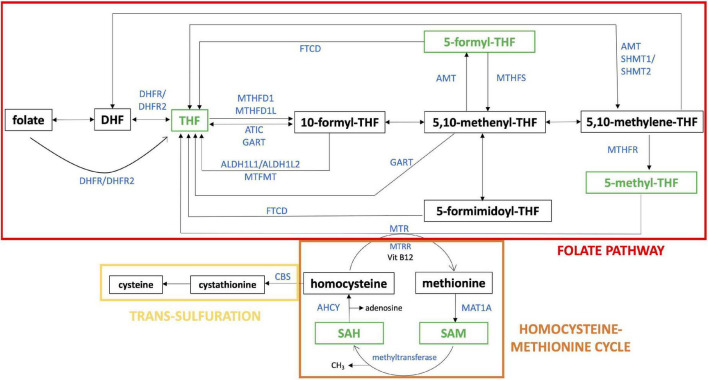
Introduction: Down syndrome (DS) is the most common chromosomal disorder and it is caused by trisomy of chromosome 21 (Hsa21). Subjects with DS show a large heterogeneity of phenotypes and the most constant clinical features present are typical facies and intellectual disability (ID). Several studies demonstrated that trisomy 21 causes an alteration in the metabolic profile, involving among all the one-carbon cycle.
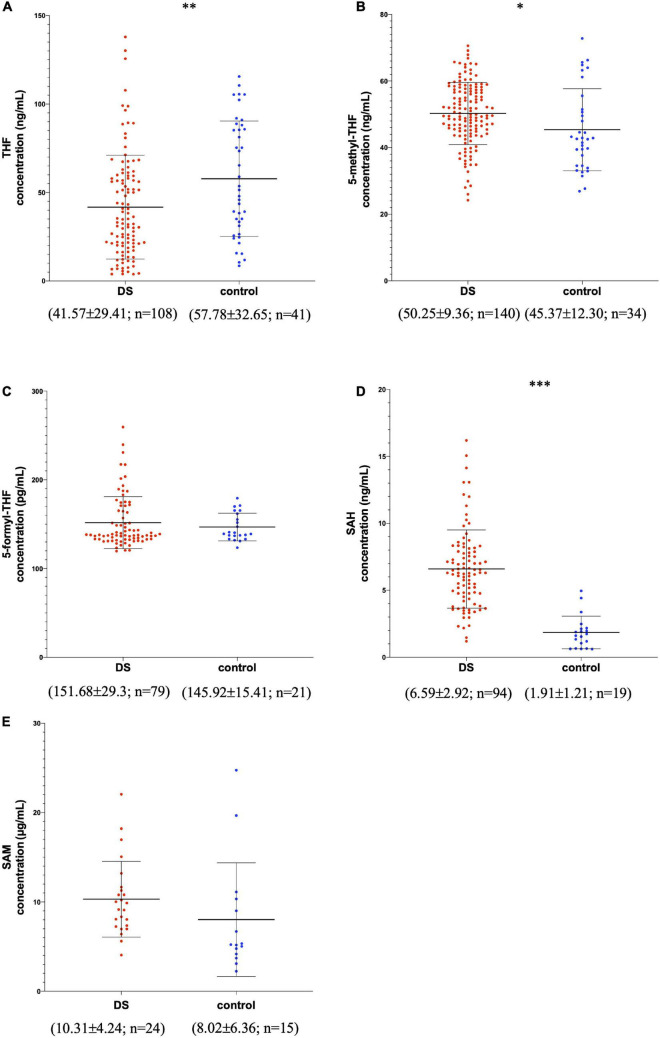
Methods: We performed enzyme-linked immunosorbent assays (ELISAs) to identify the concentration of 5 different intermediates of the one-carbon cycle in plasma samples obtained from a total of 164 subjects with DS compared to 54 euploid subjects. We investigated: tetrahydrofolate (THF; DS n = 108, control n = 41), 5-methyltetrahydrofolate (5-methyl-THF; DS n = 140, control n = 34), 5-formyltetrahydrofolate (5-formyl-THF; DS n = 80, control n = 21), S-adenosyl-homocysteine (SAH; DS n = 94, control n = 20) and S-adenosyl-methionine (SAM; DS n = 24, control n = 15).
Results: Results highlight specific alterations of THF with a median concentration ratio DS/control of 2:3, a decrease of a necessary molecule perfectly consistent with a chromosomal dosage effect. Moreover, SAM and SAH show a ratio DS/control of 1.82:1 and 3.6:1, respectively.
Discussion: The relevance of these results for the biology of intelligence and its impairment in trisomy 21 is discussed, leading to the final proposal of 5-methyl-THF as the best candidate for a clinical trial aimed at restoring the dysregulation of one-carbon cycle in trisomy 21, possibly improving cognitive skills of subjects with DS.
Keywords: Down syndrome; chromosomal dosage; folates; one-carbon pathway; trisomy 21.
Copyright © 2022 Vione, Ramacieri, Zavaroni, Piano, La Rocca, Caracausi, Vitale, Piovesan, Gori, Pirazzoli, Strippoli, Cocchi, Corvaglia, Locatelli, Pelleri and Antonaros.
Conflict of interest statement
The authors declare that the research was conducted in the absence of any commercial or financial relationships that could be construed as a potential conflict of interest.
Figures
References
-
- Down JL. Observations on an ethnic classification of idiots. 1866. London Hosp Rep. (1866) 3:259–62. - PubMed
-
- Lejeune J, Gautier M, Turpin R. [Study of somatic chromosomes from 9 mongoloid children]. C R Hebd Seances Acad Sci. (1959) 248:1721–2. - PubMed
-
- Lejeune J. [Biochemical investigations and trisomy 21 (author’s transl)]. Ann Genet. (1979) 22:67–75. - PubMed
LinkOut - more resources
Full Text Sources