. 2022 Dec 9:2022:7727616.
doi: 10.1155/2022/7727616. eCollection 2022.

Inhibition of Prostaglandin E2 Receptor EP3 Attenuates Oxidative Stress and Neuronal Apoptosis Partially by Modulating p38MAPK/FOXO3/Mul1/Mfn2 Pathway after Subarachnoid Hemorrhage in Rats

Affiliations

Inhibition of Prostaglandin E2 Receptor EP3 Attenuates Oxidative Stress and Neuronal Apoptosis Partially by Modulating p38MAPK/FOXO3/Mul1/Mfn2 Pathway after Subarachnoid Hemorrhage in Rats

Yu Liu et al. Oxid Med Cell Longev. .

Abstract

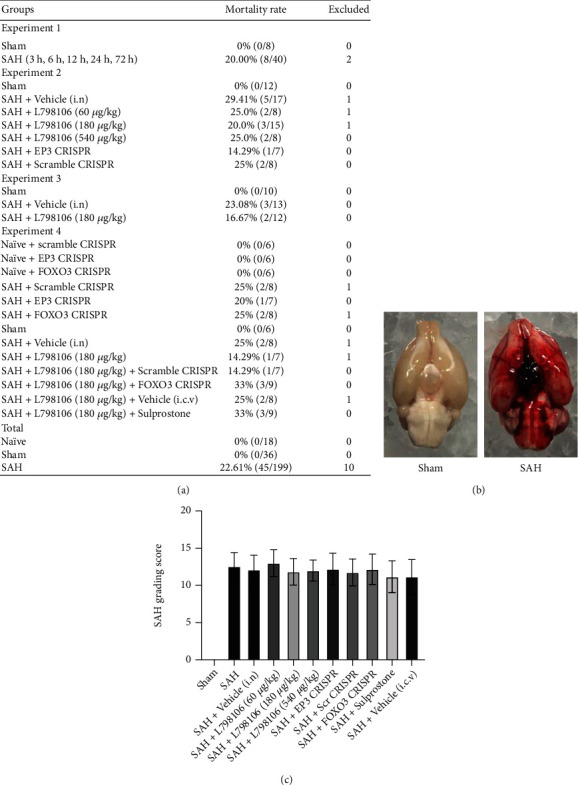
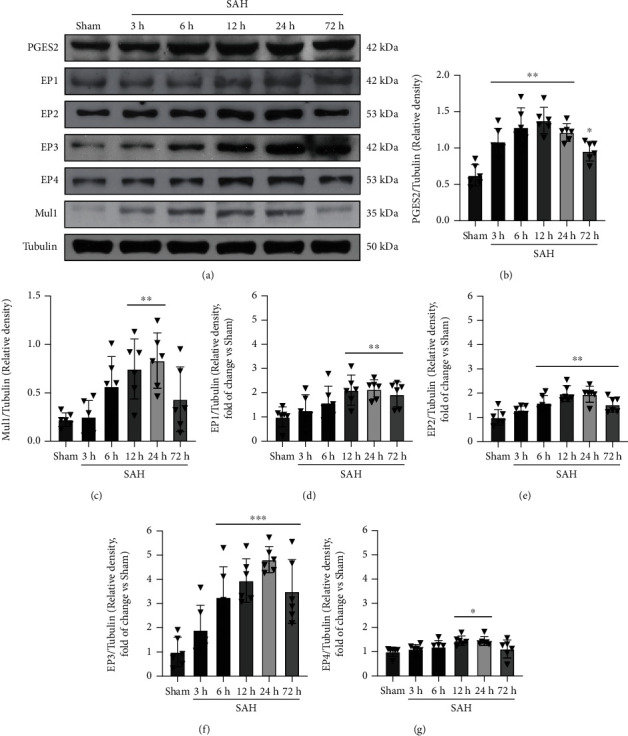
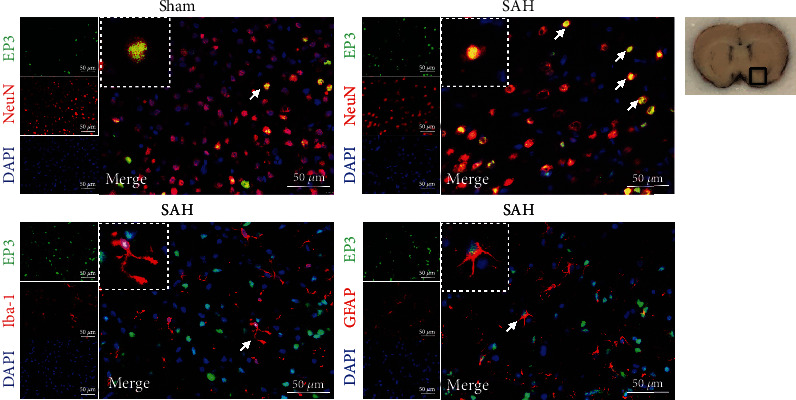
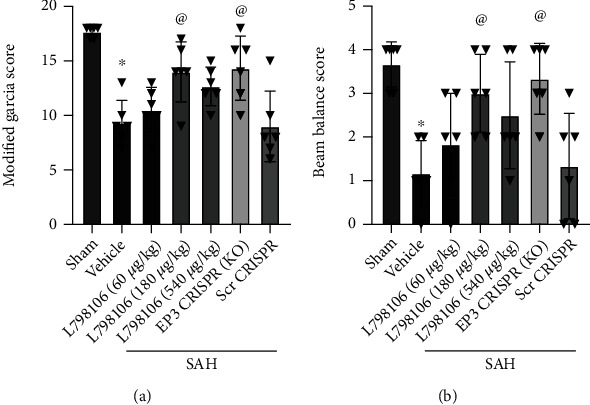
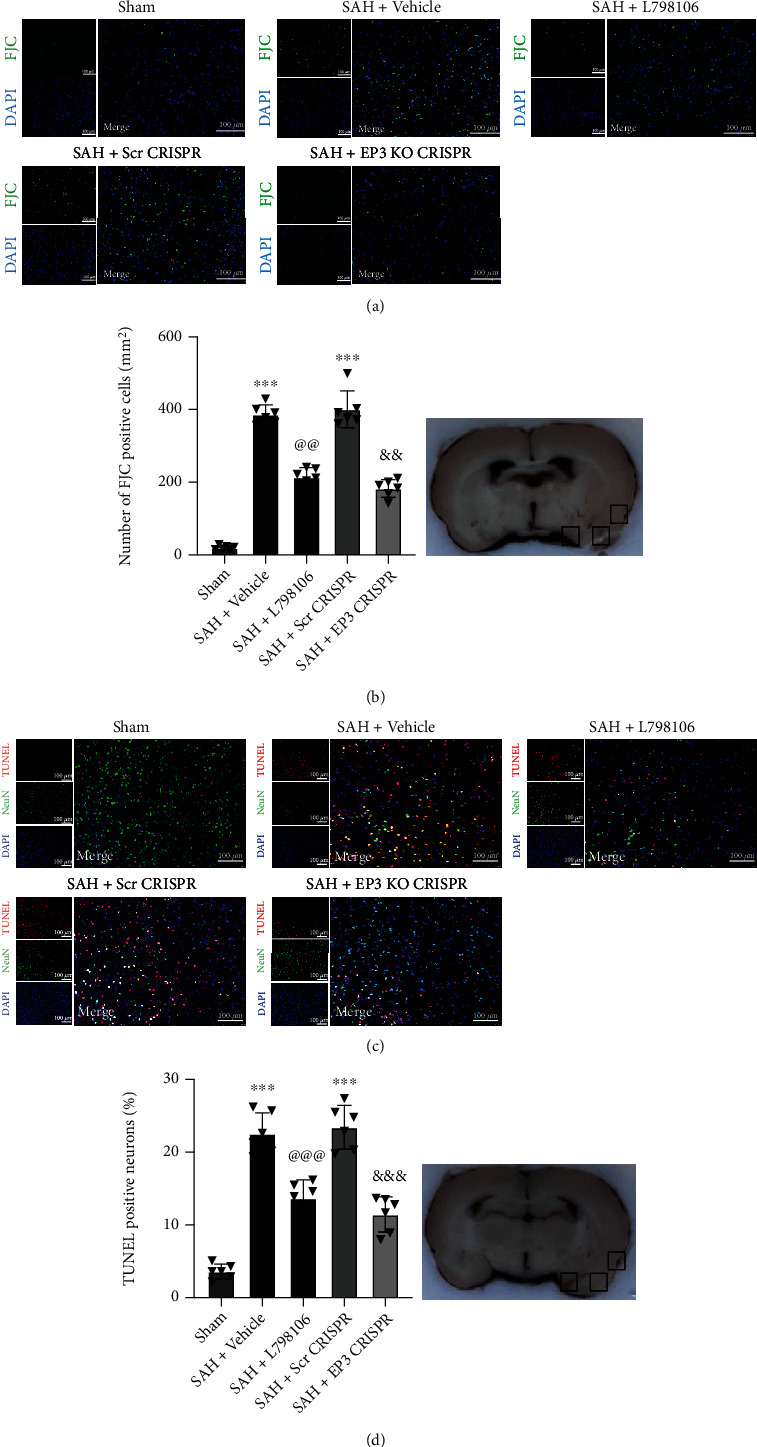
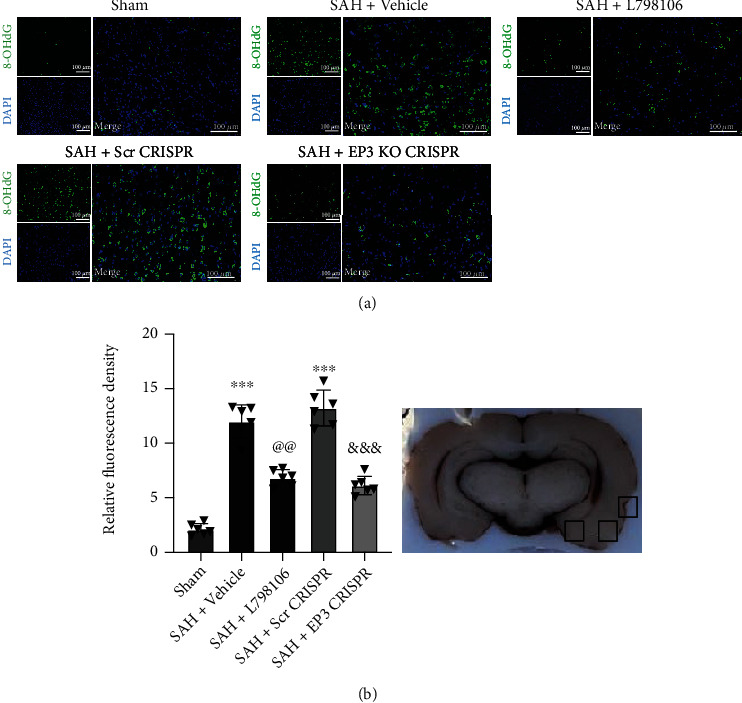
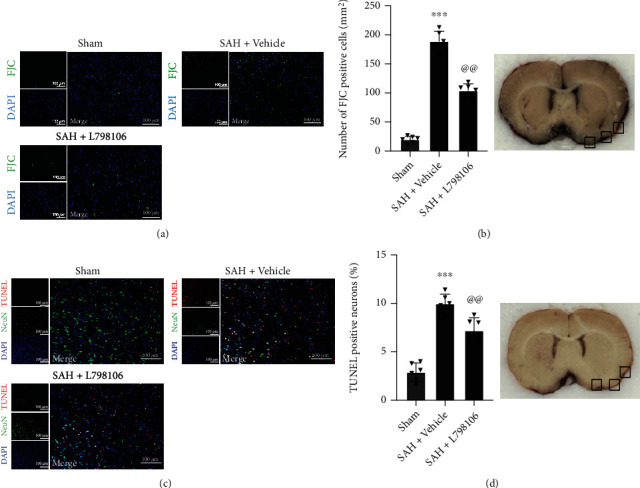
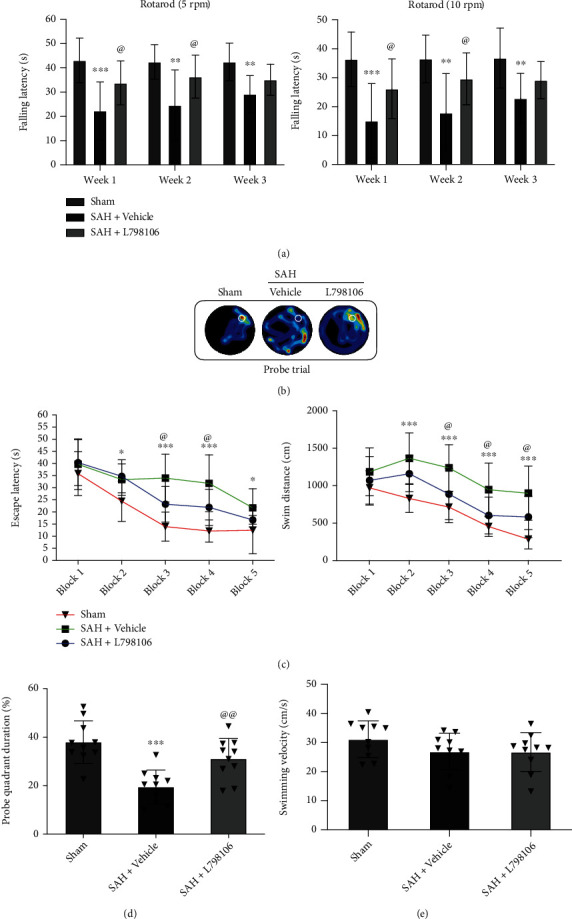
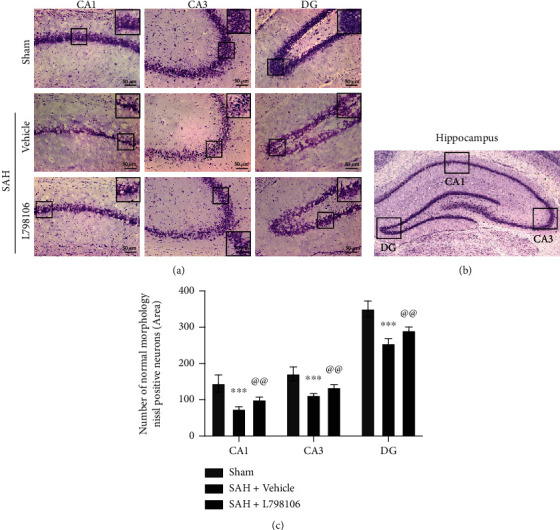
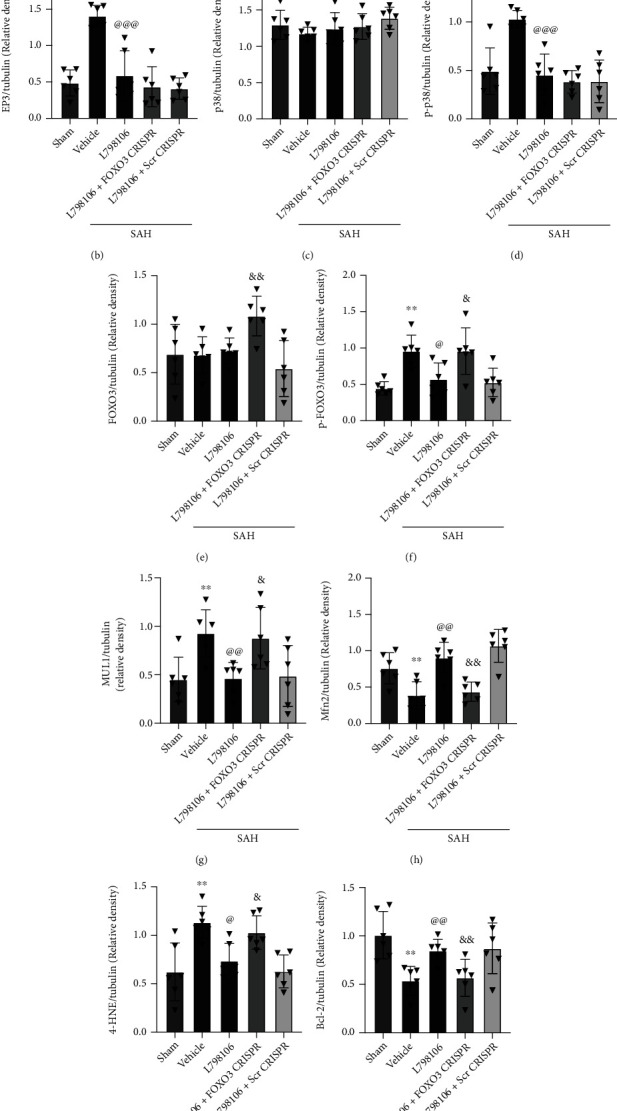
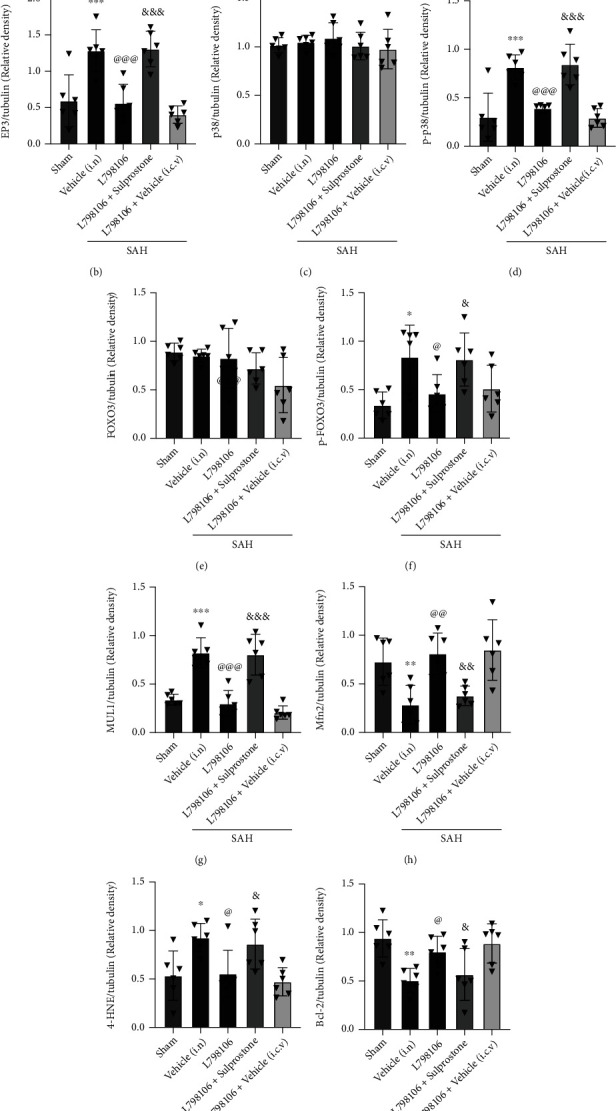
Oxidative stress and neuronal apoptosis contribute to pathological processes of early brain injury (EBI) after subarachnoid hemorrhage (SAH). Previous studies demonstrated that the inhibition of prostaglandin E2 receptor EP3 suppressed oxidative stress and apoptotic effects after Alzheimer's disease and intracerebral hemorrhage. This study is aimed at investigating the antioxidative stress and antiapoptotic effect of EP3 inhibition and the underlying mechanisms in a rat mode of SAH. A total of 263 Sprague-Dawley male rats were used. SAH was induced by endovascular perforation. Selective EP3 antagonist L798106 was administered intranasally at 1 h, 25 h, and 49 h after SAH induction. EP3 knockout CRISPR and FOXO3 activation CRISPR were administered intracerebroventricularly at 48 h prior to SAH, while selective EP3 agonist sulprostone was administered at 1 h prior to SAH. SAH grade, neurological deficits, western blots, immunofluorescence staining, Fluoro-Jade C staining, TUNEL staining, 8-OHdG staining, and Nissl staining were conducted after SAH. The expression of endogenous PGES2 increased and peaked at 12 h while the expression of EP1, EP2, EP3, EP4, and Mul1 increased and peaked at 24 h in the ipsilateral brain after SAH. EP3 was expressed mainly in neurons. The inhibition of EP3 with L798106 or EP3 KO CRISPR ameliorated the neurological impairments, brain tissue oxidative stress, and neuronal apoptosis after SAH. To examine potential downstream mediators of EP3, we examined the effect of the increased expression of activated FOXO3 following the administration of FOXO3 activation CRISPR. Mechanism studies demonstrated that L798106 treatment significantly decreased the expression of EP3, p-p38, p-FOXO3, Mul1, 4-HNE, Bax, and cleaved caspase-3 but upregulated the expression of Mfn2 and Bcl-2 in SAH rats. EP3 agonist sulprostone or FOXO3 activation CRISPR abolished the neuroprotective effects of L798106 and its regulation on expression of p38MAPK/FOXO3/Mul1/Mfn2 in the ipsilateral brain after SAH. In conclusion, the inhibition of EP3 by L798106 attenuated oxidative stress and neuronal apoptosis partly through p38MAPK/FOXO3/Mul1/Mfn2 pathway post-SAH in rats. EP3 may serve as a potential therapeutic target for SAH patients.


Conflict of interest statement

The authors declare that they have no conflict of interest.

Figures

Figure 1
Figure 1
Mortality rate and subarachnoid hemorrhage (SAH) grade. (a) The number of mortality and excluded animals in each group. (b) Representative image of SAH model in rats. (c) SAH grade in each group. Vehicle, 10% dimethyl sulfoxide (DMSO).
Figure 2
Figure 2
Time course of PGES2, EP1, EP2, EP3, EP4, and Mul1 expression in the ipsilateral hemisphere brain after subarachnoid hemorrhage (SAH). (a) Representative western blot images and densitometric quantification of PGES2 (b), Mul1 (c), EP1 (d), EP2 (e), EP3 (f), and EP4 (g) after SAH. p < 0.05, ∗∗p < 0.01, and ∗∗∗p < 0.001 vs. sham group. Data was expressed as mean ± SD, n = 6 per group, one-way ANOVA-Tukey.
Figure 3
Figure 3
Double immunofluorescence staining of EP3 with NeuN, GFAP, and Iba-1 at 24 h after SAH. Top panel indicates the location of staining (small black box). Scale bar = 50 μm. n = 2 for each group.
Figure 4
Figure 4
EP3 inhibition improved short-term (24 h) neurological outcome after SAH. L798106 and EP3 CRISPR improved the Modified Garcia score (a) and beam balance score (b) at 24 hours after SAH. Vehicle: 10% DMSO. p < 0.05 vs. sham group; @p < 0.05 vs. SAH + vehicle group. Data was expressed as mean ± SD, n = 6 per group, one-way ANOVA-Tukey.
Figure 5
Figure 5
Effects of EP3 inhibition on short-term (24 h) neuronal degeneration and apoptosis after SAH. (a) Representative microphotographs of FJC immunofluorescence staining in the ipsilateral cortex of rat brain. (b) Quantitative analysis of FJC-positive cells. Top panel indicates the location of staining (small black box). (c) Representative microphotographs of TUNEL immunofluorescence staining in the ipsilateral cortex of rat brain. (d) Quantitative analysis of TUNEL-positive neurons. Top panel indicates the location of staining (small black box). Vehicle: 10% DMSO. ∗∗∗p < 0.001 vs. sham group; @@p < 0.01 and @@@p < 0.001 vs. SAH + vehicle group; &&p < 0.01 and &&&p < 0.001 vs. SAH + Scr CRISPR group. Scale bar = 100 μm. Data was expressed as mean ± SD, n = 6 per group, one-way ANOVA-Tukey.
Figure 6
Figure 6
Effects of EP3 inhibition on short-term (24 h) oxidative stress level after SAH. (a) Representative microphotographs of 8-OHdG immunofluorescence staining in the ipsilateral cortex of rat brain. (b) Quantitative analysis of 8-OHdG fluorescence intensity (n = 6 per group). Top panel indicates the location of staining (small black box). Vehicle: 10% DMSO. ∗∗∗p < 0.001 vs. sham group; @@p < 0.01 vs. SAH + vehicle group; &&&p < 0.001 vs. SAH + Scr CRISPR group. Scale bar = 100 μm. Data was expressed as mean ± SD, one-way ANOVA-Tukey.
Figure 7
Figure 7
Effects of EP3 inhibition with L798106 on neuronal degeneration and apoptosis at 7 d after SAH. (a) Representative microphotographs of FJC immunofluorescence staining in the ipsilateral cortex of rat brain. (b) Quantitative analysis of FJC-positive cells. Top panel indicates the location of staining (small black box). (c) Representative microphotographs of TUNEL immunofluorescence staining in the ipsilateral cortex of rat brain. (d) Quantitative analysis of TUNEL-positive neurons. Top panel indicates the location of staining (small black box). Vehicle: 10% DMSO. ∗∗∗p < 0.001 vs. sham group; @@p < 0.01 vs. SAH + vehicle group. Scale bar = 100 μm. Data was expressed as mean ± SD, n = 6 per group, one-way ANOVA-Tukey.
Figure 8
Figure 8
Effects of EP3 inhibition with L798106 on long-term (28 d) neurobehavioral outcome after SAH. (a) L798106 increased falling latency in rotarod test on day 7s and 14 after SAH. (b) Representative thermal imaging of the probe trial. The white circles indicate the positions of the probe platform. (c) Escape latency and swimming distance of Morris water maze. (d) Quantification of the probe quadrant duration in the probe trial. (e) Swimming velocities of different groups in probe trial. Vehicle: 10% DMSO. p < 0.05, ∗∗p < 0.01, and ∗∗∗p < 0.001 vs. sham group; @p < 0.05 and @@p < 0.01 vs. SAH + vehicle group. Data was expressed as mean ± SD, n = 10 per group, group; two-way ANOVA-Tukey (a, c) and one-way ANOVA-Tukey (d, e).
Figure 9
Figure 9
Effects of EP3 inhibition with L798106 on long-term (28 d) neuronal degeneration after SAH. (a) Representative microphotographs of Nissl staining in different hippocampal regions. Scale bar = 50 μm. (b) Representative image indicates the location of interest area (small black boxes) in the left hippocampus. (c) Quantification of Nissl-positive neurons per area in dentate gyrus (DG), cornu ammonis (CA1), and CA3 at 28 days after SAH. ∗∗∗p < 0.001 vs. sham group and @@p < 0.01 vs. SAH + vehicle group. Data were expressed as mean ± SD, n = 10 per group. One-way ANOVA-Tukey.
Figure 10
Figure 10
FOXO3 activation CRISPR abolished the beneficial effects of L798106 at 24 h after SAH. (a) Representative western blot bands and (b–l) quantification of EP3, p38, p-p38, FOXO3, p-FOXO3, Mul1, Mfn2, 4-HNE, Bcl-2, Bax, and CC3. Vehicle, 10% DMSO; Scr CRISPR, scramble CRISPR. ∗∗p < 0.01 and ∗∗∗p < 0.001 vs. sham group; @p < 0.05, @@p < 0.01, and @@@p < 0.001 vs. SAH + vehicle group. &p < 0.05, &&p < 0.01, and &&&p < 0.001 vs. SAH + L798106 + Scr CRISPR group. Data was expressed as mean ± SD, n = 6 per group. One-way ANOVA, Tukey's post hoc test.
Figure 11
Figure 11
EP3 agonist sulprostone abolished the beneficial effects of L798106 at 24 h after SAH. Representative western blot bands (a) and quantification of EP3, p38, p-p38, FOXO3, p-FOXO3, Mul1, Mfn2, 4-HNE, Bcl-2, Bax, and CC3 (b–l). Vehicle, 10% DMSO; Scr CRISPR, scramble CRISPR. p < 0.05, ∗∗p < 0.01, and ∗∗∗p < 0.001 vs. sham group; @p < 0.05, @@p < 0.01, and @@@p < 0.001 vs. SAH + vehicle group. &p < 0.05, &&p < 0.01, and &&&p < 0.001 vs. SAH + L798106 + Scr CRISPR group. Data was represented as mean ± SD, n = 6 per group. One-way ANOVA, Tukey's post hoc test.

Similar articles

Cited by

References

    1. Peng J., Zuo Y., Huang L., et al. Activation of GPR30 with G1 attenuates neuronal apoptosis via src/EGFR/stat3 signaling pathway after subarachnoid hemorrhage in male rats. Experimental Neurology . 2019;320, article 113008 doi: 10.1016/j.expneurol.2019.113008. - DOI - PubMed
    1. Chen S., Feng H., Sherchan P., et al. Controversies and evolving new mechanisms in subarachnoid hemorrhage. Progress in Neurobiology . 2014;115:64–91. doi: 10.1016/j.pneurobio.2013.09.002. - DOI - PMC - PubMed
    1. van Dijk B. J., Meijers J. C. M., Kloek A. T., et al. Complement C5 contributes to brain injury after subarachnoid hemorrhage. Translational Stroke Research . 2020;11(4):678–688. doi: 10.1007/s12975-019-00757-0. - DOI - PMC - PubMed
    1. Sun J.-Y., Zhao S.-J., Wang H.-B., et al. Ifenprodil improves long-term neurologic deficits through antagonizing glutamate-induced excitotoxicity after experimental subarachnoid hemorrhage. Translational Stroke Research . 2021;12(6):1067–1080. doi: 10.1007/s12975-021-00906-4. - DOI - PubMed
    1. Gauberti M., Fournier A. P., Docagne F., Vivien D., de Lizarrondo S. M. Molecular magnetic resonance imaging of endothelial activation in the central nervous system. Theranostics . 2018;8(5):1195–1212. doi: 10.7150/thno.22662. - DOI - PMC - PubMed

LinkOut - more resources