

Constructing a positive sentiment index for COVID-19: Evidence from G20 stock markets
- PMID: 36531211
- PMCID: PMC8915623
- DOI: 10.1016/j.irfa.2022.102111
Constructing a positive sentiment index for COVID-19: Evidence from G20 stock markets
Abstract
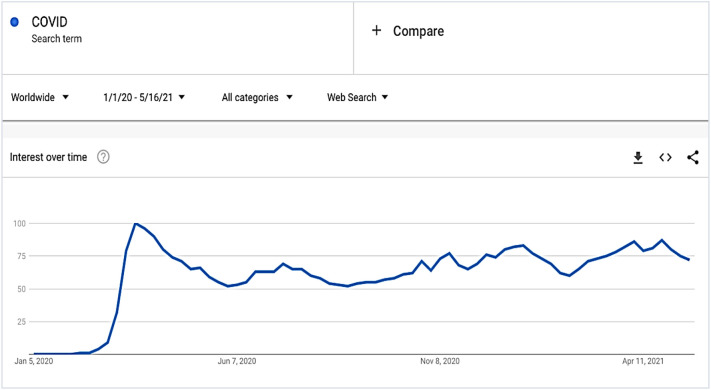
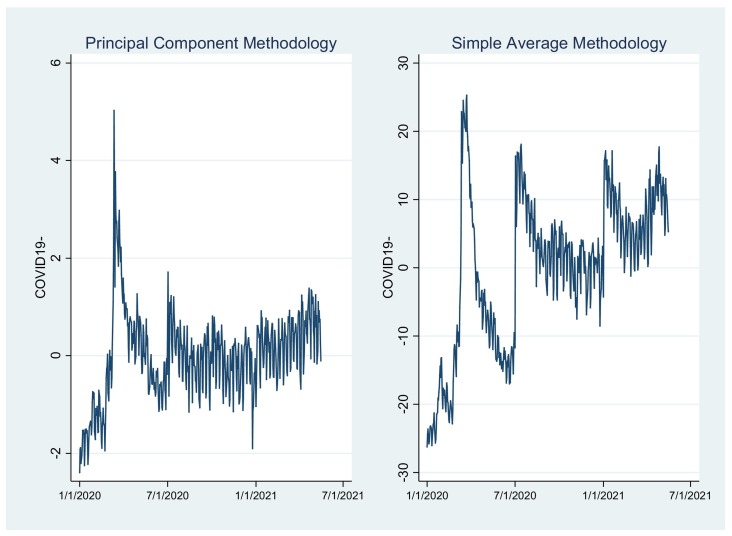
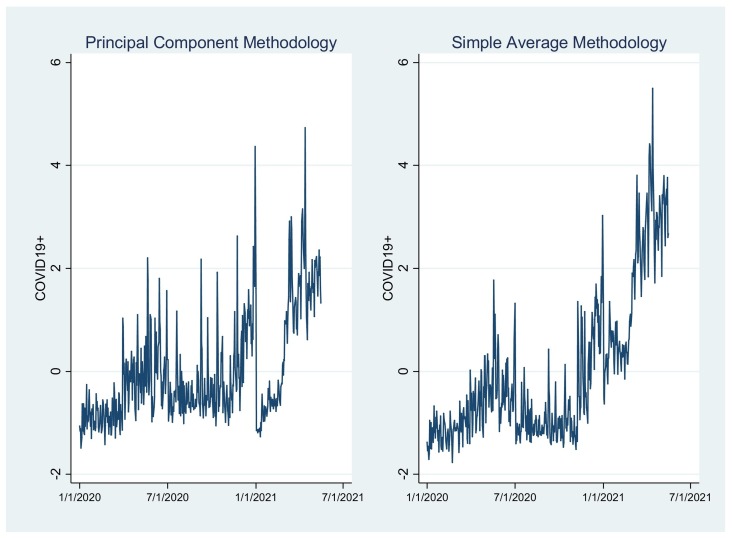
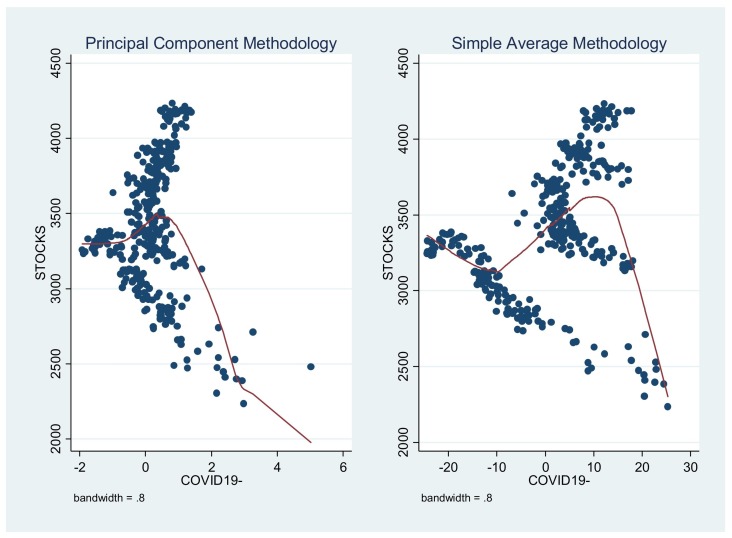
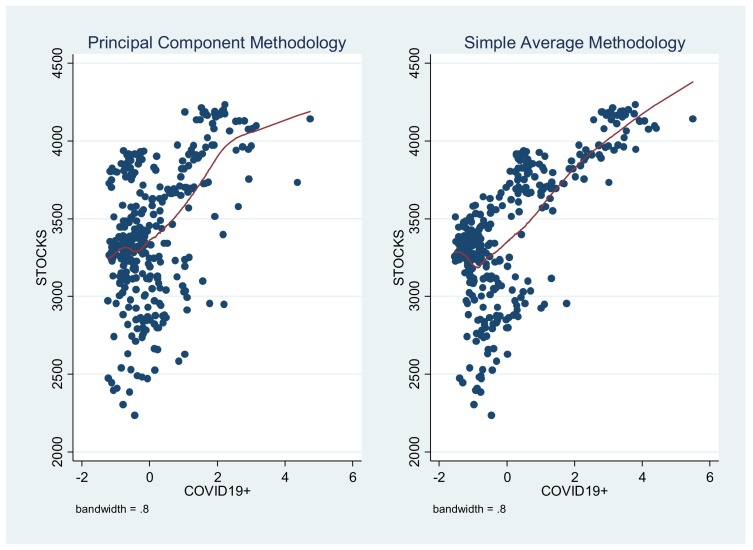
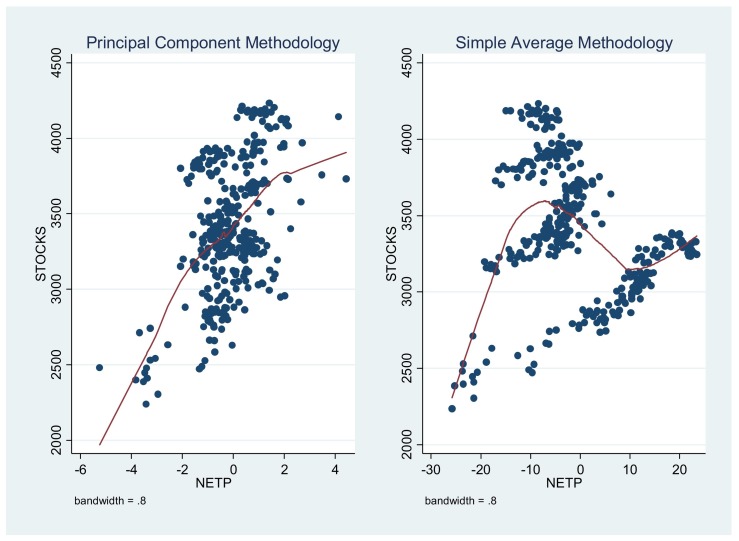
The present study investigates the degree of market responses through the scope of investors' sentiment during the COVID-19 pandemic across G20 markets by constructing a novel positive search volume index for COVID-19 (COVID19+). Our key findings, obtained using a Panel-GARCH model, indicate that an increased COVID19+ index suggests that investors decrease their COVID-19 related crisis sentiment by escalating their Google searches for positively associated COVID-19 related keywords. Specifically, we explore the predictive power of the newly constructed index on stock returns and volatility. According to our findings, investor sentiment positively (negatively) predicts the stock return (volatility) during the COVID-19. This is the first study assessing global sentiment by proposing a novel proxy and its impacts on the G20 equity market.
Keywords: COVID-19; G20; Panel-GARCH; Sentiment; Stock markets.
© 2022 Elsevier Inc. All rights reserved.
Conflict of interest statement
No conflict of interest exits in the submission of this manuscript, and this manuscript is approved by all authors for publication.
Figures
Similar articles
-
Investor sentiments and stock markets during the COVID-19 pandemic.Financ Innov. 2022;8(1):69. doi: 10.1186/s40854-022-00375-0. Epub 2022 Jul 5. Financ Innov. 2022. PMID: 35814528 Free PMC article.
-
Using E-GARCH to Analyze the Impact of Investor Sentiment on Stock Returns Near Stock Market Crashes.Front Psychol. 2021 Jul 27;12:664849. doi: 10.3389/fpsyg.2021.664849. eCollection 2021. Front Psychol. 2021. PMID: 34385951 Free PMC article.
-
Effects of investor sentiment and country governance on unexpected conditional volatility during the COVID-19 pandemic: Evidence from global stock markets.Int Rev Financ Anal. 2022 Jul;82:102186. doi: 10.1016/j.irfa.2022.102186. Epub 2022 Apr 22. Int Rev Financ Anal. 2022. PMID: 36532086 Free PMC article.
-
Testing volatility and relationship among BRICS stock market returns.SN Bus Econ. 2022;2(8):111. doi: 10.1007/s43546-022-00267-6. Epub 2022 Jul 28. SN Bus Econ. 2022. PMID: 35919285 Free PMC article. Review.
-
Time-frequency domain analysis of investor fear and expectations in stock markets of BRIC economies.Heliyon. 2021 Oct 19;7(10):e08211. doi: 10.1016/j.heliyon.2021.e08211. eCollection 2021 Oct. Heliyon. 2021. PMID: 34754971 Free PMC article. Review.
Cited by
-
Effects of investor sentiment on stock volatility: new evidences from multi-source data in China's green stock markets.Financ Innov. 2022;8(1):77. doi: 10.1186/s40854-022-00381-2. Epub 2022 Aug 23. Financ Innov. 2022. PMID: 36034681 Free PMC article.
References
-
- Abugri B.A. Empirical relationship between macroeconomic volatility and stock returns: Evidence from Latin American markets. International Review of Financial Analysis. 2008;17(2):396–410.
-
- Al-Khazali O., Bouri E., Roubaud D., Zoubi T. The impact of religious practice on stock returns and volatility. International Review of Financial Analysis. 2017;52:172–189.
-
- Anastasiou D., Ballis A., Drakos K. Cryptocurrencies’ Price crash risk and crisis sentiment. Finance Research Letters. 2021;101928 - PubMed
LinkOut - more resources
Full Text Sources