. 2022 Dec 1:13:1068075.
doi: 10.3389/fgene.2022.1068075. eCollection 2022.

LFSC: A linear fast semi-supervised clustering algorithm that integrates reference-bulk and single-cell transcriptomes

Affiliations

LFSC: A linear fast semi-supervised clustering algorithm that integrates reference-bulk and single-cell transcriptomes

Qiaoming Liu et al. Front Genet. .

Abstract

The identification of cell types in complex tissues is an important step in research into cellular heterogeneity in disease. We present a linear fast semi-supervised clustering (LFSC) algorithm that utilizes reference samples generated from bulk RNA sequencing data to identify cell types from single-cell transcriptomes. An anchor graph is constructed to depict the relationship between reference samples and cells. By applying a connectivity constraint to the learned graph, LFSC enables the preservation of the underlying cluster structure. Moreover, the overall complexity of LFSC is linear to the size of the data, which greatly improves effectiveness and efficiency. By applying LFSC to real single-cell RNA sequencing datasets, we discovered that it has superior performance over existing baseline methods in clustering accuracy and robustness. An application using infiltrating T cells in liver cancer demonstrates that LFSC can successfully find new cell types, discover differently expressed genes, and explore new cancer-associated biomarkers.

Keywords: anchor graph; bulk RNA-seq; clustering; data integration; single-cell RNA-seq.


Conflict of interest statement

The authors declare that the research was conducted in the absence of any commercial or financial relationships that could be construed as a potential conflict of interest.

Figures

FIGURE 1
FIGURE 1
orkflow of the LFSC.
FIGURE 2
FIGURE 2
lustering evaluation (ARI, NMI, ACC, and purity) heatmap of LFSC and six baseline methods on 21 real scRNA-seq datasets.
FIGURE 3
FIGURE 3
iolin plots of clustering evaluations (ARI, NMI, ACC, and purity) of LFSC with different downsampling ratios for four highly confident scRNA-seq datasets.
FIGURE 4
FIGURE 4
lustering evaluation (ARI, NMI, ACC, and purity) results of LFSC with different hyperparameters on four highly confident scRNA-seq datasets.
FIGURE 5
FIGURE 5
Running time of LFSC and six baseline methods on datasets Macosko, Chen, Campbell, and Pbmc68K.
FIGURE 6
FIGURE 6
t-SNE plots of LFSC and baseline methods with corresponding silhouette coefficients and clustering results on four highly confident scRNA-seq datasets.
FIGURE 7
FIGURE 7
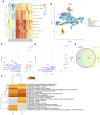
Single-cell transcriptional profiling of the tumor-infiltrating lymphocytes. (A) Heatmap of Pearson coefficient values between 26 clusters and 11 T-cell subtypes; (B) t-SNE plots of tumor-infiltrating lymphocytes annotated by LFSC using the ImmGen database as the reference; (C) volcano plot showing differentially expressed genes in cluster 5; (D) volcano plot showing differentially expressed genes in cluster 14; (E) Venn diagram showing the overlap of DEGs between cluster 5 and cluster 14; (F) heatmap of the enriched term across DEGs on cluster 5 and cluster 14.
FIGURE 8
FIGURE 8
Results of survival analysis on selected DEGs across TCGA LIHC clinical data. Survival curves on the intersection of DEGs between cluster 5 and cluster 14 (A); on DEGs of cluster 5 (B); on DEGs belonging to cluster 5 but not to cluster 14 (C); on the combination of DEGs between cluster 5 and cluster 14 (D); on DEGs of cluster 14 (E); on DEGs belonging to cluster 14 but not to cluster 5 (F).

References

    1. Aran D., Looney A. P., Liu L., Wu E., Fong V., Hsu A., et al. (2019). Reference-based analysis of lung single-cell sequencing reveals a transitional profibrotic macrophage. Nat. Immunol. 20 (2), 163–172. 10.1038/s41590-018-0276-y - DOI - PMC - PubMed
    1. Bartoschek M., Oskolkov N., Bocci M., Lovrot J., Larsson C., Sommarin M., et al. (2018). Spatially and functionally distinct subclasses of breast cancer-associated fibroblasts revealed by single cell RNA sequencing. Nat. Commun. 9 (1), 5150. 10.1038/s41467-018-07582-3 - DOI - PMC - PubMed
    1. Butler A., Hoffman P., Smibert P., Papalexi E., Satija R. (2018). Integrating single-cell transcriptomic data across different conditions, technologies, and species. Nat. Biotechnol. 36 (5), 411–420. 10.1038/nbt.4096 - DOI - PMC - PubMed
    1. Chen X., Deng C. (2011). Large scale spectral clustering with landmark-based representation. Twenty-fifth AAAI Conf. Artif. Intell. 45, 1669–1680. 10.1109/TCYB.2014.2358564 - DOI - PubMed
    1. Chung F. R. K., Graham F. C. (1997). Spectral graph theory. Rhode Island, United States: American Mathematical Soc.

LinkOut - more resources