

Host genetics impact on SARS-CoV-2 vaccine-induced immunoglobulin levels and dynamics: The role of TP53, ABO, APOE, ACE2, HLA-A, and CRP genes
- PMID: 36531241
- PMCID: PMC9748098
- DOI: 10.3389/fgene.2022.1028081
Host genetics impact on SARS-CoV-2 vaccine-induced immunoglobulin levels and dynamics: The role of TP53, ABO, APOE, ACE2, HLA-A, and CRP genes
Abstract
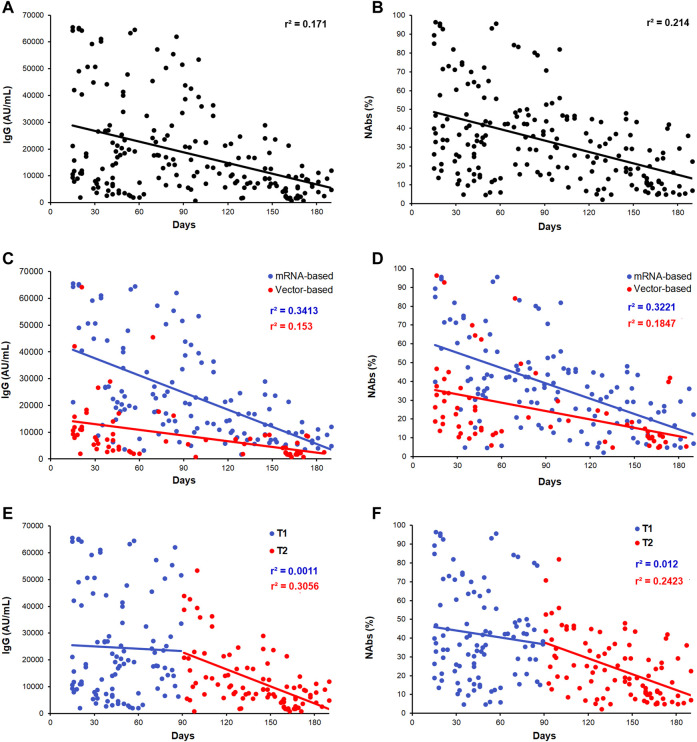
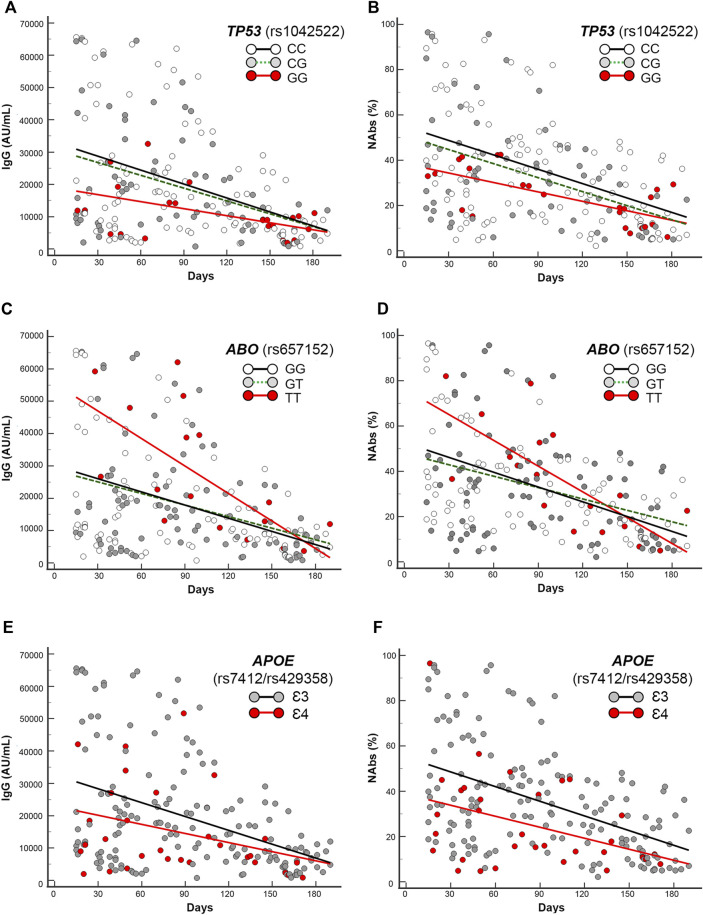
Background: Development and worldwide availability of safe and effective vaccines against severe acute respiratory syndrome coronavirus-2 (SARS-CoV-2) to fight severe symptoms of coronavirus disease 2019 (COVID-19) and block the pandemic have been a great achievement and stimulated researchers on understanding the efficacy and duration of different vaccine types. Methods: We investigated the levels of anti-SARS-CoV-2 antibodies (IgG) and neutralizing antibodies (NAbs) in 195 healthy adult subjects belonging to the staff of the University-Hospital of Ferrara (Italy) starting from 15 days up to 190 days (about 6 months) after the second dose of the BNT162b2 (Pfizer-BioNTech) mRNA-based vaccine (n = 128) or ChAdOx1 (AstraZeneca) adenovirus-based vaccine (n = 67) using a combined approach of serological and genomics investigations. Results: A strong correlation between IgG and NAb levels was detected during the 190 days of follow-up (r 2 = 0.807; p < 0.0001) and was confirmed during the first 90 days (T1) after vaccination (r 2 = 0.789; p = 0.0001) and 91-190 days (T2) after vaccination (r 2 = 0.764; p = 0.0001) for both vaccine types (r 2 = 0.842; p = 0.0001 and r 2 = 0.780; p = 0.0001 for mRNA- and adenovirus-based vaccine, respectively). In addition to age (p < 0.01), sex (p = 0.03), and type of vaccine (p < 0.0001), which partially accounted for the remarkable individual differences observed in the antibody levels and dynamics, interesting genetic determinants appeared as significant modifiers of both IgG and NAb responses among the selected genes investigated (TP53, rs1042522; APOE, rs7412/rs429358; ABO, rs657152; ACE2, rs2285666; HLA-A rs2571381/rs2499; CRP, rs2808635/rs876538; LZTFL1, rs35044562; OAS3, rs10735079; SLC6A20, rs11385942; CFH, rs1061170; and ACE1, ins/del, rs4646994). In detail, regression analysis and mean antibody level comparison yielded appreciable differences after genotype stratification (P1 and P2, respectively, for IgG and NAb distribution) in the whole cohort and/or in the mRNA-based vaccine in the following genes: TP53, rs1042522 (P1 = 0.03; P2 = 0.04); ABO, rs657152 (P1 = 0.01; P2 = 0.03); APOE, rs7412/rs429358 (P1 = 0.0018; P2 = 0.0002); ACE2, rs2285666 (P1 = 0.014; P2 = 0.009); HLA-A, rs2571381/rs2499 (P1 = 0.02; P2 = 0.03); and CRP, rs2808635/rs876538 (P1 = 0.01 and P2 = 0.09). Conclusion: High- or low-responsive subjects can be identified among healthy adult vaccinated subjects after targeted genetic screening. This suggests that favorable genetic backgrounds may support the progression of an effective vaccine-induced immune response, though no definite conclusions can be drawn on the real effectiveness ascribed to a specific vaccine or to the different extent of a genotype-driven humoral response. The interplay between data from the polygenic predictive markers and serological screening stratified by demogeographic information can help to recognize the individual humoral response, accounting for ethnic and geographical differences, in both COVID-19 and anti-SARS-CoV-2 vaccinations.
Keywords: BNT162b2 (Pfizer–BioNTech); COVID-19; COVIDomics; ChAdOx1 (AstraZeneca); SARS-CoV-2; SNPs; vaccine; vaccine pharmacogenomics.
Copyright © 2022 Gemmati, Longo, Gallo, Silva, Secchiero, Zauli, Hanau, Passaro, Pellegatti, Pizzicotti, Serino, Singh and Tisato.
Conflict of interest statement
The authors declare that the research was conducted in the absence of any commercial or financial relationships that could be construed as a potential conflict of interest.
Figures


References
LinkOut - more resources
Full Text Sources
Research Materials
Miscellaneous