

Optimum non-invasive predictive indicators for metabolic dysfunction-associated fatty liver disease and its subgroups in the Chinese population: A retrospective case-control study
- PMID: 36531447
- PMCID: PMC9751395
- DOI: 10.3389/fendo.2022.1035418
Optimum non-invasive predictive indicators for metabolic dysfunction-associated fatty liver disease and its subgroups in the Chinese population: A retrospective case-control study
Abstract
Objective: Metabolic dysfunction-associated fatty liver disease (MAFLD) affects 25% of the population without approved drug therapy. According to the latest consensus, MAFLD is divided into three subgroups based on different diagnostic modalities, including Obesity, Lean, and Type 2 diabetes mellitus (T2DM) MAFLD subgroups. This study aimed to find out the optimum non-invasive metabolism-related indicators to respectively predict MAFLD and its subgroups.
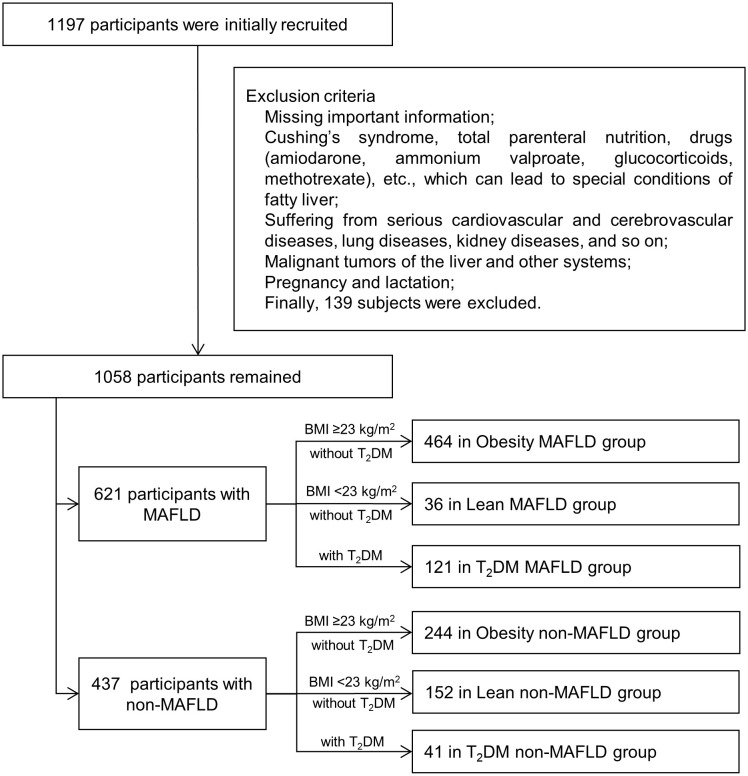
Design: 1058 Chinese participants were enrolled in this study. Anthropometric measurements, laboratory data, and ultrasonography features were collected. 22 metabolism-related indexes were calculated, including fatty liver index (FLI), lipid accumulation product (LAP), waist circumference-triglyceride index (WTI), etc. Logistic regression analyzed the correlation between indexes and MAFLD. Receiver operating characteristics were conducted to compare predictive values among 22 indicators for screening the best indicators to predict MAFLD in different subgroups.
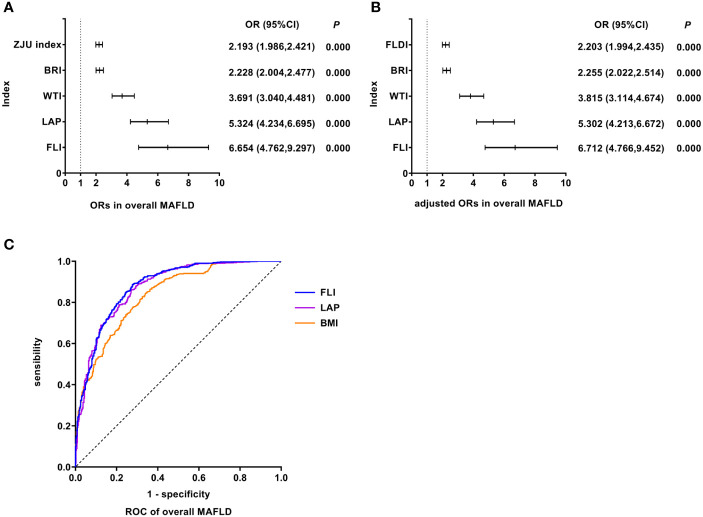
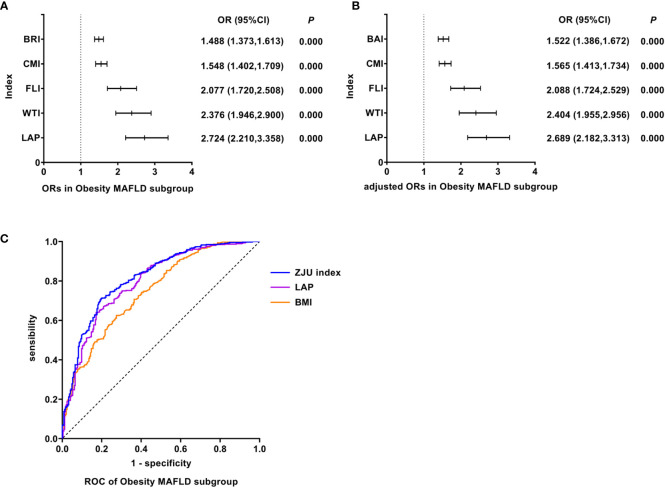
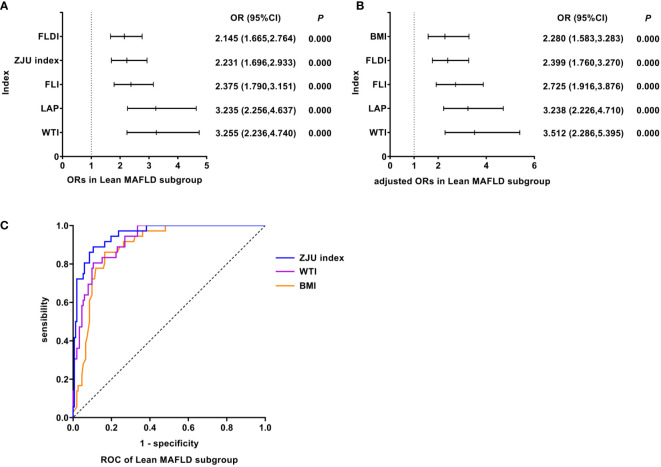
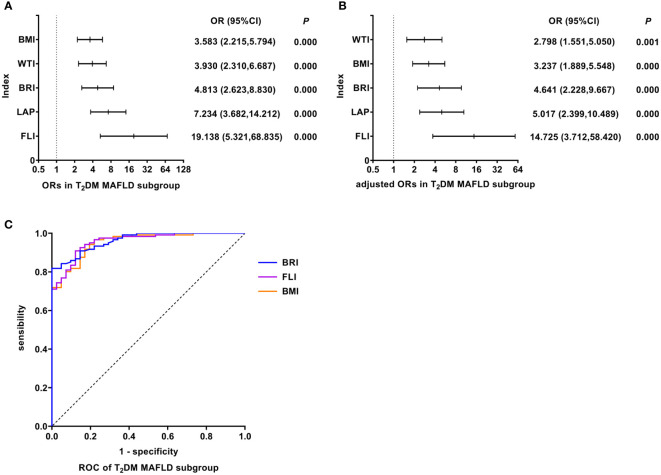
Results: FLI was the best predictor with the maximum odds ratio (OR) values of overall MAFLD (OR: 6.712, 95%CI: 4.766-9.452, area under the curve (AUC): 0.879, P < 0.05) and T2DM MAFLD subgroup (OR: 14.725, 95%CI: 3.712-58.420, AUC: 0.958, P < 0.05). LAP was the best predictor with the maximum OR value of Obesity MAFLD subgroup (OR: 2.689, 95%CI: 2.182-3.313, AUC: 0.796, P < 0.05). WTI was the best predictor with the maximum OR values of Lean MAFLD subgroup (OR: 3.512, 95%CI: 2.286-5.395, AUC: 0.920, P < 0.05).
Conclusion: The best predictors of overall MAFLD, Obesity, Lean, and T2DM MAFLD subgroups were respectively FLI, LAP, WTI, and FLI.
Keywords: fatty liver index; lipid accumulation product; metabolic disorders; metabolic dysfunction-associated fatty liver disease; non-invasive predictive indicators; waist circumference-triglyceride index.
Copyright © 2022 Liu, Duan, Wang, Wang, Peng, Niu and Yao.
Conflict of interest statement
The authors declare that the research was conducted in the absence of any commercial or financial relationships that could be construed as a potential conflict of interest.
Figures
References
-
- Perez-Diaz-Del-Campo N, Riezu-Boj JI, Marin-Alejandre BA, Monreal JI, Elorz M, Herrero JI, et al. . Three different genetic risk scores based on fatty liver index, magnetic resonance imaging and lipidomic for a nutrigenetic personalized management of NAFLD: The fatty liver in obesity study. Diagnostics (Basel) (2021) 11(6):1083. doi: 10.3390/diagnostics11061083 - DOI - PMC - PubMed
-
- Jiang ZY, Xu CY, Chang XX, Li WW, Sun LY, Yang XB, et al. . Fatty liver index correlates with non-alcoholic fatty liver disease, but not with newly diagnosed coronary artery atherosclerotic disease in Chinese patients. BMC Gastroenterol (2013) 13:110. doi: 10.1186/1471-230X-13-110 - DOI - PMC - PubMed
Publication types
MeSH terms
LinkOut - more resources
Full Text Sources
Medical
Research Materials