. 2022 Jul 12;2(4):100196.
doi: 10.1016/j.xops.2022.100196. eCollection 2022 Dec.

Insights into Sickle Cell Disease through the Retinal Microvasculature: Adaptive Optics Scanning Light Ophthalmoscopy Correlates of Clinical OCT Angiography

Affiliations

Insights into Sickle Cell Disease through the Retinal Microvasculature: Adaptive Optics Scanning Light Ophthalmoscopy Correlates of Clinical OCT Angiography

Alexander Pinhas et al. Ophthalmol Sci. .

Abstract

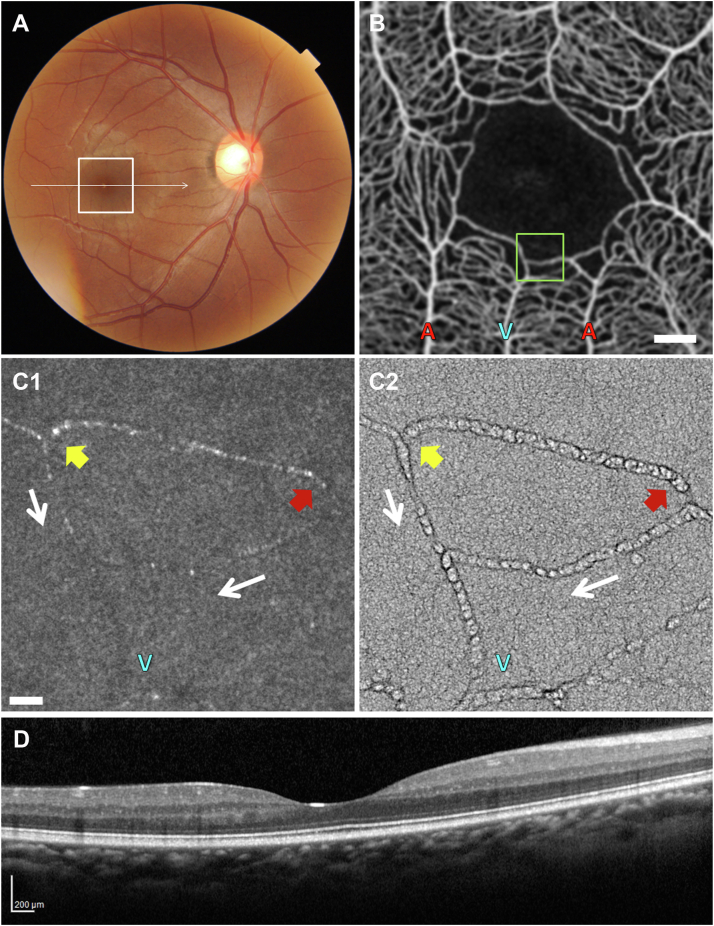
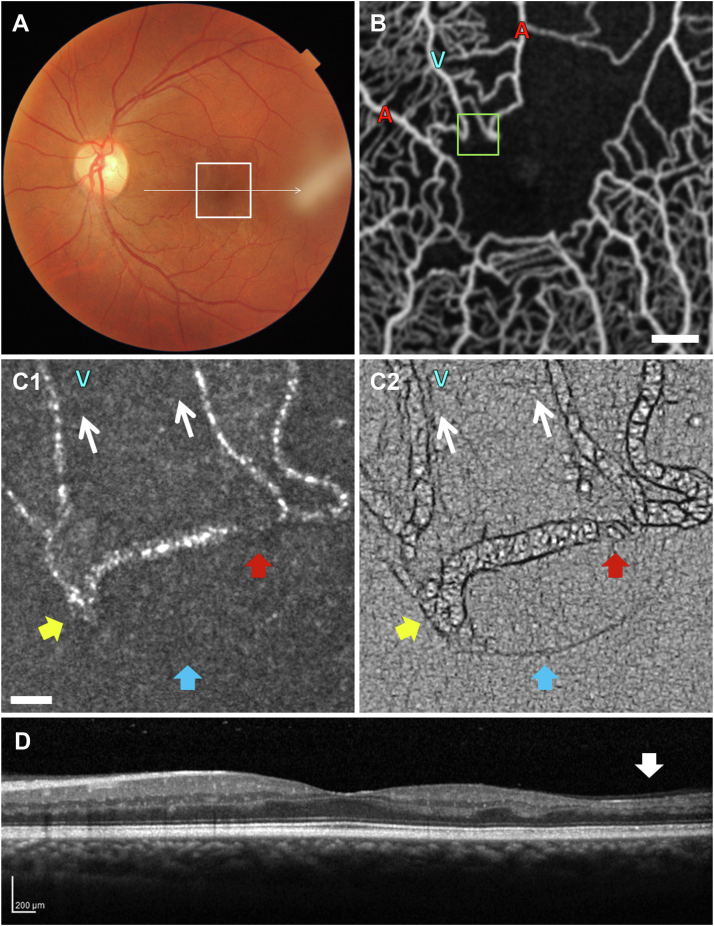
Purpose: Clinical OCT angiography (OCTA) of the retinal microvasculature offers a quantitative correlate to systemic disease burden and treatment efficacy in sickle cell disease (SCD). The purpose of this study was to use the higher resolution of adaptive optics scanning light ophthalmoscopy (AOSLO) to elucidate OCTA features of parafoveal microvascular compromise identified in SCD patients.

Design: Case series of 11 SCD patients and 1 unaffected control.

Participants: A total of 11 eyes of 11 SCD patients (mean age, 33 years; range, 23-44; 8 female, 3 male) and 1 eye of a 34-year-old unaffected control.

Methods: Ten sequential 3 × 3 mm parafoveal OCTA full vascular slab scans were obtained per eye using a commercial spectral domain OCT system (Avanti RTVue-XR; Optovue). These were used to identify areas of compromised perfusion near the foveal avascular zone (FAZ), designated as regions of interest (ROIs). Immediately thereafter, AOSLO imaging was performed on these ROIs to examine the cellular details of abnormal perfusion. Each participant was imaged at a single cross-sectional time point. Additionally, 2 of the SCD patients were imaged prospectively 2 months after initial imaging to study compromised capillary segments across time and with treatment.

Main outcome measures: Detection and characterization of parafoveal perfusion abnormalities identified using OCTA and resolved using AOSLO imaging.

Results: We found evidence of abnormal blood flow on OCTA and AOSLO imaging among all 11 SCD patients with diverse systemic and ocular histories. Adaptive optics scanning light ophthalmoscopy imaging revealed a spectrum of phenomena, including capillaries with intermittent blood flow, blood cell stasis, and sites of thrombus formation. Adaptive optics scanning light ophthalmoscopy imaging was able to resolve single sickled red blood cells, rouleaux formations, and blood cell-vessel wall interactions. OCT angiography and AOSLO imaging were sensitive enough to document improved retinal perfusion in an SCD patient 2 months after initiation of oral hydroxyurea therapy.

Conclusions: Adaptive optics scanning light ophthalmoscopy imaging was able to reveal the cellular details of perfusion abnormalities detected using clinical OCTA. The synergy between these clinical and laboratory imaging modalities presents a promising avenue in the management of SCD through the development of noninvasive ocular biomarkers to prognosticate progression and measure the response to systemic treatment.

Keywords: ADD, airy disk diameter; AOSLO, adaptive optics scanning light ophthalmoscopy; Adaptive optics; BCVA, best-corrected visual acuity; D, diopters; FA, fluorescein angiography; FAZ, foveal avascular zone; HbSC, hemoglobin SC; HbSS, hemoglobin SS; IOP, intraocular pressure; OCT angiography; OCTA, OCT angiography; Oculomics; RBC, red blood cell; ROI, region of interest; Retinal microvasculature; SCD, sickle cell disease; SCR, sickle cell retinopathy; Sickle cell disease.


Figures

Figure 1
Figure 1
Left eye of a 34-year-old unaffected control. A, Standard color fundus photograph. Line represents horizontal OCT scan through fovea. White box localizes parafoveal area imaged with OCT angiography (OCTA). B, Averaged OCTA of 10 scans. Red A labels the associated arteriole, and blue V’s label the associated venules. Green box localizes the region of interest (ROI) imaged with adaptive optics scanning light ophthalmoscopy (AOSLO). Scale bar represents 200 μm. Single frames from (C1) a confocal and (C2) a nonconfocal AOSLO video. Scale bar represents 20 μm. D, Macular OCT. The associated Video 1 is available at www.ophthalmologyscience.org.
Figure 2
Figure 2
Left eye of patient 1. A, Standard color fundus photograph. Line represents horizontal OCT scan through fovea. White box localizes the parafoveal area imaged with OCT angiography (OCTA). B, Averaged OCTA of 10 scans. Red A’s label the associated arterioles, and blue V labels the associated venule. Green box localizes the region of interest (ROI) imaged with adaptive optics scanning light ophthalmoscopy (AOSLO). Scale bar represents 200 μm. C1, Single frame from a confocal, and (C2, C3) 2 frames from a nonconfocal AOSLO imaging video. White arrow represents direction of blood flow in the capillary segment of interest. Red arrow points to a red blood cell (RBC) rouleau. Yellow arrow points to a single sickled RBC. Blue V labels the associated venule from (B). Scale bar represents 200 μm. C4, C5, Zoomed-in views from (C3) highlighting morphological features of the torpedo-shaped single sickled RBC (yellow arrow) and the RBC rouleau (red arrow). Scale bar represents 10 μm. D, Macular OCT. White arrow indicates temporal macular thinning. The associated Video 2 is available at www.ophthalmologyscience.org.
Figure 3
Figure 3
Right eye of patient 2. A, Standard color fundus photograph. Line represents horizontal OCT scan through fovea. White box localizes parafoveal area imaged with OCT angiography (OCTA). B, Averaged OCTA of 10 scans. Red A’s label the associated arterioles, and blue V labels the associated venule. Green box localizes region of interest (ROI) imaged with adaptive optics scanning light ophthalmoscopy (AOSLO). Scale bar represents 200 μm. Single frames from (C1) a confocal and (C2) a nonconfocal AOSLO video. White arrows represent direction of blood flow in the capillary segments of interest. Yellow arrows represent area of blood cell stasis. Red arrows represent area of sluggish blood flow. Blue V labels the venule from (B). Scale bar represents 20 μm. D, Macular OCT. The associated Video 3 is available at www.ophthalmologyscience.org.
Figure 4
Figure 4
Left eye of patient 3. A, Standard color fundus photograph. Line represents horizontal OCT scan through fovea. White box localizes parafoveal area imaged with OCT angiography (OCTA). B, Averaged OCTA of 10 scans. Red A’s label the associated arterioles, and blue V labels the associated venule. Green box localizes region of interest (ROI) imaged with adaptive optics scanning light ophthalmoscopy (AOSLO). Scale bar represents 200 μm. Single frames from (C1) a confocal and (C2) a nonconfocal AOSLO video. White arrows represent direction of blood flow in the capillary segments of interest. Yellow arrows point to an immobile thrombus containing blood cells. Red arrows point to an area of plasma with occasional tumbling red blood cells. Blue arrows represent a sclerotic capillary segment. Blue V’s label the venule from (B). Scale bar represents 20 μm. D, Macular OCT. White arrow indicates temporal macular thinning. The associated Video 4 is available at www.ophthalmologyscience.org.
Figure 5
Figure 5
Right eye of patient 4, imaged 2 months apart without changes in disease management. A, Standard color fundus photograph. Line represents horizontal OCT scan through fovea. White box localizes parafoveal area imaged with OCT angiography (OCTA). B, Averaged OCTA of 10 scans at (B1) baseline and (B2) 2 months later. Red A’s label the associated arterioles, and blue V labels the associated venule. Green boxes localize region of interest (ROI) imaged with adaptive optics scanning light ophthalmoscopy (AOSLO). Scale bar represents 200 μm. C1, C3, Single frames from confocal AOSLO videos at baseline and 2 months later. White arrow indicates direction of blood flow. C2, C4, Single frames from nonconfocal AOSLO videos at baseline and 2 months later. Yellow arrows show the presence at baseline of a red blood cell blocking the capillary as it bifurcates from its feeder arteriole, and its absence 2 months later. Red arrows point to the segment with sparse blood cell flow at baseline which showed restored perfusion 2 months later. Blue V labels the venule from (B). Scale bar represents 20 μm. D, Macular OCT acquired at baseline. The associated Video 5 is available at www.ophthalmologyscience.org.
Figure 6
Figure 6
Right eye of patient 5. A, Standard color fundus photograph. Line represents horizontal OCT scan through fovea. White box localizes parafoveal area imaged with OCT angiography (OCTA). B, Averaged OCTA of 10 scans. Red A labels the associated arteriole, and blue V labels the associated venule. Green box localizes region of interest (ROI) imaged with adaptive optics scanning light ophthalmoscopy (AOSLO). Scale bar represents 200 μm. C1, Single frame from a confocal AOSLO video. C2, C3, Single frames from a nonconfocal AOSLO video. White arrow indicates the direction of blood flow. Black arrows point to the nonperfused capillary segment. Yellow arrows point to blood cells with associated material forming a thrombus stuck to the capillary wall at the bifurcation of a capillary. Red arrows point to spillover and peristaltic back flow of blood cells into the nonperfused capillary segment from the perfused capillary segment. Blue arrow points to a red blood cell rouleau. Blue V labels the venule from (B). Scale bar represents 20 μm. D, Macular OCT. White arrow indicates nasal macular thinning. The associated Video 6 is available at www.ophthalmologyscience.org.
Figure 7
Figure 7
Right eye of patient 6. A, Standard color fundus photograph. Line represents horizontal OCT scan through fovea. White box represents parafoveal area imaged with OCT angiography (OCTA). B, Averaged OCTA of 10 scans at (B1) baseline and (B2) 2 months after initiation of treatment with hydroxyurea. Red A labels the associated arteriole, and blue V’s label the associated venules. Green boxes represent region of interest (ROI) imaged with adaptive optics scanning light ophthalmoscopy (AOSLO). Scale bar represents 200 μm. C1, C2, Single frames from confocal AOSLO videos from baseline taken 5 minutes apart, and (C3) a single frame from a confocal AOSLO video taken after 2 months of treatment. C4, C5, Single frames from nonconfocal AOSLO videos from baseline taken 5 minutes apart, and (C6) a single frame from a nonconfocal AOSLO video taken after 2 months of treatment. C1, C2, C4, C5, Yellow arrows point to thrombi containing blood cells. Red arrows point to a nonperfused capillary segment. C3, C6, Yellow arrows point to resolved thrombi. Red arrows point to a capillary segment with restored perfusion. Scale bar represents 20 μm. D, Macular OCT acquired at baseline. The associated Video 7 is available at www.ophthalmologyscience.org.
Figure 8
Figure 8
Left eye of patient 7. A, Standard color fundus photograph. Line represents horizontal OCT scan through fovea. White box localizes parafoveal area imaged with OCT angiography (OCTA). B, Averaged OCTA of 10 scans. Red A’s label the associated arterioles, and blue V labels the associated venule. Green box localizes region of interest (ROI) imaged with adaptive optics scanning light ophthalmoscopy (AOSLO). Scale bar represents 200 μm. C1, Single frame from a confocal AOSLO video. White arrow indicates the direction of blood flow through the capillary segment of interest. C2, C3, Single frames from a nonconfocal AOSLO video. Yellow arrow points to the formation of a cellular thrombus and subsequent nonperfusion of the capillary segment. Red arrows point to an adjacent poorly perfused capillary segment. Blue V labels the venule from (B). Scale bar represents 20 μm. D, Macular OCT. White arrow indicates temporal macular thinning. The associated Video 8 is available at www.ophthalmologyscience.org.

References

    1. Kato G.J., Piel F.B., Reid C.D., et al. Sickle cell disease. Nat Rev Dis Primers. 2018;4 - PubMed
    1. Hassell K.L. Population estimates of sickle cell disease in the U.S. Am J Prev Med. 2010;38(4 Suppl):S512–S521. - PubMed
    1. Piel F.B., Hay S.I., Gupta S., et al. Global burden of sickle cell anaemia in children under five, 2010-2050: modelling based on demographics, excess mortality, and interventions. PLoS Med. 2013;10 - PMC - PubMed
    1. Payne A.B., Mehal J.M., Chapman C., et al. Trends in sickle cell disease-related mortality in the United States, 1979 to 2017. Ann Emerg Med. 2020;76(3S):S28–S36. - PMC - PubMed
    1. Dina S. Cost of illness of sickle cell disease in the US, payers’ perspective: (CRESCENT). Poster presentation at Virtual ISPOR 2021. May 17-20, 2021.

LinkOut - more resources