

Anodal high-definition transcranial direct current stimulation reduces heart rate and modulates heart-rate variability in healthy young people: A randomized cross-controlled trial
- PMID: 36531710
- PMCID: PMC9755739
- DOI: 10.3389/fcvm.2022.1070157
Anodal high-definition transcranial direct current stimulation reduces heart rate and modulates heart-rate variability in healthy young people: A randomized cross-controlled trial
Abstract
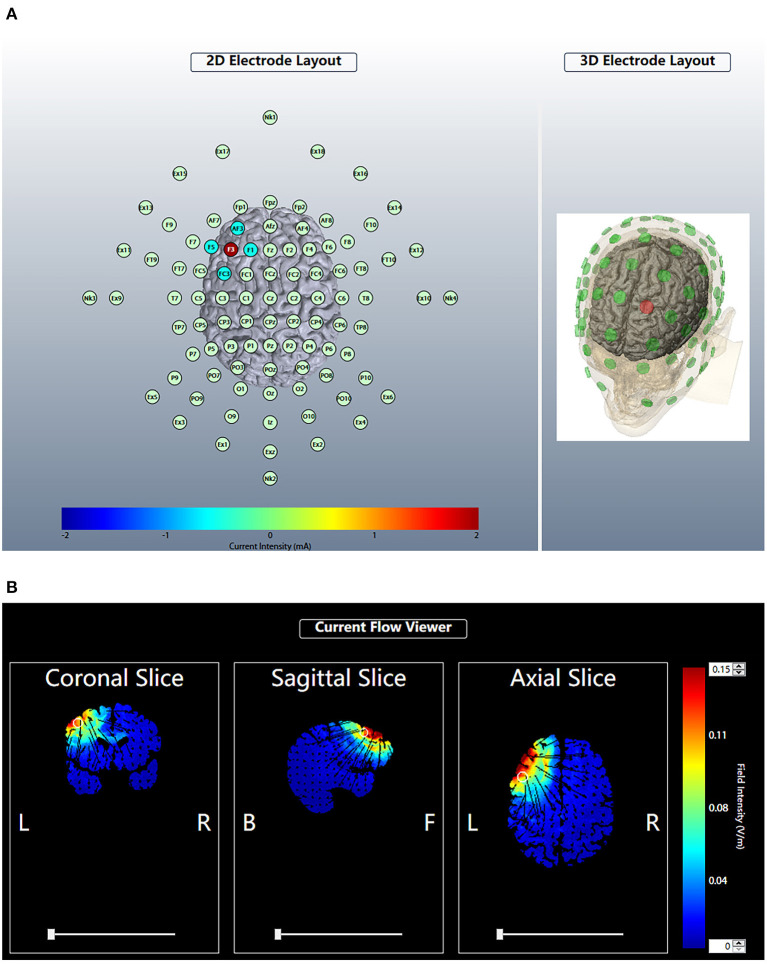
Objective: To investigate whether anodal high-definition transcranial current stimulation (HD-tDCS) over the left dorsolateral pre-frontal cortex (DLPFC) could modulate the heart rate (HR) and heart-rate variability (HRV) in healthy young people.
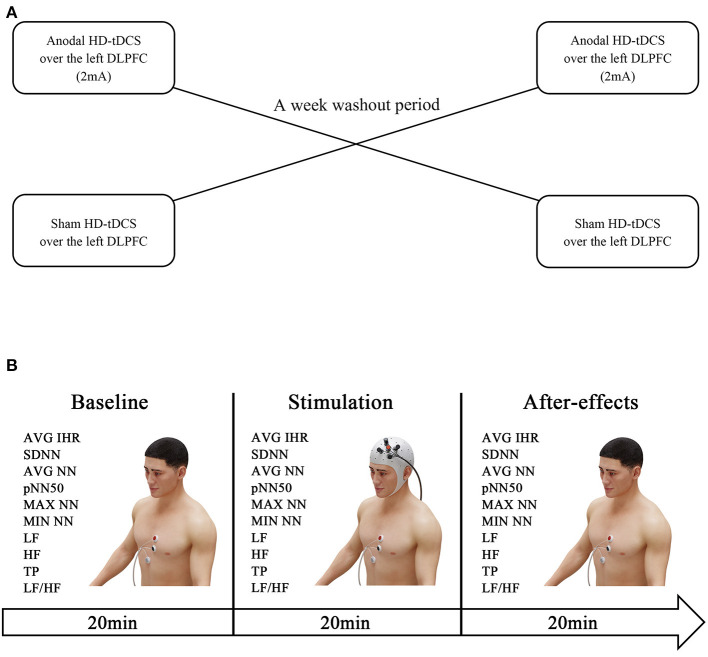
Methods: Forty healthy young people were enrolled in this randomized crossover trial. The participants were randomized to receive anodal HD-tDCS (n = 20) or sham HD-tDCS (n = 20) over the left DLPFC with a washout period of 1 week. Electrocardiogram (ECG) data were continuously recorded 20 min before the stimulation, during the session (20 min), and 20 min after the session. HR and the time- and frequency-domain indices of the HRV were measured to investigate the activity of the sympathetic and parasympathetic nervous systems.
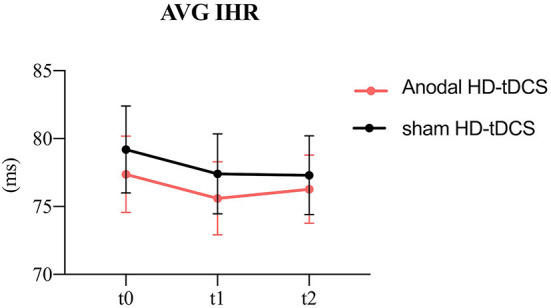
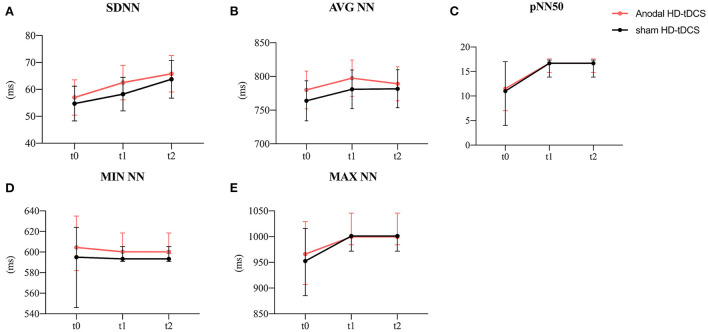
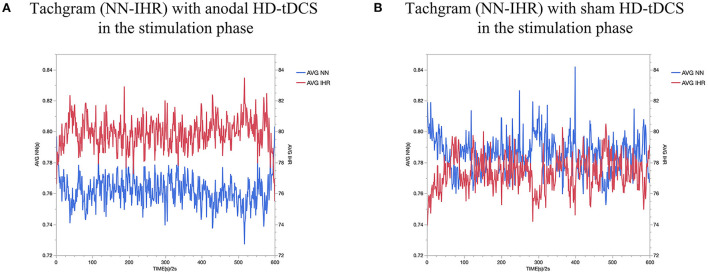
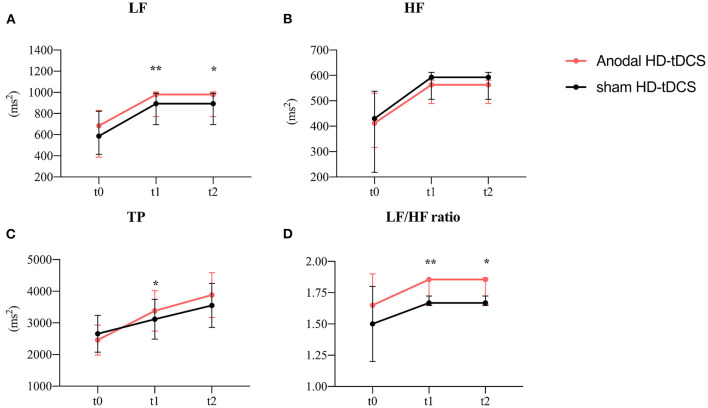
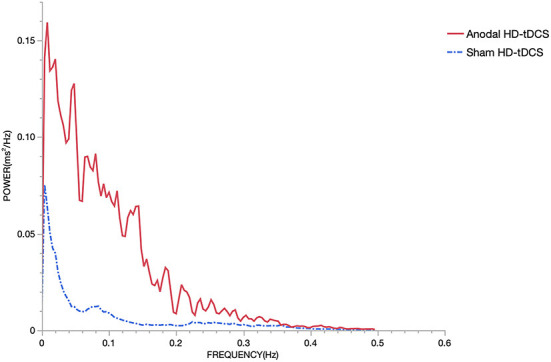
Results: Anodal HD-tDCS over the left DLPFC induced a significant decrease in HR and a significant increase in the average of normal-to-normal intervals (AVG NN), low-frequency (LF) power, total power (TP), and LF/high-frequency (HF) ratio in comparison with the sham stimulation and the baseline. However, sham HD-tDCS over the left DLPFC had no significant effect on HR or HRV.
Conclusions: Anodal HD-tDCS over the left DLPFC could reduce HR and modulate the HRV in healthy young people. HD-tDCS may show some potential for acutely modulating cardiovascular function.
Keywords: cardiac rhythm; dorsolateral pre-frontal cortex; heart rate; heart-rate variability; high-definition transcranial current stimulation.
Copyright © 2022 Gu, Chen, Lu, Dai, Hu, Xu, Geng, Zhu, Xu, Dai and Shen.
Conflict of interest statement
The authors declare that the research was conducted in the absence of any commercial or financial relationships that could be construed as a potential conflict of interest.
Figures
Similar articles
-
Anodal Transcranial Direct Current Stimulation Reduces Secondary Hyperalgesia Induced by low Frequency Electrical Stimulation in Healthy Volunteers.J Pain. 2022 Feb;23(2):305-317. doi: 10.1016/j.jpain.2021.08.004. Epub 2021 Sep 6. J Pain. 2022. PMID: 34500109 Clinical Trial.
-
Modulation of cortical responses by transcranial direct current stimulation of dorsolateral prefrontal cortex: A resting-state EEG and TMS-EEG study.Brain Stimul. 2018 Sep-Oct;11(5):1024-1032. doi: 10.1016/j.brs.2018.06.004. Epub 2018 Jun 18. Brain Stimul. 2018. PMID: 29921529 Clinical Trial.
-
High-definition transcranial direct current stimulation of the dorsolateral prefrontal cortex for tinnitus modulation: a preliminary trial.J Neural Transm (Vienna). 2018 Feb;125(2):163-171. doi: 10.1007/s00702-017-1808-6. Epub 2017 Nov 10. J Neural Transm (Vienna). 2018. PMID: 29127483 Clinical Trial.
-
Stimulation of Dorsolateral Prefrontal Cortex Enhances Adaptive Cognitive Control: A High-Definition Transcranial Direct Current Stimulation Study.J Neurosci. 2016 Dec 14;36(50):12530-12536. doi: 10.1523/JNEUROSCI.2450-16.2016. J Neurosci. 2016. PMID: 27974612 Free PMC article. Clinical Trial.
-
Effects of High-Definition Transcranial Direct Current Stimulation Over the Primary Motor Cortex on Cold Pain Sensitivity Among Healthy Adults.Front Mol Neurosci. 2022 Mar 18;15:853509. doi: 10.3389/fnmol.2022.853509. eCollection 2022. Front Mol Neurosci. 2022. PMID: 35370540 Free PMC article.
Cited by
-
The Role of Emotion Regulation for General Self-Efficacy in Adolescents Assessed Through Both Neurophysiological and Self-Reported Measures.Psychol Res Behav Manag. 2023 Aug 25;16:3373-3383. doi: 10.2147/PRBM.S406702. eCollection 2023. Psychol Res Behav Manag. 2023. PMID: 37650113 Free PMC article.
-
Anodal transcranial direct current stimulation enhances response inhibition and attention allocation in fencers.PeerJ. 2024 Apr 29;12:e17288. doi: 10.7717/peerj.17288. eCollection 2024. PeerJ. 2024. PMID: 38699193 Free PMC article. Clinical Trial.
-
The effect of paired associative stimulation with a high-intensity cortical component and a high-frequency peripheral component on heart rate and heart rate variability in healthy subjects.Front Rehabil Sci. 2023 Jul 26;4:1200958. doi: 10.3389/fresc.2023.1200958. eCollection 2023. Front Rehabil Sci. 2023. PMID: 37565182 Free PMC article.
-
Modulating prefrontal cortex activity to alleviate stress-induced working memory deficits: A transcranial direct current (tDCS) study.Int J Clin Health Psychol. 2025 Apr-Jun;25(2):100569. doi: 10.1016/j.ijchp.2025.100569. Epub 2025 Apr 18. Int J Clin Health Psychol. 2025. PMID: 40292419 Free PMC article.
-
Effects of Different Transcranial Direct Current Stimulation Intensities over Dorsolateral Prefrontal Cortex on Brain Electrical Activity and Heart Rate Variability in Healthy and Fibromyalgia Women: A Randomized Crossover Trial.J Clin Med. 2024 Dec 11;13(24):7526. doi: 10.3390/jcm13247526. J Clin Med. 2024. PMID: 39768449 Free PMC article.
References
LinkOut - more resources
Full Text Sources
Research Materials
Miscellaneous