. 2022 Dec 1:3:1068455.
doi: 10.3389/fragi.2022.1068455. eCollection 2022.

The serotonin receptor 5-HT2A modulates lifespan and protein feeding in Drosophila melanogaster

Affiliations

The serotonin receptor 5-HT2A modulates lifespan and protein feeding in Drosophila melanogaster

Allyson S Munneke et al. Front Aging. .

Abstract

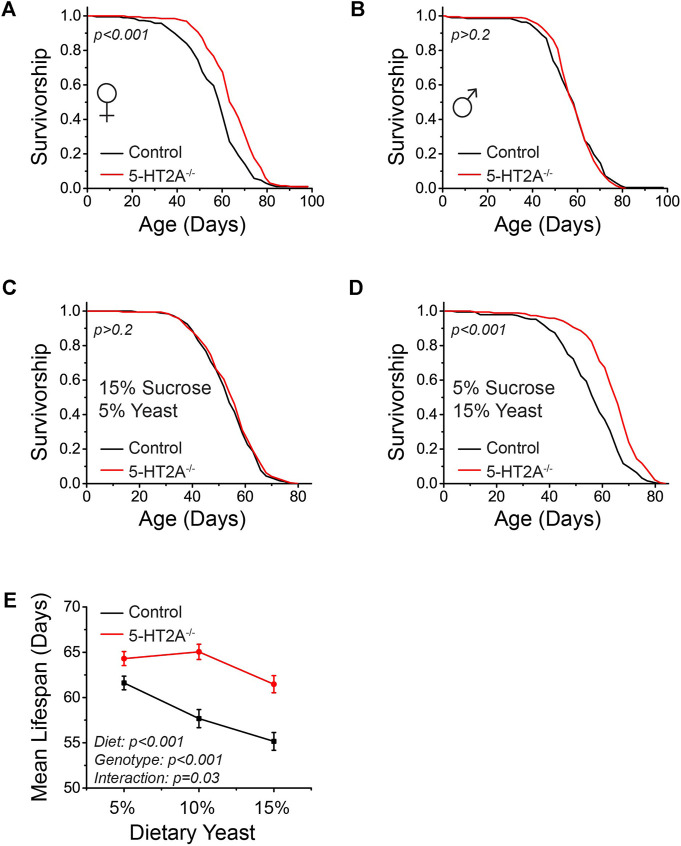
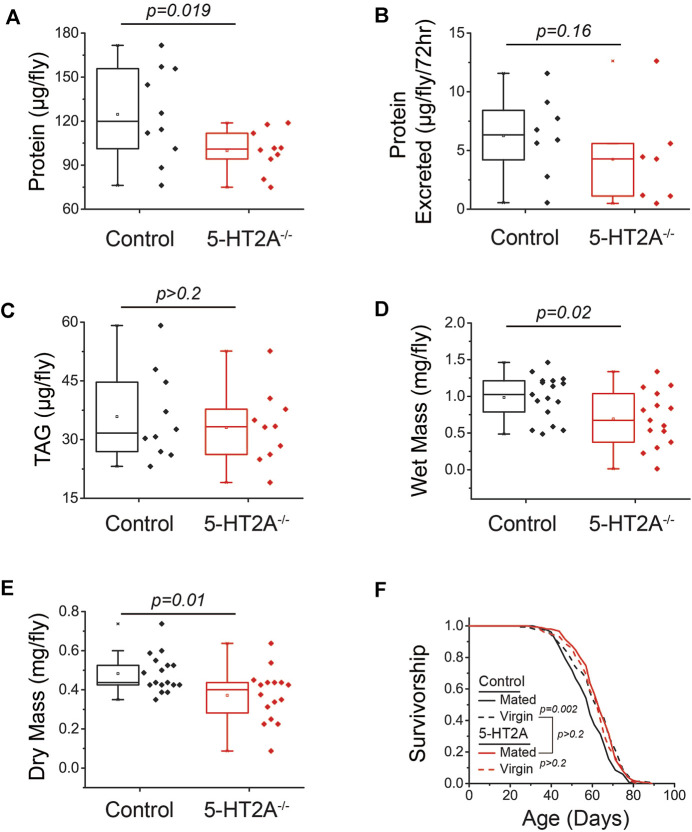
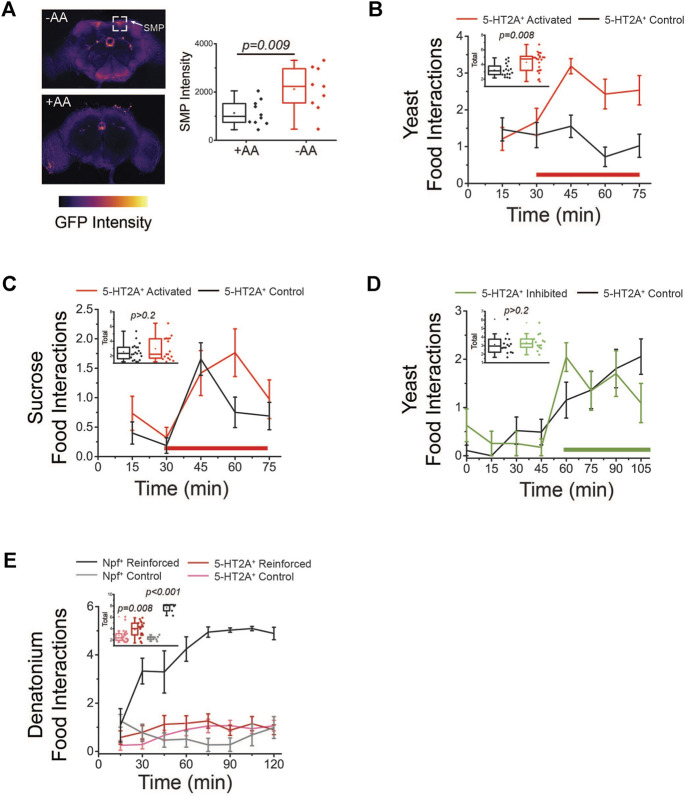
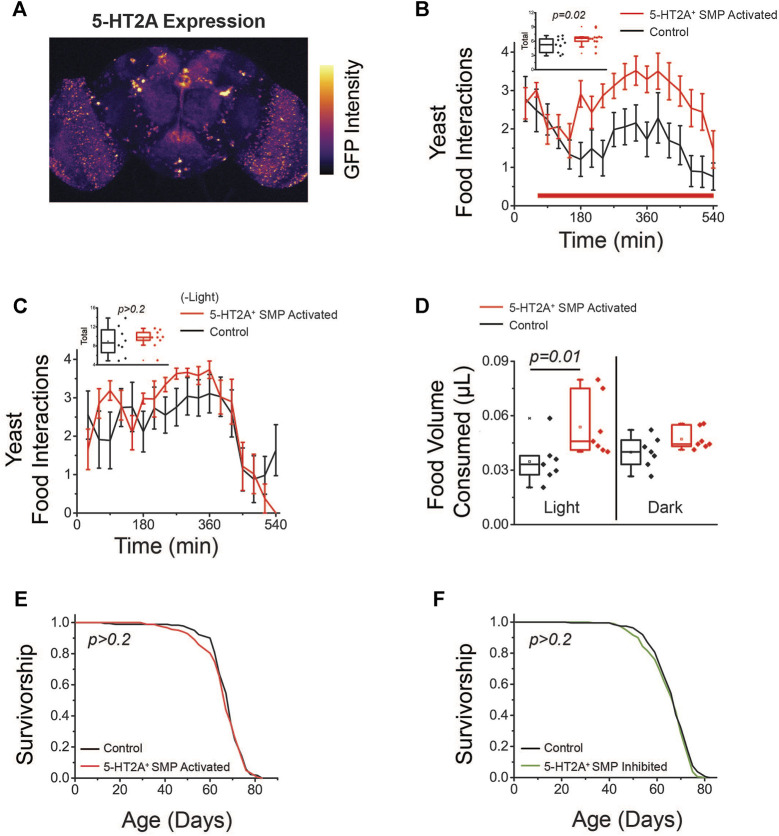
The conserved neurotransmitter serotonin has been shown to be an important modulator of lifespan in specific nutritional contexts; however, it remained unclear how serotonin signaling influences lifespan under normal conditions. Here, we show that serotonin signaling through the 5-HT2A receptor influences lifespan, behavior, and physiology in Drosophila. Loss of the 5-HT2A receptor extends lifespan and induces a resistance to changes in dietary protein that are normally detrimental to lifespan. 5-HT2A -/- null mutant flies also display decreased protein feeding and protein content in the body. Therefore, serotonin signaling through receptor 5-HT2A is likely recruited to promote motivation for protein intake, and chronic reduction of protein-drive through loss of 5-HT2A signaling leads to a lower protein set-point adaptation, which influences physiology, decreases feeding, and increases lifespan. Our findings reveal insights into the mechanisms by which organisms physiologically adapt in response to perceived inability to satisfy demand.

Keywords: Drosophila melanogaster; genetics; lifespan; nutrients; protein; serotonin.


Conflict of interest statement

The authors declare that the research was conducted in the absence of any commercial or financial relationships that could be construed as a potential conflict of interest.

Figures

FIGURE 1
FIGURE 1
5-HT2A interacts with protein levels to modulate lifespan. (A) Female 5-HT2A −/− mutants are long-lived relative to white-eyed Canton-S (w-; CS) controls on a standard laboratory diet consisting of 10% sucrose and 10% yeast (n = 193 and 188, log-rank analysis p < 0.001). (B) Male 5-HT2A −/− mutants are not long-lived relative to w-; CS controls on a 10% sucrose and 10% yeast diet (n = 194 and 192, log-rank analysis p = 0.71). (C) 5-HT2A −/− mutant females do not show a lifespan extension on a 15% sucrose/5% yeast diet (n = 193 and 185, log-rank analysis p = 0.4). (D) 5-HT2A −/− mutant females are long-lived on a 5% sucrose/15% yeast diet (n = 195 and 193, log-rank analysis p < 0.001). (E) The mean lifespan of w-; CS control females decreases significantly as dietary protein increases (n = 187–195, One-way ANOVA Diet: p < 0.001), and dietary protein slightly significantly affects lifespan in 5-HT2A −/− mutant females (n = 187–195, One-way ANOVA Diet: p = 0.01). The 5-HT2A −/− mutant lifespan is significantly different from that of controls across diets containing 5%–15% yeast (n = 187–195, ANCOVA Diet: p < 0.001 Genotype: p < 0.001 Interaction: p = 0.03). Censored observations were ignored for the analysis of mean longevity.
FIGURE 2
FIGURE 2
5-HT2A modulates the protein consumption set-point. (A) As dietary yeast increases, both 5-HT2A −/− mutants and w-; CS controls consume less (n = 10 where each replicate is comprised of 10 flies, ANCOVA Diet: p < 0.001 Genotype: p = 0.003 Interaction: p = 0.242), and when these data are scaled to represent the mass of protein consumed across diets, (B) 5-HT2A −/− mutants show a decreased protein consumption target across diets (n = 10 where each replicate is comprised of 10 flies, ANCOVA Diet: p = 0.322 Genotype: p < 0.001 Interaction: p = 0.605). Relative to controls, 5-HT2A −/− mutants show no differences from controls in the (C) total volume (n = 8–10 where each replicate is comprised of 10 flies, ANCOVA Diet: p < 0.001 Genotype: p = 0.263 Interaction: p = 0.594) or (D) mass of sucrose consumed across three different concentrations of a sucrose-only diet (n = 8–10 where each replicate is comprised of 10 flies, ANCOVA Diet: p < 0.001 Genotype: p = 0.409 Interaction: p = 0.996). All experiments were conducted in females.
FIGURE 3
FIGURE 3
5-HT2A modulates protein body content. (A) 5-HT2A −/− mutants show reduced protein levels relative to controls, as measured by BCA (n = 10 where each replicate is comprised of 5 flies, one-sided t-test p = 0.019) (B) but excrete the same levels of protein as controls (n = 7 and 8 where each replicate is comprised of 20 flies, one-sided t-test p = 0.16). (C) 5-HT2A −/− mutants show no differences in triglyceride (TAG) levels relative to controls (n = 10 where each replicate is comprised of 5 flies, two-sided t-test p = 0.56). 5-HT2A −/− mutants show a significant reduction in (D) wet mass (n = 15–17 where each replicate is comprised of 8 flies, two-sided t-test p = 0.02) and (E) dry mass relative to controls (two-sided t-test p = 0.01). (F) Lifespan of control flies is shortened by mating (n = 153 and 146, log-rank analysis p = 0.002), while the and the lifespan of 5-HT2A −/− mutants is not (n = 151 and 134, log-rank analysis p = 0.3) and is not significantly different from control virgin lifespan (n = 151 and 146, log-rank analysis p = 0.9). All experiments were conducted in females.
FIGURE 4
FIGURE 4
Activation of 5-HT2A + neurons promotes protein feeding behaviors. (A) Amino acid (AA) deprivation activates 5-HT2A + neurons in the superior medial protocerebrum (SMP, top) relative to amino acid replete controls (bottom). Quantification of SMP intensity (n = 10 and 9, two-sided t-test p = 0.009). (B) Activation of 5-HT2A + neurons (red bar indicates red light activation period) promotes acute interaction with a protein solution. Inset: Quantification of total interactions during the light period (n = 15 and 22, one-sided t-test p = 0.008). (C) Activation of 5-HT2A + neurons (red bar indicates red light activation period) does not significantly alter interactions with a sucrose-only solution. Inset: Quantification of total interactions during the light period (n = 18 and 15, two-sided t-test p = 0.32). (D) Inhibition of 5-HT2A + neurons (green bar indicates green light inhibition period) does not alter interactions with a protein solution. Inset: Quantification of total interactions during the light period (n = 15 and 17, two-sided t-test p = 0.5). (E) Closed-loop activation (red bar indicates red light reinforcement period) of 5-HT2A + neurons modestly increases interactions with a denatonium solution compared to activation of Npf + neurons. Inset: Quantification of total interactions for closed-loop activation of Npf + neurons (n = 6, two-sided t-test p < 0.001) and 5-HT2A + neurons (n = 24, two-sided t-test p = 0.008). All experiments were conducted in females.
FIGURE 5
FIGURE 5
Activation of 5-HT2A + SMP neurons promotes protein feeding behaviors. (A) GFP labeling of neurons driven by 5-HT2A-GAL4 in the brain (image is a max projection). (B) Activation of 5-HT2A + SMP neurons (red bar indicates red light activation period) promotes acute interaction with a protein solution. Inset: Quantification of total interactions during the light period (n = 11 and 12, one-sided t-test p = 0.02). (C) Flies expressing CsChrimson in 5-HT2A + SMP neurons do not show differences in interactions with a protein solution in the absence of red light activation (n = 8 and 9, two-sided t-test p = 0.68). (D) Activation of 5-HT2A + SMP neurons promotes consumption of high protein solid food (n = 7 where each replicate consists of 10 flies, one-sided t-test p = 0.01) and flies expressing CsChrimson in 5-HT2A + SMP neurons do not show differences in solid food consumption relative to controls in the absence of red light activation (n = 7 where each replicate is comprised of 10 flies, one-sided t-test p = 0.09). (E) Activation (n = 182 and 185, log-rank analysis p = 0.5) and (F) inhibition (n = 186 and 191, log-rank analysis p = 0.2) of 5-HT2A + SMP neurons have no effect on lifespan relative to genotypic controls maintained in constant darkness. All experiments were conducted in females.

References

    1. Anisimov V. N., Berstein L. M., Egormin P. A., Piskunova T. S., Popovich I. G., Zabezhinski M. A., et al. (2005). Effect of metformin on life span and on the development of spontaneous mammary tumors in HER-2/neu transgenic mice. Exp. Gerontol. 40 (8-9), 685–693. 10.1016/j.exger.2005.07.007 - DOI - PubMed
    1. Apfeld J., Kenyon C. (1999). Regulation of lifespan by sensory perception in Caenorhabditis elegans . Nature 402 (6763), 804–809. 10.1038/45544 - DOI - PubMed
    1. Bruce K. D., Hoxha S., Carvalho G. B., Yamada R., Wang H-D., Karayan P., et al. (2013). High carbohydrate–low protein consumption maximizes Drosophila lifespan. Exp. Gerontol. 48 (10), 1129–1135. 10.1016/j.exger.2013.02.003 - DOI - PMC - PubMed
    1. Burkewitz K., Morantte I., Weir H. J. M., Yeo R., Zhang Y., Huynh F. K., et al. (2015). Neuronal CRTC-1 governs systemic mitochondrial metabolism and lifespan via a catecholamine signal. Cell 160 (5), 842–855. 10.1016/j.cell.2015.02.004 - DOI - PMC - PubMed
    1. Burkewitz K., Weir H. J., Mair W. B. (2012). AMPK as a pro-longevity target. Exp. Suppl. 107, 227–256. 10.1007/978-3-319-43589-3_10 - DOI - PubMed

LinkOut - more resources