

Modeling historical budget for β-Hexachlorocyclohexane (HCH) in the Arctic Ocean: A contrast to α-HCH
- PMID: 36531934
- PMCID: PMC9755237
- DOI: 10.1016/j.ese.2022.100229
Modeling historical budget for β-Hexachlorocyclohexane (HCH) in the Arctic Ocean: A contrast to α-HCH
Abstract
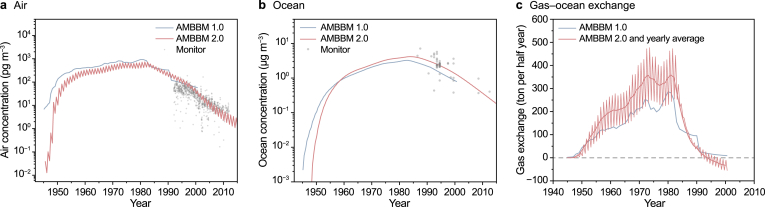
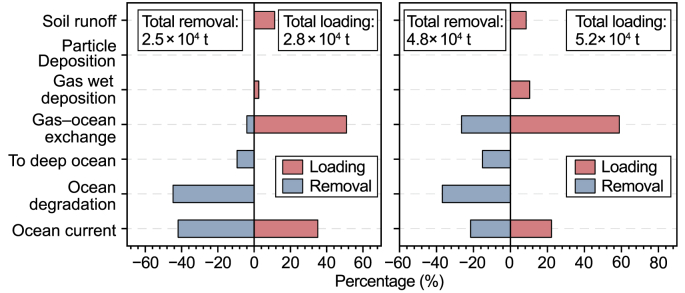
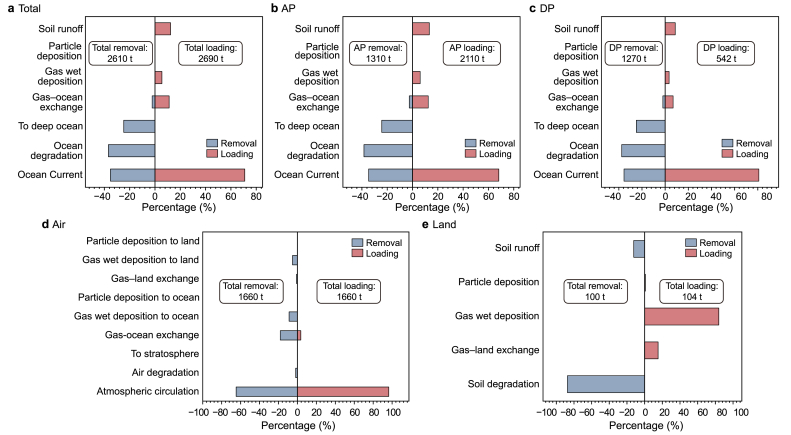
The historical annual loading to, removal from, and cumulative burden in the Arctic Ocean for β-hexachlorocyclohexane (β-HCH), an isomer comprising 5-12% of technical HCH, is investigated using a mass balance box model from 1945 to 2020. Over the 76 years, loading occurred predominantly through ocean currents and river inflow (83%) and only a small portion via atmospheric transport (16%). β-HCH started to accumulate in the Arctic Ocean in the late 1940s, reached a peak of 810 t in 1986, and decreased to 87 t in 2020, when its concentrations in the Arctic water and air were ∼30 ng m-3 and ∼0.02 pg m-3, respectively. Even though β-HCH and α-HCH (60-70% of technical HCH) are both the isomers of HCHs with almost identical temporal and spatial emission patterns, these two chemicals have shown different major pathways entering the Arctic. Different from α-HCH with the long-range atmospheric transport (LRAT) as its major transport pathway, β-HCH reached the Arctic mainly through long-range oceanic transport (LROT). The much higher tendency of β-HCH to partition into the water, mainly due to its much lower Henry's Law Constant than α-HCH, produced an exceptionally strong pathway divergence with β-HCH favoring slow transport in water and α-HCH favoring rapid transport in air. The concentration and burden of β-HCH in the Arctic Ocean are also predicted for the year 2050 when only 4.4-5.3 t will remain in the Arctic Ocean under the influence of climate change.
Keywords: Air-water exchange; Arctic Ocean; Budget; Mass balance model; β-Hexachlorocyclohexane.
© 2022 The Authors.
Conflict of interest statement
The authors declare that they have no known competing financial interests or personal relationships that could have appeared to influence the work reported in this paper.
Figures


References
-
- Kutz F.W., Wood P.H., Bottimore D.P. Organochlorine pesticides and polychlorinated biphenyls in human adipose tissue. Rev. Environ. Contam. Toxicol. 1991;120:1–82. - PubMed
-
- Li Y.F. Global gridded technical hexachlorocyclohexane usage inventories using a global cropland as a surrogate. J. Geophys. Res. Atmos. 1999;104(D19):23785–23797.
-
- Li Y.F. Global technical hexachlorocyclohexane usage and its contamination consequences in the environment: from 1948 to 1997. Sci. Total Environ. 1999;232(3):121–158.
-
- Li Y.F., Macdonald R.W. Sources and pathways of selected organochlorine pesticides to the Arctic and the effect of pathway divergence on HCH trends in biota: a review. Sci. Total Environ. 2005;342(1):87–106. - PubMed
-
- Tanabe S., Tatsukawa R. Chlorinated hydrocarbons in the North Pacific and Indian Oceans. J. Oceanogr. Soc. Jpn. 1980;36(4):217–226.
LinkOut - more resources
Full Text Sources
