. 2022 Dec 1:13:1063690.
doi: 10.3389/fimmu.2022.1063690. eCollection 2022.

Distinctive phenotype for HLA-E- versus HLA-A2-restricted memory CD8 αβT cells in the course of HCMV infection discloses features shared with NKG2C+CD57+NK and δ2-γδT cell subsets

Affiliations

Distinctive phenotype for HLA-E- versus HLA-A2-restricted memory CD8 αβT cells in the course of HCMV infection discloses features shared with NKG2C+CD57+NK and δ2-γδT cell subsets

Amélie Rousselière et al. Front Immunol. .

Abstract

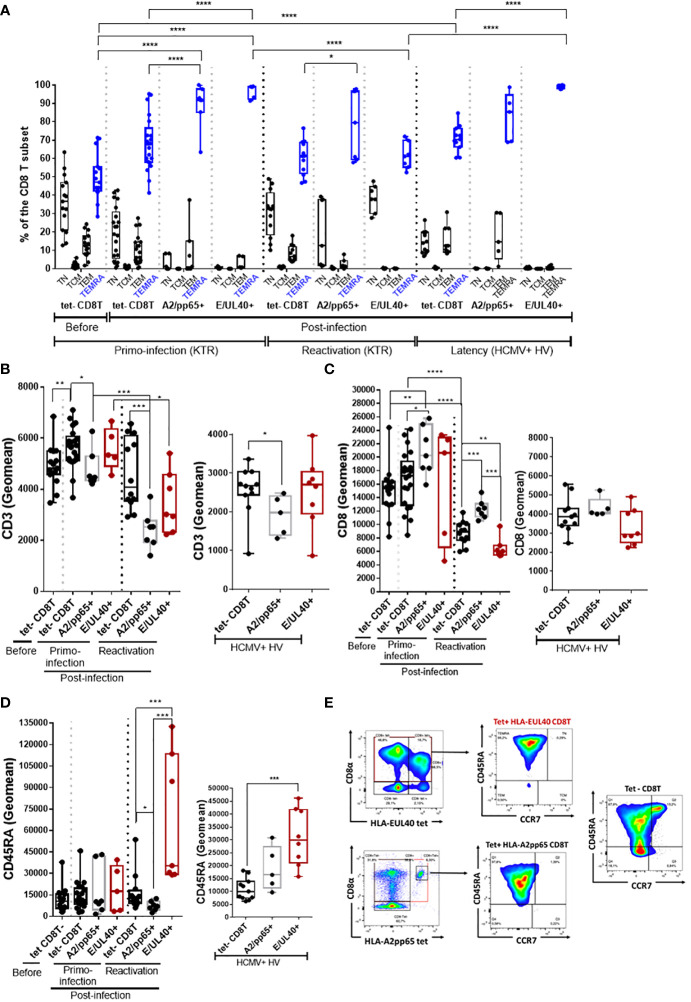
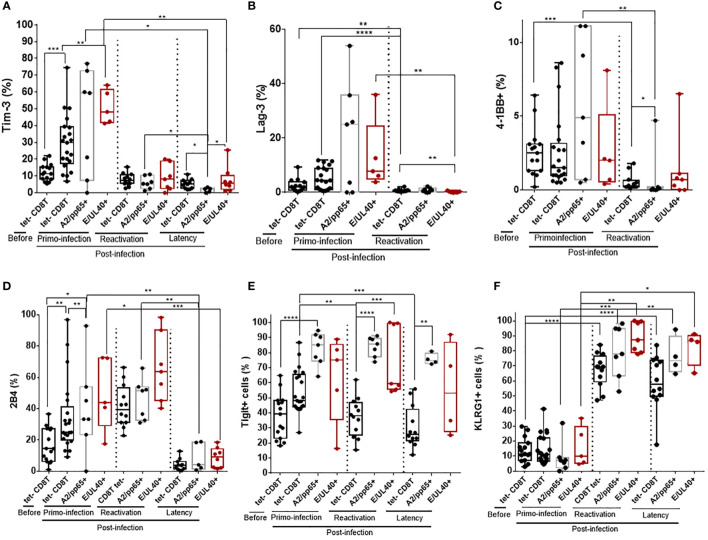
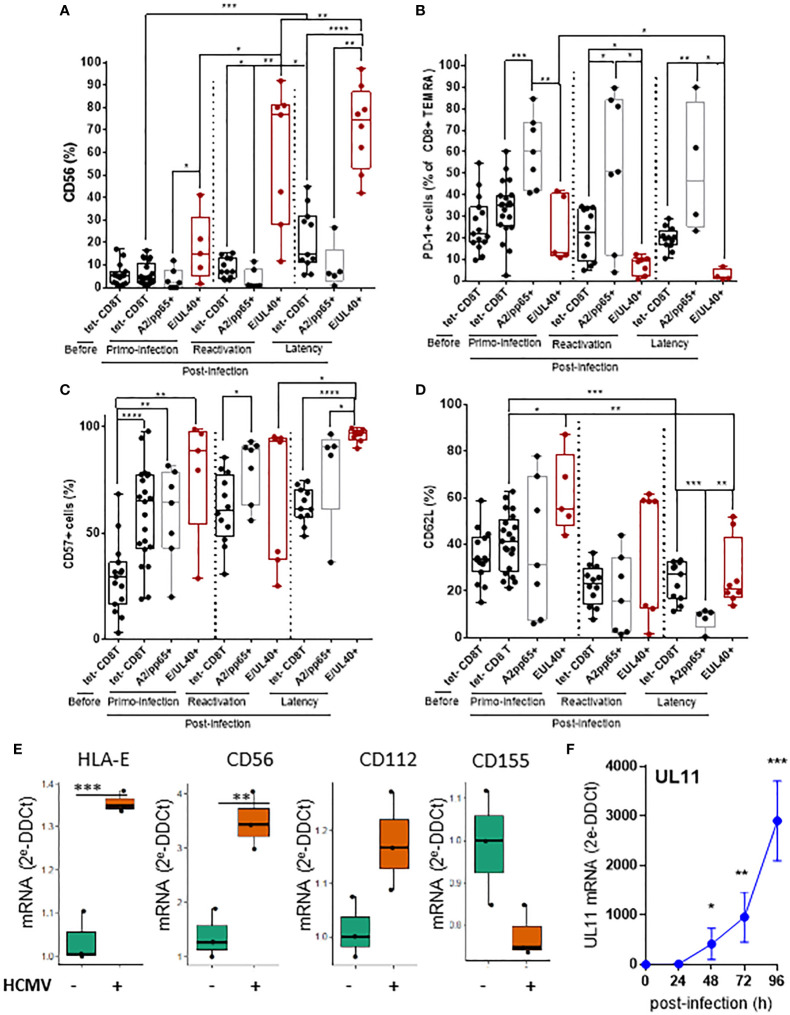
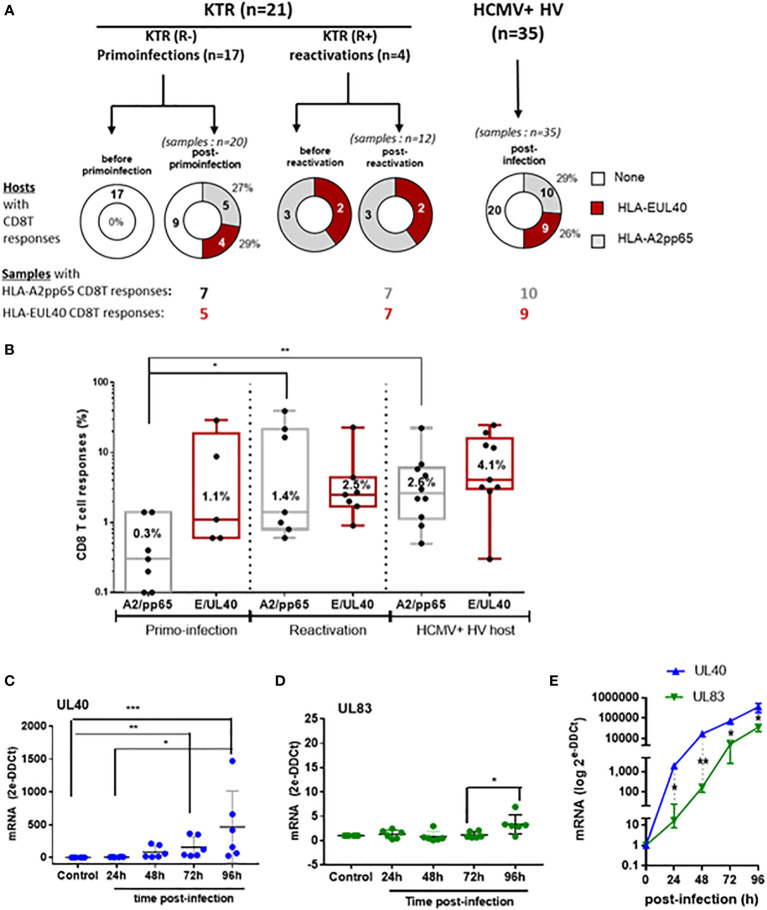
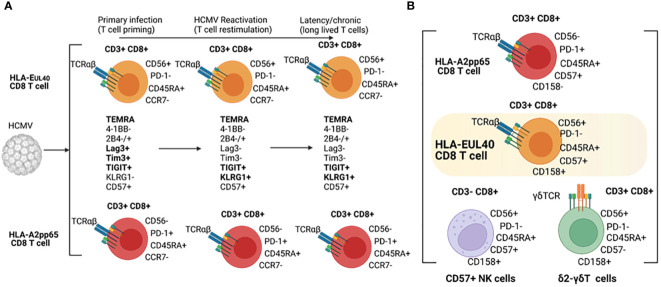
The human cytomegalovirus (HCMV) triggers both innate and adaptive immune responses, including protective CD8+ αβT cells (CD8T) that contributes to the control of the infection. In addition to CD8T restricted by classical HLA class Ia molecules, HCMV also triggers CD8T recognizing peptides from the HCMV UL40 leader peptide and restricted by HLA-E molecules (HLA-EUL40 CD8T). This study investigated the frequency, phenotype and functions of HLA-EUL40 CD8T in comparison to the immunodominant HLA-A2pp65 CD8T upon acute (primary or secondary infection) or chronic infection in kidney transplant recipients (KTR) and in seropositive (HCMV+) healthy volunteer (HV) hosts. The frequency of hosts with detected HLA-EUL40 CD8T was similar after a primary infection (24%) and during viral latency in HCMV+ HV (26%) and equal to the frequency of HLA-A2pp65 CD8T cells in both conditions (29%). Both CD8T subsets vary from 0.1% to >30% of total circulating CD8T according to the host. Both HLA-EUL40 and HLA-A2pp65 CD8T display a phenotype specific of CD8+ TEMRA (CD45RA+/CCR7-) but HLA-EUL40 CD8T express distinctive level for CD3, CD8 and CD45RA. Tim3, Lag-3, 4-1BB, and to a lesser extend 2B4 are hallmarks for T cell priming post-primary infection while KLRG1 and Tigit are markers for restimulated and long lived HCMV-specific CD8T responses. These cell markers are equally expressed on HLA-EUL40 and HLA-A2pp65 CD8T. In contrast, CD56 and PD-1 are cell markers discriminating memory HLA-E- from HLA-A2-restricted CD8T. Long lived HLA-EUL40 display higher proliferation rate compared to HLA-A2pp65 CD8T consistent with elevated CD57 expression. Finally, a comparative immunoprofiling indicated that HLA-EUL40 CD8T, divergent from HLA-A2pp65 CD8T, share the expression of CD56, CD57, NKG2C, CD158 and the lack of PD-1 with NKG2C+CD57+ NK and δ2-γδT cells induced in response to HCMV and thus defines a common immunopattern for these subsets.

Keywords: CD56; CD8 T cells; HCMV; HLA-E; NK; PD-1; γδT.


Conflict of interest statement

The authors declare that the research was conducted in the absence of any commercial or financial relationships that could be construed as a potential conflict of interest.

Figures

Figure 1
Figure 1
Detection and quantification of HCMV-specific CD8Tcell responses in KTR and HV and time course analysis of viral UL40 and UL83 (pp65) post-infection. (A) Donut charts showing the numberof hosts with HCMV-specific CD8Tcell responses (HLA-EUL40, HLA-A2pp65, none) including KTR before and after a primary infection (R-), virus reactivation (R+) and in HCMV+ healthy controls (HV). The number of samples containing the differents HCMV-specific CD8T responses in the groups are indicated. (B) Box plots with median and interquartile values of the percentages of HCMV-specific CD8Tcell responses (HLA-EUL40, HLA-A2pp65) detected in blood among total CD8Tcells in samples from KTR after a HCMV primary infection (7 A2pp65 responses and 5 EUL40 responses), a reactivation (7 A2pp65 responses and 7 EUL40 responses), and in HCMV+ HV (10 A2pp65 responses and 9 EUL40 responses). Each point corresponds to an individual CD8Tcell response. (C–E) Quantitative RT-PCR analysis of viral mRNA levels for UL40 and UL83/pp65 in HCMV-infected primary endothelial cells (n=5) (C, D). Each point corresponds to an independant endothelial cell culture. (E) Quantitative RT-PCR analysis of viral mRNA levels for UL40 and UL83/pp65 in HCMV-infected MRC5 cells. Controls are uninfected cells. Results are medians from 5 independent endothelial cell cultures (C, D) or means ± SD from triplicate experiments for MRC5 cells (E) and are expressed as 2-ΔΔCt values normalized to the RPLP0 housekeeping gene. Statistical analysis was performed by Mann-Whitney U-test. P values: * for p < 0.05, ** for p<0.01 and *** for p<0.001.
Figure 2
Figure 2
HLA-EUL40 memory CD8Tcells are TEMRA cells with distinctive levels for CD3, CD8 and CD45RA compared to HLA-A2pp65 CD8Tcells. After immunostaining and fluorescence acquisition CD8Tcell populations were defined using a dedicated gating strategy as reported in the Materials and methods section and in Fig S3 in order to identify tetramer- CD8Tcells (tet-CD8T), HLA-EUL40 (E/UL40+) and HLA-A2pp65 (A2/pp65+) CD8 T cells. (A–D) Box plots representations of analyses performed on HLA-EUL40 CD8T cells from KTR with a primary infection (n=5), a reactivation (n=7), from HV at latency (n=9) and on HLA-A2pp65 CD8T cells from KTR with a primary infection (n=7), a reactivation (n=7), from HV at latency (n=10) and the respective tet- CD8T cells. Each point corresponds to a single CD8T response (A) Differentiation stage determined using CD45RA and CCR7 costaining to define naive T, central memory T cells (TCM), effector memory T cells (TEM) and terminally differentiated effector memory T cells reexpressing CD45RA (TEMRA). Data are expressed as percents of total CD8+ αβT cells in the respective subsets. Statistical analysis was performed by two-way Anova test. Comparative expression levels for CD3 (B), CD8 (C) and CD45RA (D) in KTR before and post-infection (primary or reactivation) and HCMV+ HV (latency). Data are expressed as specific fluorescence intensities (geomeans). (E) Representative flow histograms illustrating CD8α and CD45RA expression at the surface of tetramer- CD8Tcells (tet-CD8T), HLA-EUL40 (E/UL40+) and HLA-A2pp65 (A2/pp65+) CD8Tcells. (B–D) Statistical analysis was performed by Mann-Whitney U-test. p values: *for p < 0.05, **for p<0.01, ***for p<0.001 and ****for p<0.0001.
Figure 3
Figure 3
Immunophenotype of HLA-EUL40 and HLA-A2pp65 memory CD8 T cells after a primary HCMV infection, a reactivation in KTR and during chronic infection in HCMV+ HV. After immunostaining and fluorescence acquisition, CD8Tcell populations were defined using a dedicated gating strategy as reported in the Materials and methods section and in Figure S3 in order to identify pMHC tetramer- CD8Tcells (tet-CD8T), HLA-EUL40 (E/UL40+) and HLA-A2pp65 (A2/pp65+) CD8Tcells. Box plots with median and interquartile values showing the specific expression for Tim-3 (A), Lag-3 (B), 4-1BB (C), 2B4 (D), Tigit (E) and KLRG1 (F). Results are expressed as percents of positive cells in the different CD8 T cell subsets. (A–F) Box plots with median and interquartile values for analyses performed on HLA-EUL40 CD8T cells from KTR with a primary infection (n=5), a reactivation (n=7), from HV with chronic infection/latency (HV; n=9) and on HLA-A2pp65 CD8T cells from KTR with a primary infection (n=7), a reactivation (n=7), from HV with chronic infection/latency (n=10) and the respective tet- CD8T cells. Each point corresponds to an individual CD8T response. Statistical analysis was performed by Mann-Whitney U-test. P values: *for p < 0.05, **for p<0.01, ***for p<0.001 and ****for p<0.0001.
Figure 4
Figure 4
T cell markers discriminating HLA-E- from HLA-A2-restricted HCMV-specific CD8T cells and expression of related ligands on HCMV infected cells. After immunostaining and fluorescence acquisition, CD8Tcell populations were defined using a dedicated gating strategy as reported in the FigS3 in order to identify pMHC tetramer- CD8Tcells (tet-CD8T), HLA-EUL40 (E/UL40+) and HLA-A2pp65 (A2/pp65+) CD8Tcells. (A–D) Box plots with median and interquartile values for analyses performed on HLA-EUL40 CD8T cells from KTR with a primary infection (n=5), a reactivation (n=7), HV (n=9) and on HLA-A2pp65 CD8T cells from KTR with a primary infection (n=7), a reactivation (n=7), HV (n=10) and the respective tet- CD8T cells. Specific expression for CD56 (A), PD-1 (B), CD57 (C), and CD62L (D) are shown. Results are expressed as percents of positive cells in the different CD8Tcell subsets. Each point corresponds to an individual CD8T response. Statistical analysis was performed by Mann-Whitney U-test. (E, F) Quantitative variations in mRNA levels for cellular (E) HLA-E, CD56, CD112, CD155 and viral (F) UL11 in primary human endothelial cell cultures after HCMV infection. Results from qRT-PCR are means ± SD obtained from 5 independent endothelial cell cultures and are expressed as 2-ΔΔCt values normalized to the RPLP0 housekeeping gene.R and the web application FaDa (https://github.com/danger-r/FaDAapp) were used for (E). Statistical analysis was performed by Mann-Whitney U-test. P values: * for p < 0.05, ** for p<0.01, *** for p<0.005 and **** for p<0 .001.
Figure 5
Figure 5
Proliferation and effector capacities for HLA-EUL40 versus HLA-A2pp65 CD8T cells. PBMC from HCMV+ HV possessing either HLA-A2pp65 (n=4) or HLA-EUL40 (n=5) CD8T cell responses were used. (A–C) For proliferation assays, PBMC were loaded with Cell Proliferation Dye and cultured for 4 days on culture plates either uncoated or coated with anti-CD3 and anti-CD8 mAbs before immunostaining. The number of cell division was quantified using Flowjo® after gating on live CD3+ γδTCR- CD8+ tetramer positive (tet+) HLA-EUL40 or HLA-A2pp65 and tetramer negative (tet-) T cell populations. Analyses comparing cell division for HLA-EUL40 and HLA-A2pp65 CD8T cell populations (A), HLA-EUL40 and tet- CD8T cell populations (B) and HLA-A2pp65 and tet- CD8T cell populations (C) are shown. Data are expressed as percentages of cells in the cycles. (D) Level of membrane CD107a, granzyme B (GzmB) expression and intracellular TNF, IFNγ and IL-2 expressed by HLA-EUL40 and HLA-A2pp65 CD8T cell populations before (unstim) and after (stim) a 4h-stimulation assay in the presence of PMA/ionomycin. Each point represents an independant CD8T cell response. Data are expressed as percents of positive cells among tet+ CD8T cells. Statistical analysis was performed by Mann-Whitney U-test. P values: *for p < 0.05.
Figure 6
Figure 6
Phenotypic proximity of HLA-EUL40 CD8 αβT cells with NKG2C+CD57+ NK and δ2-γδT cells. Immunophenotypes comparing HLA-EUL40 CD8T cells to tetramer negative (tet-) and HLA-A2pp65 CD8 αβT, γδT and NK subsets based on their respective expression of CD3, CD8, CD45RA, CD56, CD57, PD-1, CD16, CD158 and NKG2C. Data were obtained from 4 individuals. (A) Radar plots showing the mean of percentages of expressing cells in the different cell subsets for each cell marker. (B) Histograms show the means ± SD of fluorecence intensity for expressing cells in the different cell subsets for each cell markers. P values for comparison between HLA-EUL40 CD8T and the other immune subsets: (C) Detection of CD8T cells using, in parallel experiments, a set of markers (CD3, CD8, CD45RA, CCR7, CD56, CD57, PD-1 and CD158) or HLA-EUL40 tetramers (EUL40 tet+) for cell gating on the same PBMC from HCMV+ individuals with (n=3) and without (n=4) HLA-EUL40 tet+ CD8T cells. Results are shown as box plots with medians and interquartiles values. Statistical analysis was performed by Mann-Whitney U-test. P values: *for p < 0.05, **for p<0.01, ***for p<0.005.
Figure 7
Figure 7
Phenotypical hallmarks of HLA-EUL40 CD8Tcells. (A) Phenotype of HLA-EUL40 CD8T in the course of HCMV infection and (B) Common phenotypic traits shared by HLA-EUL40 CD8T, CD8αβT, δ2-γδT and CD57+ NK cells.

Similar articles

Cited by

References

    1. Adland E, Klenerman P, Goulder P, Matthews PC. Ongoing burden of disease and mortality from HIV/CMV coinfection in Africa in the antiretroviral therapy era. Front Microbiol (2015) 6:1016. doi: 10.3389/fmicb.2015.01016 - DOI - PMC - PubMed
    1. Griffiths P, Baraniak I, Reeves M. The pathogenesis of human cytomegalovirus. J Pathol (2015) 235(2):288–97. doi: 10.1002/path.4437 - DOI - PubMed
    1. Forte E, Zhang Z, Thorp EB, Hummel M. Cytomegalovirus latency and reactivation: An intricate interplay with the host immune response. Front Cell Infect Microbiol (2020) 10:130. doi: 10.3389/fcimb.2020.00130 - DOI - PMC - PubMed
    1. Zhang N, Bevan MJ. CD8(+) T cells: foot soldiers of the immune system. Immunity (2011) 35(2):161–8. doi: 10.1016/j.immuni.2011.07.010 - DOI - PMC - PubMed
    1. Klenerman P, Oxenius A. T Cell responses to cytomegalovirus. Nat Rev Immunol (2016) 16(6):367–77. doi: 10.1038/nri.2016.38 - DOI - PubMed

Publication types

Substances