

A prognostic and therapeutic hallmark developed by the integrated profile of basement membrane and immune infiltrative landscape in lung adenocarcinoma
- PMID: 36532024
- PMCID: PMC9748099
- DOI: 10.3389/fimmu.2022.1058493
A prognostic and therapeutic hallmark developed by the integrated profile of basement membrane and immune infiltrative landscape in lung adenocarcinoma
Abstract
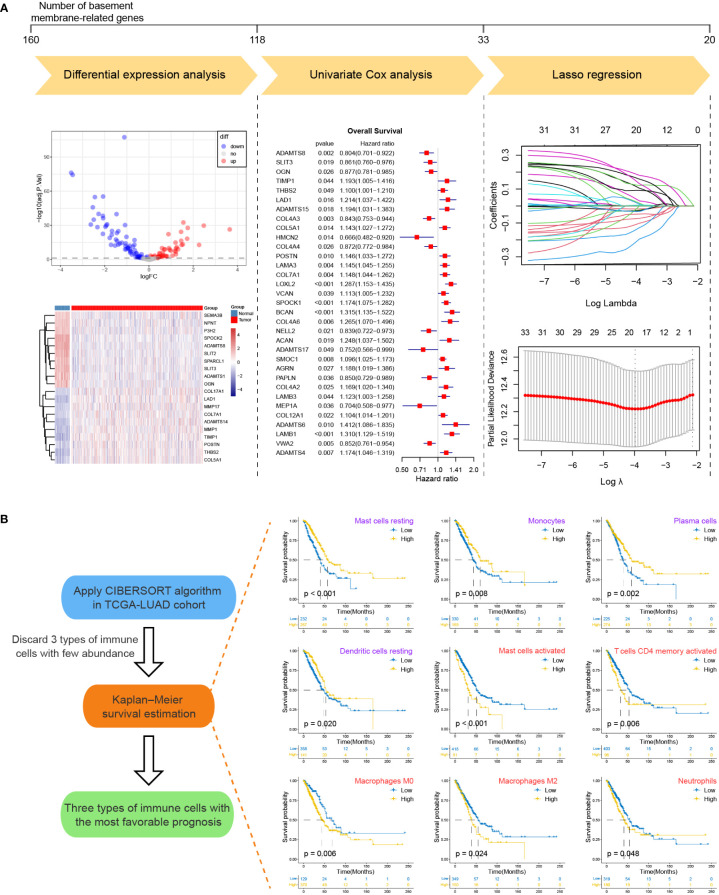
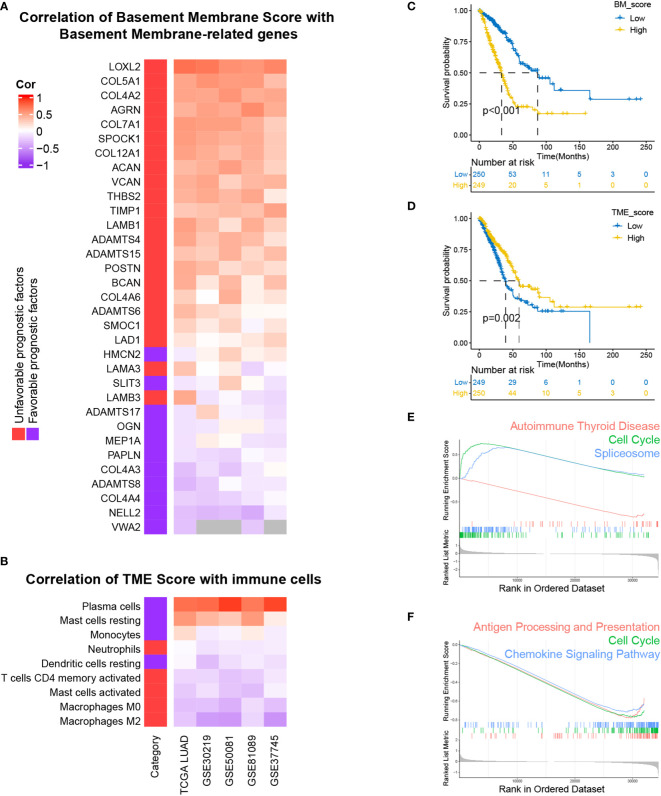
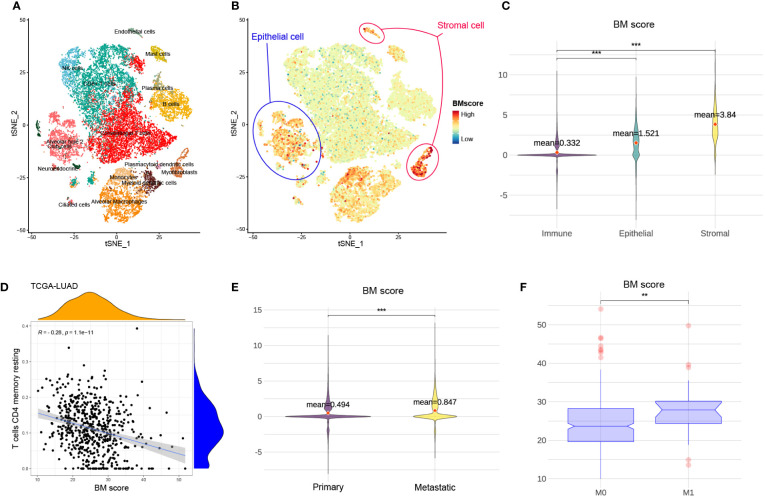
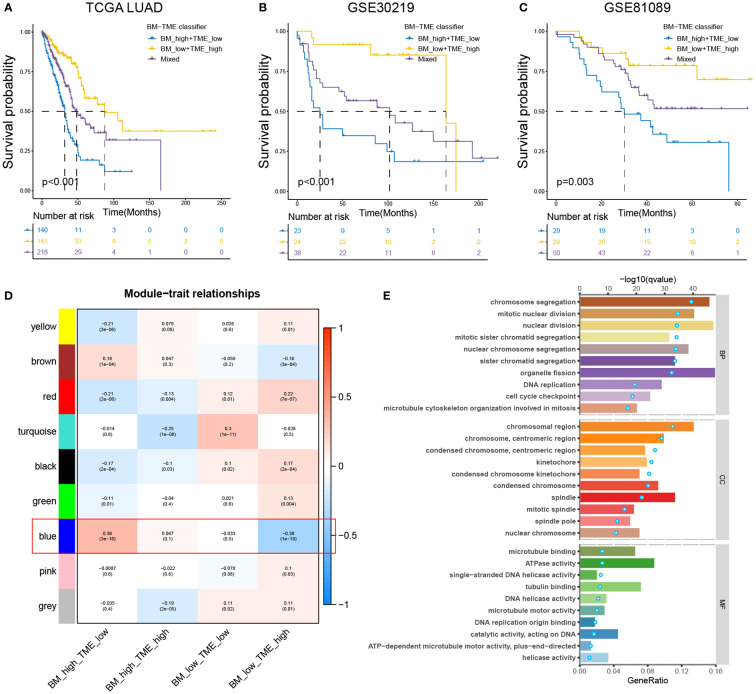
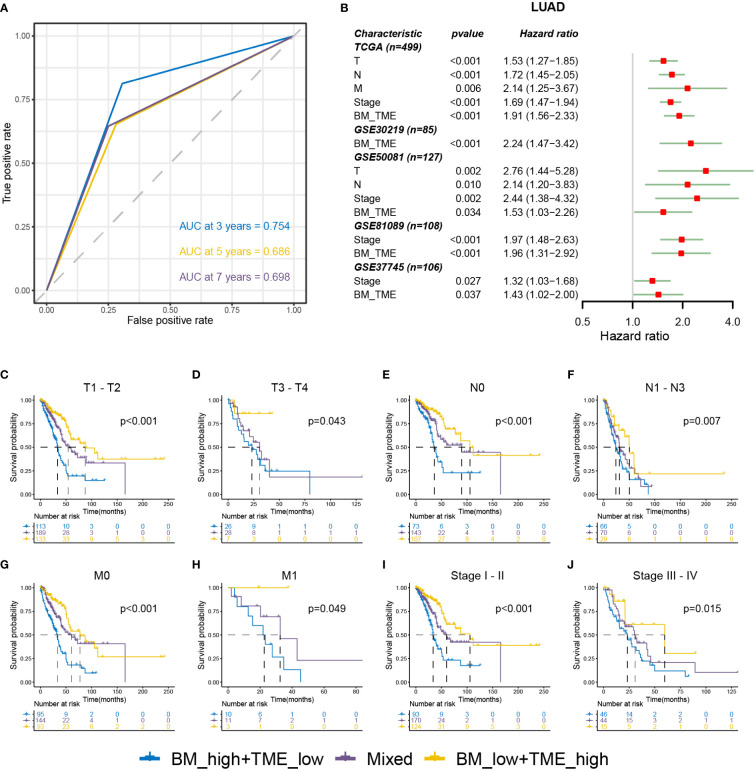
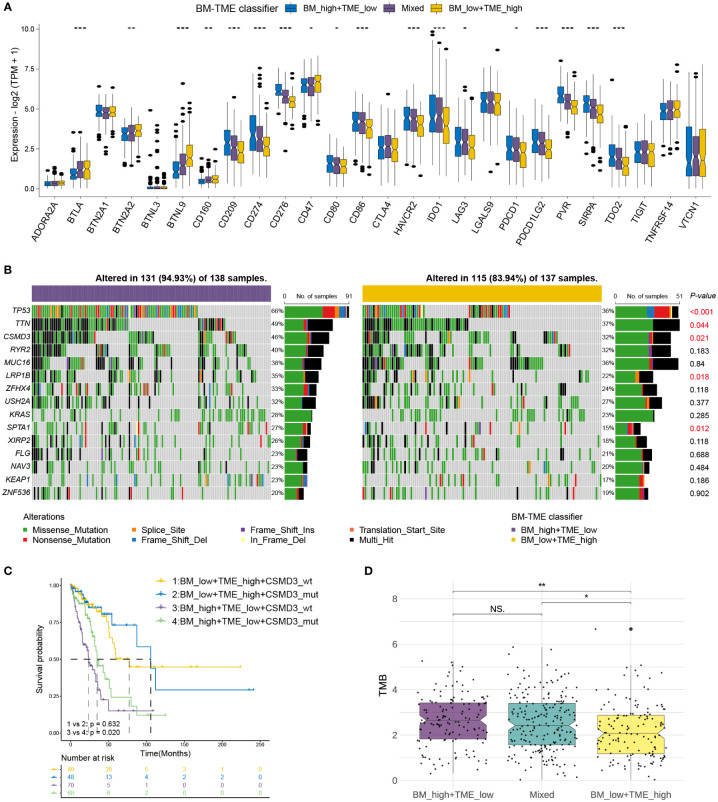
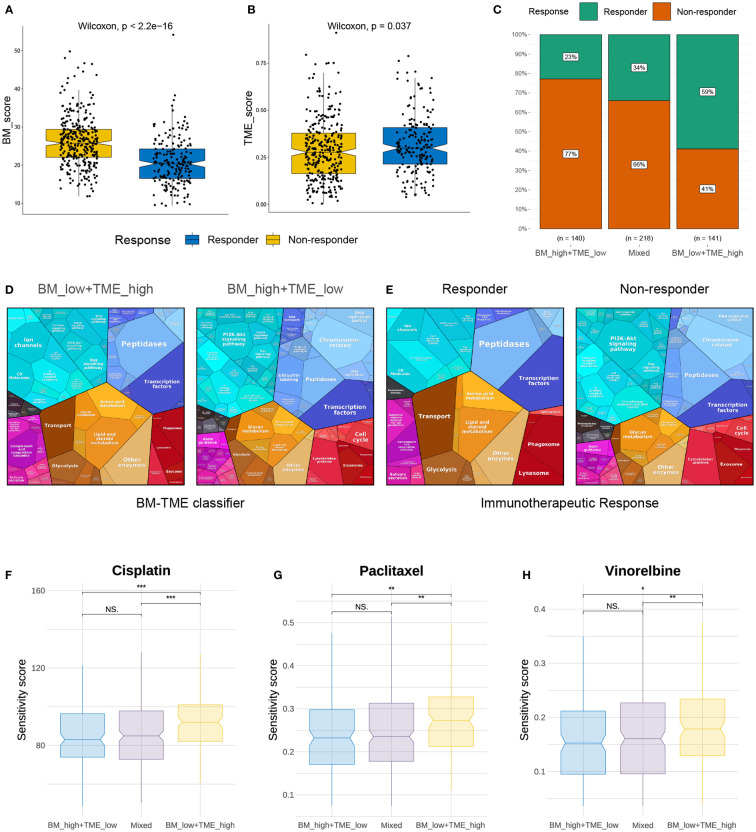
Basement membranes (BMs) are specialised extracellular matrices that maintain cellular integrity and resist the breaching of carcinoma cells for metastases while regulating tumour immunity. The tumour immune microenvironment (TME) is essential for tumour growth and the response to and benefits from immunotherapy. In this study, the BM score and TME score were constructed based on the expression signatures of BM-related genes and the presence of immune cells in lung adenocarcinoma (LUAD), respectively. Subsequently, the BM-TME classifier was developed with the combination of BM score and TME score for accurate prognostic prediction. Further, Kaplan-Meier survival estimation, univariate Cox regression analysis and receiver operating characteristic curves were used to cross-validate and elucidate the prognostic prediction value of the BM-TME classifier in several cohorts. Findings from functional annotation analysis suggested that the potential molecular regulatory mechanisms of the BM-TME classifier were closely related to the cell cycle, mitosis and DNA replication pathways. Additionally, the guiding value of the treatment strategy of the BM-TME classifier for LUAD was determined. Future clinical disease management may benefit from the findings of our research.
Keywords: basement membrane; chemotherapy drug screening; immune infiltration; immunotherapy response; lung adenocarcinoma; prognosis.
Copyright © 2022 Chen, Liu, Lu and Gu.
Conflict of interest statement
The authors declare that the research was conducted in the absence of any commercial or financial relationships that could be construed as a potential conflict of interest.
Figures
Similar articles
-
A novel basement membrane-related gene signature for prognosis of lung adenocarcinomas.Comput Biol Med. 2023 Mar;154:106597. doi: 10.1016/j.compbiomed.2023.106597. Epub 2023 Jan 24. Comput Biol Med. 2023. PMID: 36708655
-
LATPS, a novel prognostic signature based on tumor microenvironment of lung adenocarcinoma to better predict survival and immunotherapy response.Front Immunol. 2022 Nov 24;13:1064874. doi: 10.3389/fimmu.2022.1064874. eCollection 2022. Front Immunol. 2022. PMID: 36505456 Free PMC article.
-
Clinical Significance and Immunologic Landscape of a Five-IL(R)-Based Signature in Lung Adenocarcinoma.Front Immunol. 2021 Aug 23;12:693062. doi: 10.3389/fimmu.2021.693062. eCollection 2021. Front Immunol. 2021. PMID: 34497605 Free PMC article.
-
The integrated single-cell analysis developed an immunogenic cell death signature to predict lung adenocarcinoma prognosis and immunotherapy.Aging (Albany NY). 2023 Oct 4;15(19):10305-10329. doi: 10.18632/aging.205077. Epub 2023 Oct 4. Aging (Albany NY). 2023. PMID: 37796202 Free PMC article.
-
Tumor microenvironment in lung cancer-derived brain metastasis.Chin Med J (Engl). 2022 Aug 5;135(15):1781-1791. doi: 10.1097/CM9.0000000000002127. Chin Med J (Engl). 2022. PMID: 35838548 Free PMC article. Review.
Cited by
-
Identification of SUMOylation modifiers involved in lung adenocarcinoma progression and Osimertinib resistance by integrated bioinformatics analysis.Sci Rep. 2025 Aug 24;15(1):31130. doi: 10.1038/s41598-025-16615-z. Sci Rep. 2025. PMID: 40851084 Free PMC article.
-
Comprehensive analysis of the basement membrane in lung adenocarcinoma by bulk and single-cell sequencing analysis.J Cancer. 2023 Jun 4;14(9):1635-1647. doi: 10.7150/jca.83407. eCollection 2023. J Cancer. 2023. PMID: 37325048 Free PMC article.
-
Bioinformatics analysis of an immunotherapy responsiveness-related gene signature in predicting lung adenocarcinoma prognosis.Transl Lung Cancer Res. 2024 Jun 30;13(6):1277-1295. doi: 10.21037/tlcr-24-309. Epub 2024 Jun 7. Transl Lung Cancer Res. 2024. PMID: 38973963 Free PMC article.
-
Screening of hub inflammatory bowel disease biomarkers and identification of immune-related functions based on basement membrane genes.Eur J Med Res. 2023 Jul 22;28(1):247. doi: 10.1186/s40001-023-01193-5. Eur J Med Res. 2023. PMID: 37481583 Free PMC article.
-
Development and validation of a basement membrane-associated immune prognostic model for hepatocellular carcinoma.Transl Gastroenterol Hepatol. 2025 Feb 23;10:28. doi: 10.21037/tgh-24-89. eCollection 2025. Transl Gastroenterol Hepatol. 2025. PMID: 40337768 Free PMC article.
References
Publication types
MeSH terms
LinkOut - more resources
Full Text Sources
Medical