

Construction and validation of a robust prognostic model based on immune features in sepsis
- PMID: 36532037
- PMCID: PMC9756843
- DOI: 10.3389/fimmu.2022.994295
Construction and validation of a robust prognostic model based on immune features in sepsis
Erratum in
-
Corrigendum: Construction and validation of a robust prognostic model based on immune features in sepsis.Front Immunol. 2023 Mar 6;14:1146121. doi: 10.3389/fimmu.2023.1146121. eCollection 2023. Front Immunol. 2023. PMID: 36949955 Free PMC article.
Abstract
Purpose: Sepsis, with life-threatening organ failure, is caused by the uncontrolled host response to infection. Immune response plays an important role in the pathophysiology of sepsis. Immune-related genes (IRGs) are promising novel biomarkers that have been used to construct the diagnostic and prognostic model. However, an IRG prognostic model used to predict the 28-day mortality in sepsis was still limited. Therefore, the study aimed to develop a prognostic model based on IRGs to identify patients with high risk and predict the 28-day mortality in sepsis. Then, we further explore the circulating immune cell and immunosuppression state in sepsis.
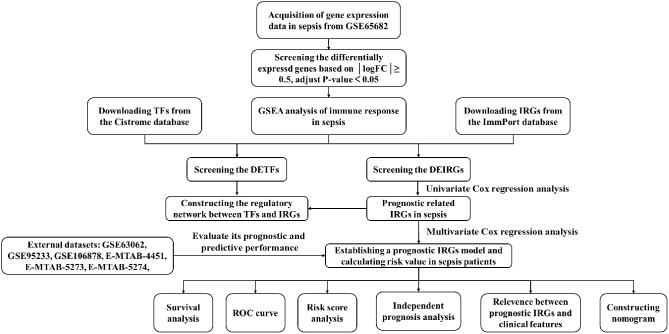
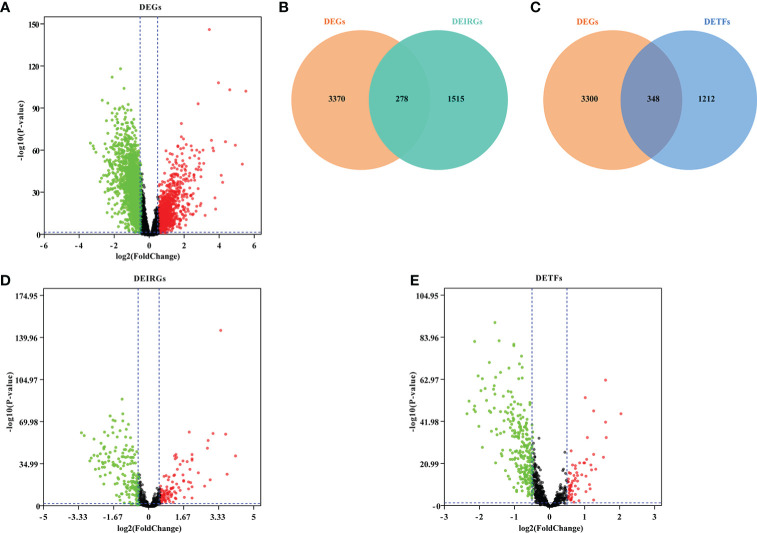
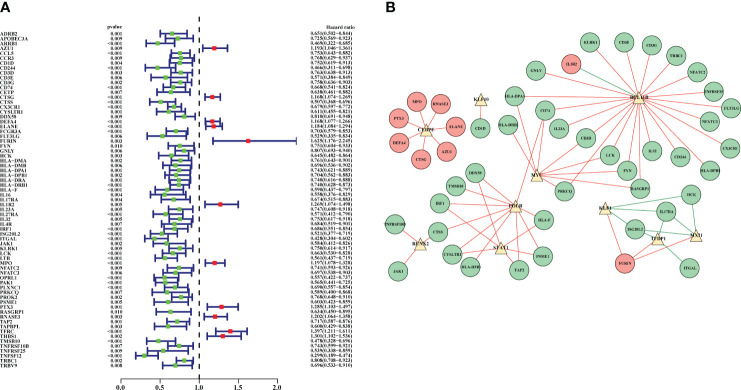
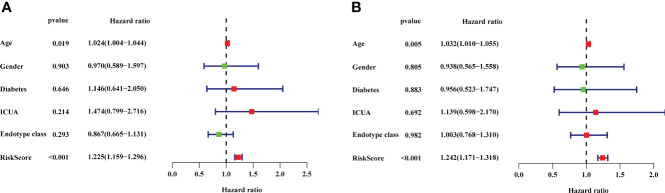
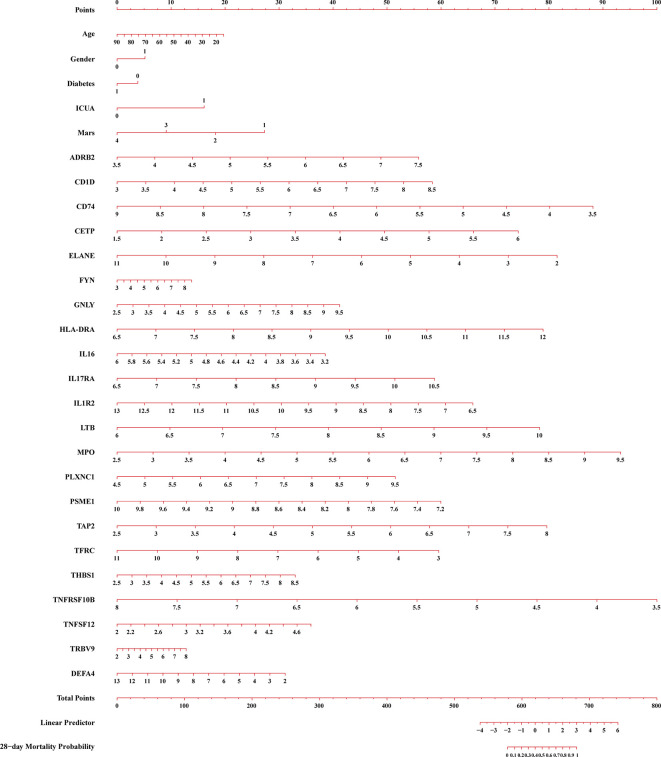
Materials and methods: The differentially expressed genes (DEGs), differentially expressed immune-related genes (DEIRGs), and differentially expressed transcription factors (DETFs) were obtained from the GEO, ImmPort, and Cistrome databases. Then, the TFs-DEIRGs regulatory network and prognostic prediction model were constructed by Cox regression analysis and Pearson correlation analysis. The external datasets also validated the reliability of the prognostic model. Based on the prognostic DEIRGs, we developed a nomogram and conducted an independent prognosis analysis to explore the relationship between DEIRGs in the prognostic model and clinical features in sepsis. Besides, we further evaluate the circulating immune cells state in sepsis.
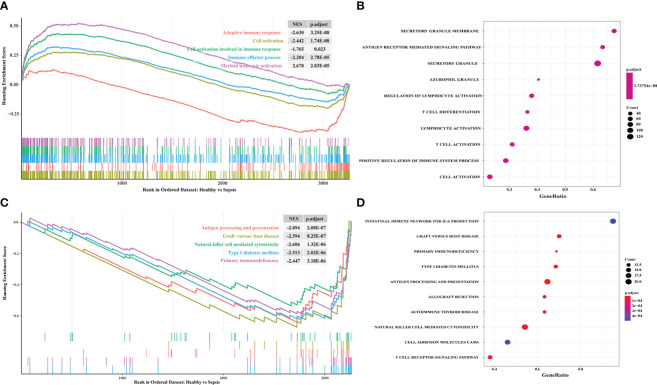
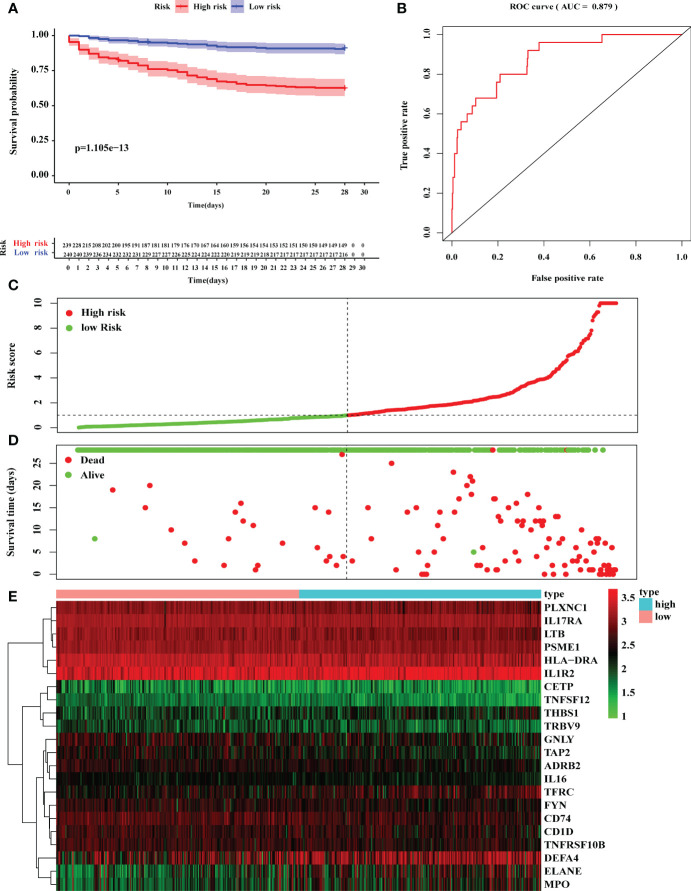
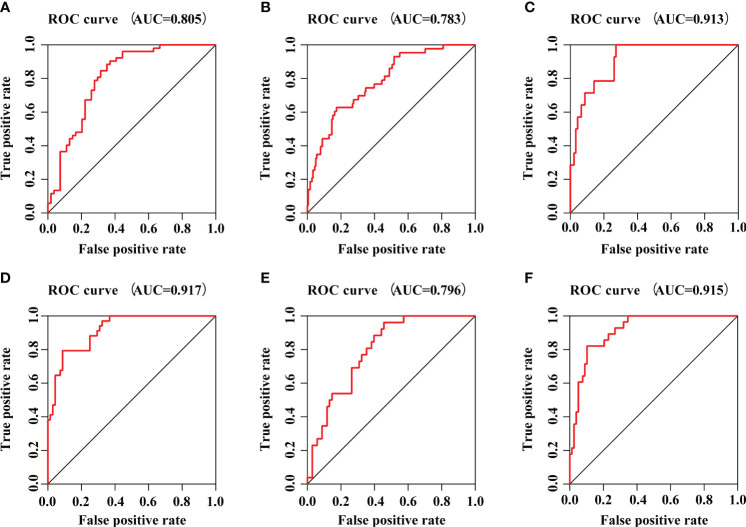
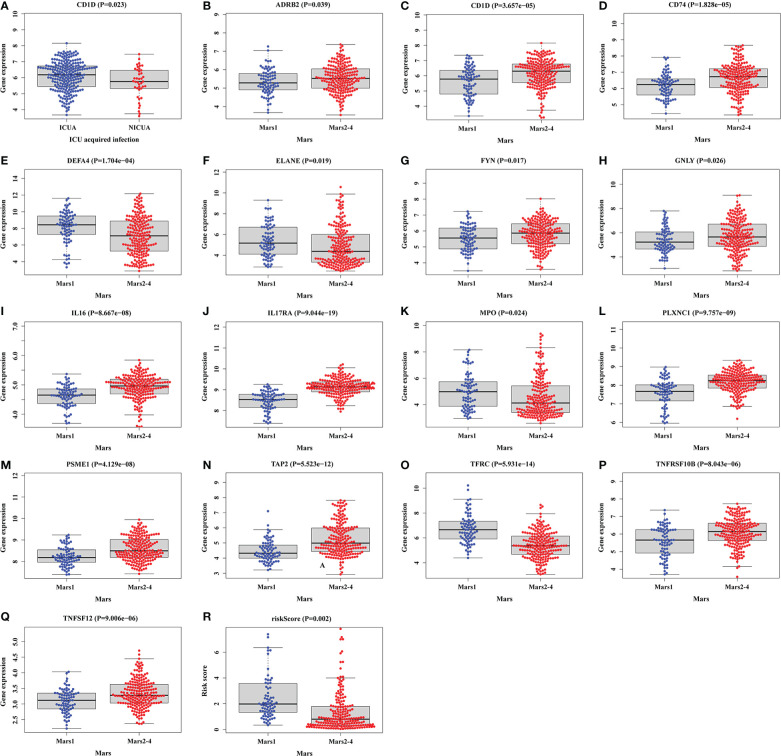
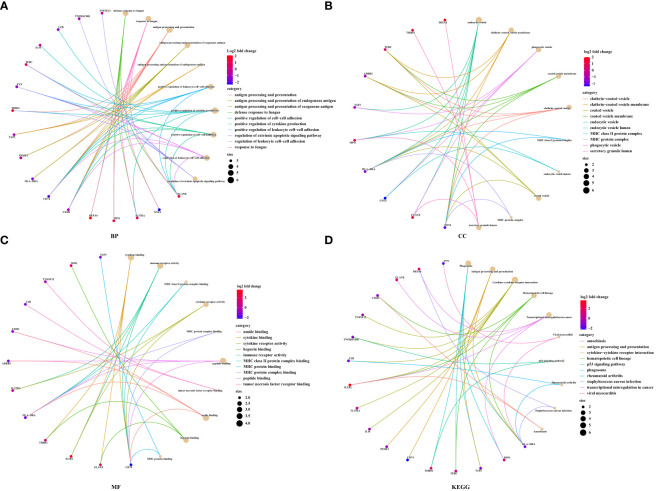
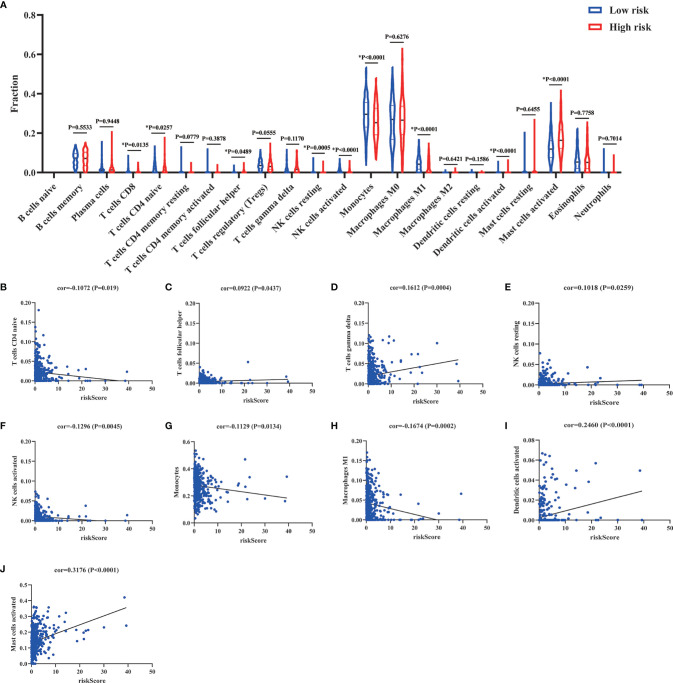
Results: A total of seven datasets were included in our study. Among them, GSE65682 was identified as a discovery cohort. The results of GSEA showed that there is a significant correlation between sepsis and immune response. Then, based on a P value <0.01, 69 prognostic DEIRGs were obtained and the potential molecular mechanisms of DEIRGs were also clarified. According to multivariate Cox regression analysis, 22 DEIRGs were further identified to construct the prognostic model and identify patients with high risk. The Kaplan-Meier survival analysis showed that high-risk groups have higher 28-day mortality than low-risk groups (P=1.105e-13). The AUC value was 0.879 which symbolized that the prognostic model had a better accuracy to predict the 28-day mortality. The external datasets also prove that the prognostic model had an excellent prediction value. Furthermore, the results of correlation analysis showed that patients with Mars1 might have higher risk scores than Mars2-4 (P=0.002). According to the previous study, Mars1 endotype was characterized by immunoparalysis. Thus, the sepsis patients in high-risk groups might exist the immunosuppression. Between the high-risk and low-risk groups, circulating immune cells types were significantly different, and risk score was significantly negatively correlated with naive CD4+ T cells (P=0.019), activated NK cells (P=0.0045), monocytes (P=0.0134), and M1 macrophages (P=0.0002).
Conclusions: Our study provides a robust prognostic model based on 22 DEIRGs which can predict 28-day mortality and immunosuppression status in sepsis. The higher risk score was positively associated with 28-day mortality and the development of immunosuppression. IRGs are a promising biomarker that might facilitate personalized treatments for sepsis.
Keywords: 28-day mortality; immune; immunosuppression; prognostic model; sepsis.
Copyright © 2022 Zheng, Liu, Deng, Chen, Huang, Zhang, Xu, Sang, Liu and Li.
Conflict of interest statement
The authors declare that the research was conducted in the absence of any commercial or financial relationships that could be construed as a potential conflict of interest.
Figures
References
-
- Ferrer R, Martin-Loeches I, Phillips G, Osborn TM, Townsend S, Dellinger RP, et al. Empiric antibiotic treatment reduces mortality in severe sepsis and septic shock from the first hour: results from a guideline-based performance improvement program. Crit Care Med (2014) 42(8):1749–55. doi: 10.1097/CCM.0000000000000330 - DOI - PubMed
-
- World Health Organization . World health assembly 70, resolution 70.7: improving the prevention, diagnosis and clinical management of sepsis (2017). Available at: http://apps.who.int/gb/ebwha/pdf_files/WHA70/A70_R7-en.pdf.
Publication types
MeSH terms
LinkOut - more resources
Full Text Sources
Medical
Research Materials