Single-cell multiomics revealed the dynamics of antigen presentation, immune response and T cell activation in the COVID-19 positive and recovered individuals
- PMID: 36532041
- PMCID: PMC9755500
- DOI: 10.3389/fimmu.2022.1034159
Single-cell multiomics revealed the dynamics of antigen presentation, immune response and T cell activation in the COVID-19 positive and recovered individuals
Abstract
Introduction: Despite numerous efforts to describe COVID-19's immunological landscape, there is still a gap in our understanding of the virus's infections after-effects, especially in the recovered patients. This would be important to understand as we now have huge number of global populations infected by the SARS-CoV-2 as well as variables inclusive of VOCs, reinfections, and vaccination breakthroughs. Furthermore, single-cell transcriptome alone is often insufficient to understand the complex human host immune landscape underlying differential disease severity and clinical outcome.
Methods: By combining single-cell multi-omics (Whole Transcriptome Analysis plus Antibody-seq) and machine learning-based analysis, we aim to better understand the functional aspects of cellular and immunological heterogeneity in the COVID-19 positive, recovered and the healthy individuals.
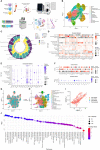
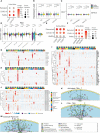
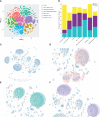
Results: Based on single-cell transcriptome and surface marker study of 163,197 cells (124,726 cells after data QC) from the 33 individuals (healthy=4, COVID-19 positive=16, and COVID-19 recovered=13), we observed a reduced MHC Class-I-mediated antigen presentation and dysregulated MHC Class-II-mediated antigen presentation in the COVID-19 patients, with restoration of the process in the recovered individuals. B-cell maturation process was also impaired in the positive and the recovered individuals. Importantly, we discovered that a subset of the naive T-cells from the healthy individuals were absent from the recovered individuals, suggesting a post-infection inflammatory stage. Both COVID-19 positive patients and the recovered individuals exhibited a CD40-CD40LG-mediated inflammatory response in the monocytes and T-cell subsets. T-cells, NK-cells, and monocyte-mediated elevation of immunological, stress and antiviral responses were also seen in the COVID-19 positive and the recovered individuals, along with an abnormal T-cell activation, inflammatory response, and faster cellular transition of T cell subtypes in the COVID-19 patients. Importantly, above immune findings were used for a Bayesian network model, which significantly revealed FOS, CXCL8, IL1β, CST3, PSAP, CD45 and CD74 as COVID-19 severity predictors.
Discussion: In conclusion, COVID-19 recovered individuals exhibited a hyper-activated inflammatory response with the loss of B cell maturation, suggesting an impeded post-infection stage, necessitating further research to delineate the dynamic immune response associated with the COVID-19. To our knowledge this is first multi-omic study trying to understand the differential and dynamic immune response underlying the sample subtypes.
Keywords: COVID-19; T-cell activation; bayesian network model; immune response; recovered COVID-19 individuals; single cell multi-omics.
Copyright © 2022 Chattopadhyay, Khare, Kumar, Mishra, Anand, Maurya, Gupta, Sahni, Gupta, Wadhwa, Yadav, Devi, Tardalkar, Joshi, Sethi and Pandey.
Conflict of interest statement
The authors declare that the research was conducted in the absence of any commercial or financial relationships that could be construed as a potential conflict of interest.
Figures


Similar articles
-
Innate immune response in COVID-19: single-cell multi-omics profile of NK lymphocytes in a clinical case series.Cell Commun Signal. 2024 Oct 15;22(1):496. doi: 10.1186/s12964-024-01867-5. Cell Commun Signal. 2024. PMID: 39407208 Free PMC article.
-
Flow cytometry profiling of cellular immune response in COVID-19 infected, recovered and vaccinated individuals.Immunobiology. 2023 May;228(3):152392. doi: 10.1016/j.imbio.2023.152392. Epub 2023 May 8. Immunobiology. 2023. PMID: 37182442 Free PMC article.
-
Single-Cell Analysis Reveals the Immune Characteristics of Myeloid Cells and Memory T Cells in Recovered COVID-19 Patients With Different Severities.Front Immunol. 2022 Jan 3;12:781432. doi: 10.3389/fimmu.2021.781432. eCollection 2021. Front Immunol. 2022. PMID: 35046942 Free PMC article.
-
Overview of Immune Response During SARS-CoV-2 Infection: Lessons From the Past.Front Immunol. 2020 Aug 7;11:1949. doi: 10.3389/fimmu.2020.01949. eCollection 2020. Front Immunol. 2020. PMID: 32849654 Free PMC article. Review.
-
Adaptive Immune Responses and Immunity to SARS-CoV-2.Front Immunol. 2022 May 4;13:848582. doi: 10.3389/fimmu.2022.848582. eCollection 2022. Front Immunol. 2022. PMID: 35603211 Free PMC article. Review.
Cited by
-
Harnessing cellular immunity for next-generation vaccines against respiratory viruses: mechanisms, platforms, and optimization strategies.Front Immunol. 2025 Aug 13;16:1618406. doi: 10.3389/fimmu.2025.1618406. eCollection 2025. Front Immunol. 2025. PMID: 40881694 Free PMC article. Review.
-
Single cell and TCR analysis of immune cells from AAV gene therapy-dosed Duchenne muscular dystrophy patients.Mol Ther Methods Clin Dev. 2024 Sep 30;32(4):101349. doi: 10.1016/j.omtm.2024.101349. eCollection 2024 Dec 12. Mol Ther Methods Clin Dev. 2024. PMID: 39524974 Free PMC article.
-
Network-based integrative multi-omics approach reveals biosignatures specific to COVID-19 disease phases.Front Mol Biosci. 2024 Jul 8;11:1393240. doi: 10.3389/fmolb.2024.1393240. eCollection 2024. Front Mol Biosci. 2024. PMID: 39040605 Free PMC article.
-
Dynamics of Whole Transcriptome Analysis (WTA) and Surface markers expression (AbSeq) in Immune Cells of COVID-19 Patients and Recovered captured through Single Cell Genomics.Front Med (Lausanne). 2024 Jan 31;11:1297001. doi: 10.3389/fmed.2024.1297001. eCollection 2024. Front Med (Lausanne). 2024. PMID: 38357647 Free PMC article.
-
Dysregulated metal ion homeostasis underscores non-canonical function of CD8+ T cell during COVID-19.Front Med (Lausanne). 2023 Oct 10;10:1282390. doi: 10.3389/fmed.2023.1282390. eCollection 2023. Front Med (Lausanne). 2023. PMID: 37886355 Free PMC article.
References
Publication types
MeSH terms
LinkOut - more resources
Full Text Sources
Medical
Molecular Biology Databases
Research Materials
Miscellaneous

