

Crosstalk of four kinds of cell deaths defines subtypes of cutaneous melanoma for precise immunotherapy and chemotherapy
- PMID: 36532053
- PMCID: PMC9747944
- DOI: 10.3389/fimmu.2022.998454
Crosstalk of four kinds of cell deaths defines subtypes of cutaneous melanoma for precise immunotherapy and chemotherapy
Abstract
Background: Cell death patterns can give therapeutic and biological clues that facilitate the development of individualized treatments for this lethal form of skin cancer.
Methods: We employed unsupervised clustering to establish robust classifications based on the four kinds of cell death-associated gene expression of 462 melanoma patients in the Cancer Genome Atlas (TCGA) and tested their reproducibility in two independent melanoma cohorts of 558 patients. We then used dimensionality reduction of graph learning to display the different characteristics of cell death patterns and immune microenvironments.
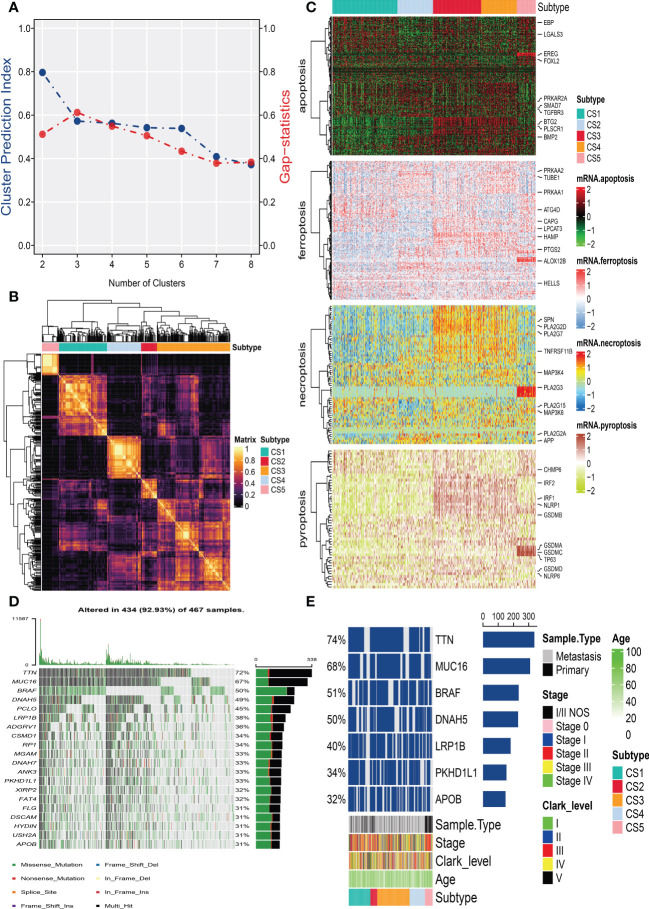
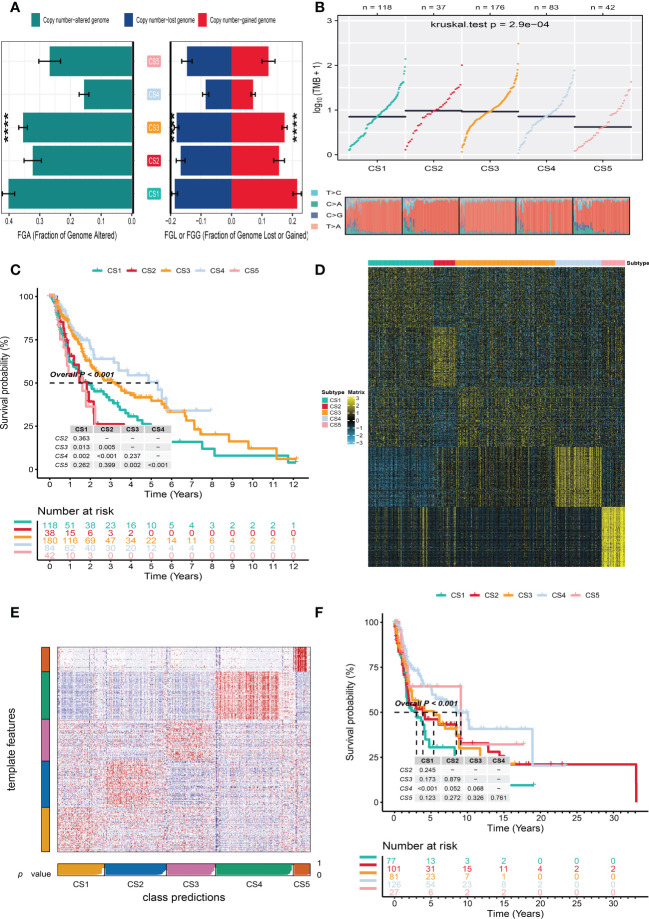
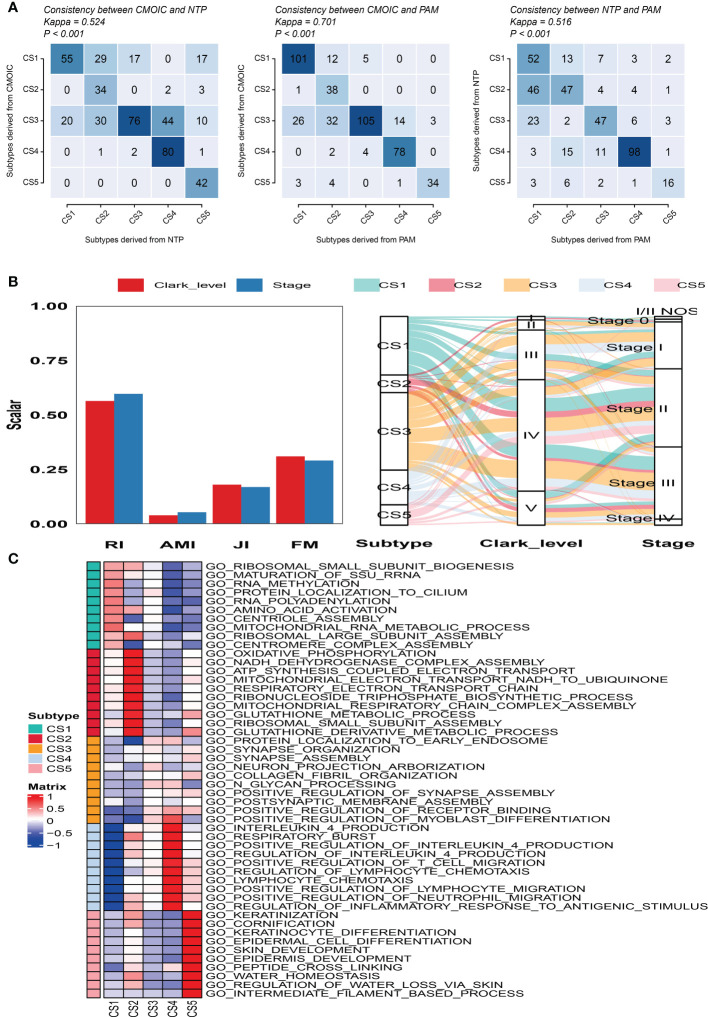
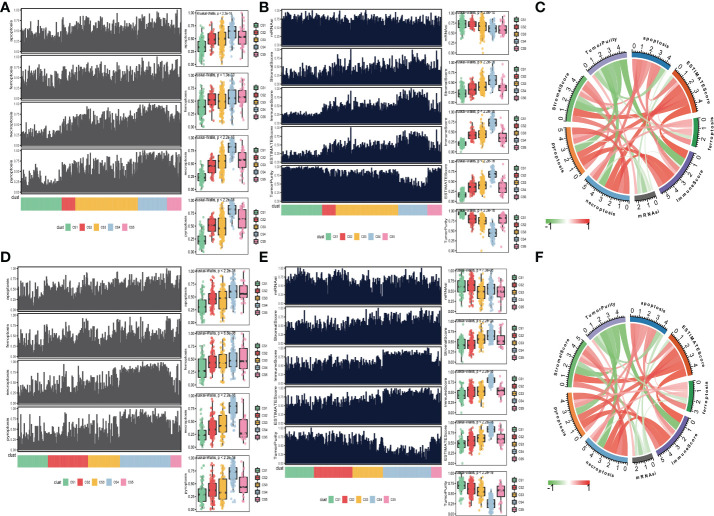
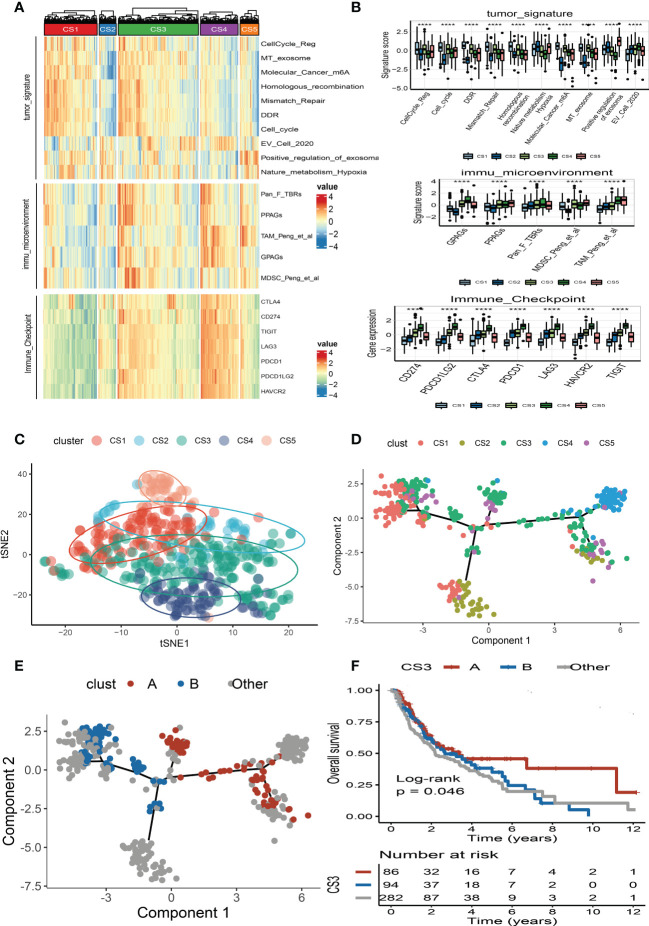
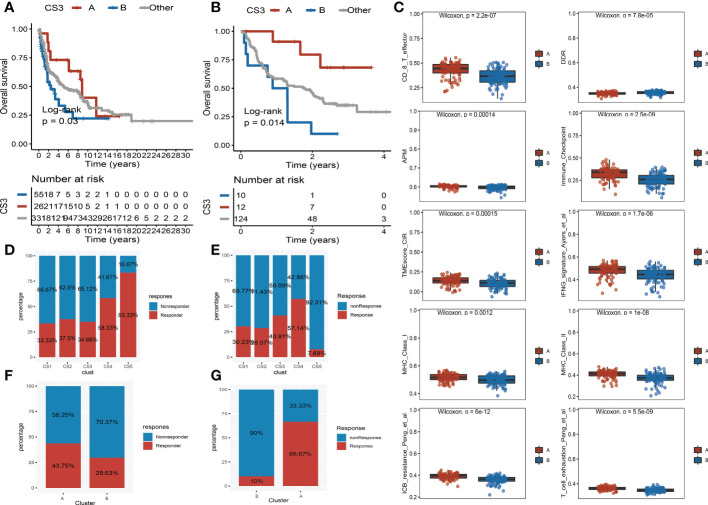
Results: We examined 570 cell death-associated gene expression data of melanoma patients for exploration, independent verification, and comprehensive classification of five reproducible melanoma subtypes (CS1 to CS5) with different genomic and clinical features. Patients in death-inactive subtypes (CS1, CS2, and CS5) had the least immune and stromal cell infiltration, and their prognosis was the poorest. A death-active subtype (CS4), on the other hand, had the highest infiltrated immune and stromal cells and elevated immune-checkpoints. As a result, these patients had the highest response to immunotherapy and the best prognosis. An additional subtype (CS3) had more diversified cell death and immune characteristics with moderate prognoses. Based on graph learning, we successfully divided the CS3 subtype into two subgroups (group A and group B) with distinct survival outcomes and immune features. Finally, we identified eight potential chemical drugs that were specifically targeted for the therapy of melanoma subtypes.
Conclusions: This research defines the intrinsic subtypes of melanoma based on the crosstalk of four kinds of cell deaths, which affords a blueprint for clinical strategies and guiding precise immunotherapy and chemotherapy for melanoma patients.
Keywords: cell deaths; chemotherapy; cutaneous melanoma; immunotherapy; subtype.
Copyright © 2022 Wan, Wei, Wei and Deng.
Conflict of interest statement
The authors declare that the research was conducted in the absence of any commercial or financial relationships that could be construed as a potential conflict of interest.
Figures
Similar articles
-
Identification and validation of immunotherapy for four novel clusters of colorectal cancer based on the tumor microenvironment.Front Immunol. 2022 Oct 28;13:984480. doi: 10.3389/fimmu.2022.984480. eCollection 2022. Front Immunol. 2022. PMID: 36389763 Free PMC article.
-
Identification of fatty acid metabolism-related molecular subtype biomarkers and their correlation with immune checkpoints in cutaneous melanoma.Front Immunol. 2022 Nov 18;13:967277. doi: 10.3389/fimmu.2022.967277. eCollection 2022. Front Immunol. 2022. PMID: 36466837 Free PMC article.
-
The Immune Subtypes and Landscape of Gastric Cancer and to Predict Based on the Whole-Slide Images Using Deep Learning.Front Immunol. 2021 Jun 28;12:685992. doi: 10.3389/fimmu.2021.685992. eCollection 2021. Front Immunol. 2021. PMID: 34262565 Free PMC article.
-
OMIC signatures to understand cancer immunosurveillance and immunoediting: Melanoma and immune cells interplay in immunotherapy.J Leukoc Biol. 2019 May;105(5):915-933. doi: 10.1002/JLB.MR0618-241RR. Epub 2019 Jan 30. J Leukoc Biol. 2019. PMID: 30698862 Review.
-
Evolving Treatment Approaches to Mucosal Melanoma.Curr Oncol Rep. 2022 Oct;24(10):1261-1271. doi: 10.1007/s11912-022-01225-z. Epub 2022 May 5. Curr Oncol Rep. 2022. PMID: 35511393 Review.
Cited by
-
A deep learning approach based on multi-omics data integration to construct a risk stratification prediction model for skin cutaneous melanoma.J Cancer Res Clin Oncol. 2023 Nov;149(17):15923-15938. doi: 10.1007/s00432-023-05358-x. Epub 2023 Sep 7. J Cancer Res Clin Oncol. 2023. PMID: 37673824 Free PMC article.
-
The multifaceted roles of mucins family in lung cancer: from prognostic biomarkers to promising targets.Front Immunol. 2025 Jun 27;16:1608140. doi: 10.3389/fimmu.2025.1608140. eCollection 2025. Front Immunol. 2025. PMID: 40655139 Free PMC article. Review.
-
Malignant Melanoma: An Overview, New Perspectives, and Vitamin D Signaling.Cancers (Basel). 2024 Jun 18;16(12):2262. doi: 10.3390/cancers16122262. Cancers (Basel). 2024. PMID: 38927967 Free PMC article. Review.
-
Single-cell transcriptomics reveals the multidimensional dynamic heterogeneity from primary to metastatic gastric cancer.iScience. 2025 Jan 20;28(2):111843. doi: 10.1016/j.isci.2025.111843. eCollection 2025 Feb 21. iScience. 2025. PMID: 39967875 Free PMC article.
-
Cutaneous Toxicities of Advanced Treatment for Cutaneous Melanoma: A Prospective Study from a Single-Center Institution.Cancers (Basel). 2024 Oct 30;16(21):3679. doi: 10.3390/cancers16213679. Cancers (Basel). 2024. PMID: 39518117 Free PMC article.
References
-
- Schachter J, Ribas A, Long GV, Arance A, Grob JJ, Mortier L, et al. . Pembrolizumab versus ipilimumab for advanced melanoma: final overall survival results of a multicentre, randomised, open-label phase 3 study (KEYNOTE-006). Lancet (2017) 390(10105):1853–62. doi: 10.1016/S0140-6736(17)31601-X - DOI - PubMed
MeSH terms
LinkOut - more resources
Full Text Sources
Medical
Research Materials
Miscellaneous