

m5C regulator-mediated modification patterns and tumor microenvironment infiltration characterization in colorectal cancer: One step closer to precision medicine
- PMID: 36532062
- PMCID: PMC9751490
- DOI: 10.3389/fimmu.2022.1049435
m5C regulator-mediated modification patterns and tumor microenvironment infiltration characterization in colorectal cancer: One step closer to precision medicine
Abstract
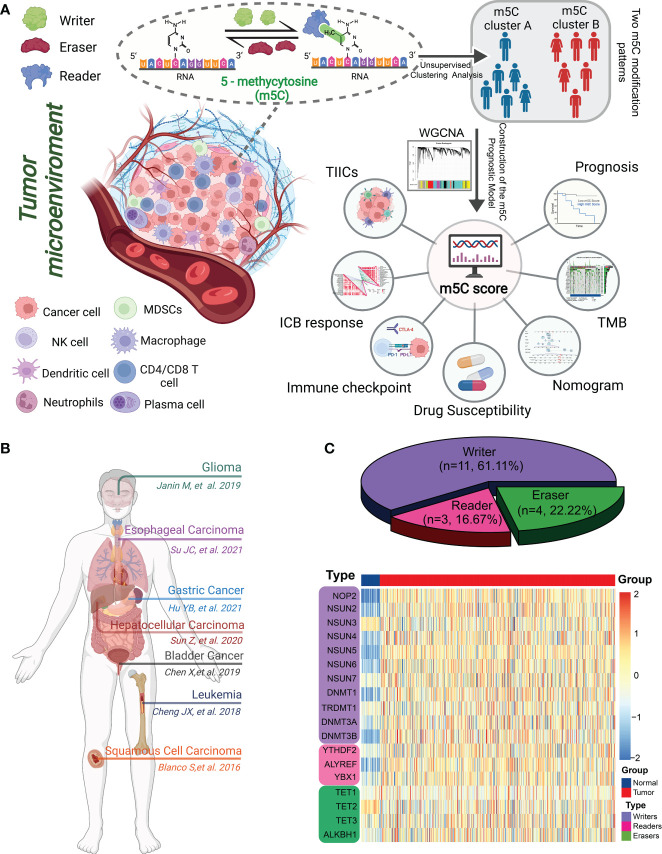
Background: The RNA modification 5-methylcytosine (m5C) is one of the most prevalent post-transcriptional modifications, with increasing evidence demonstrating its extensive involvement in the tumorigenesis and progression of various cancers. Colorectal cancer (CRC) is the third most common cancer and second leading cause of cancer-related deaths worldwide. However, the role of m5C modulators in shaping tumor microenvironment (TME) heterogeneity and regulating immune cell infiltration in CRC requires further clarification.
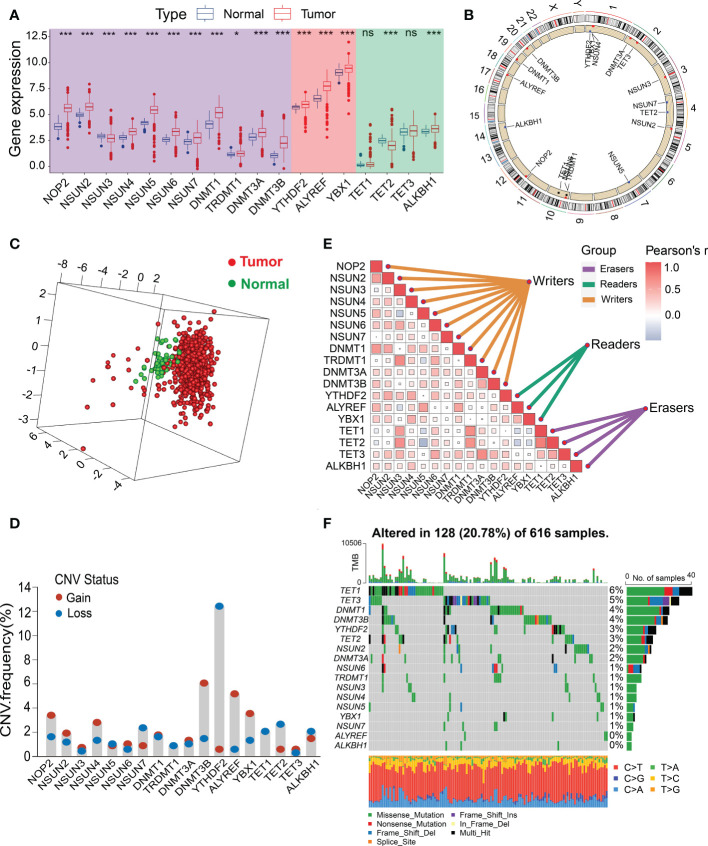
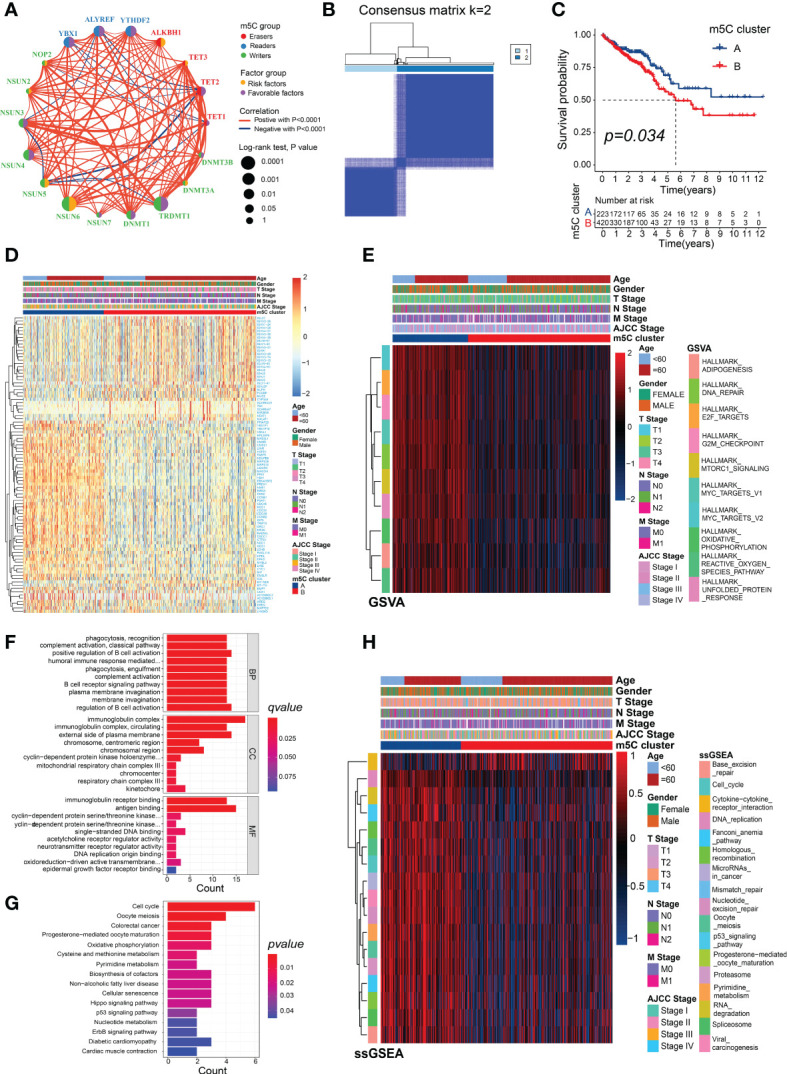
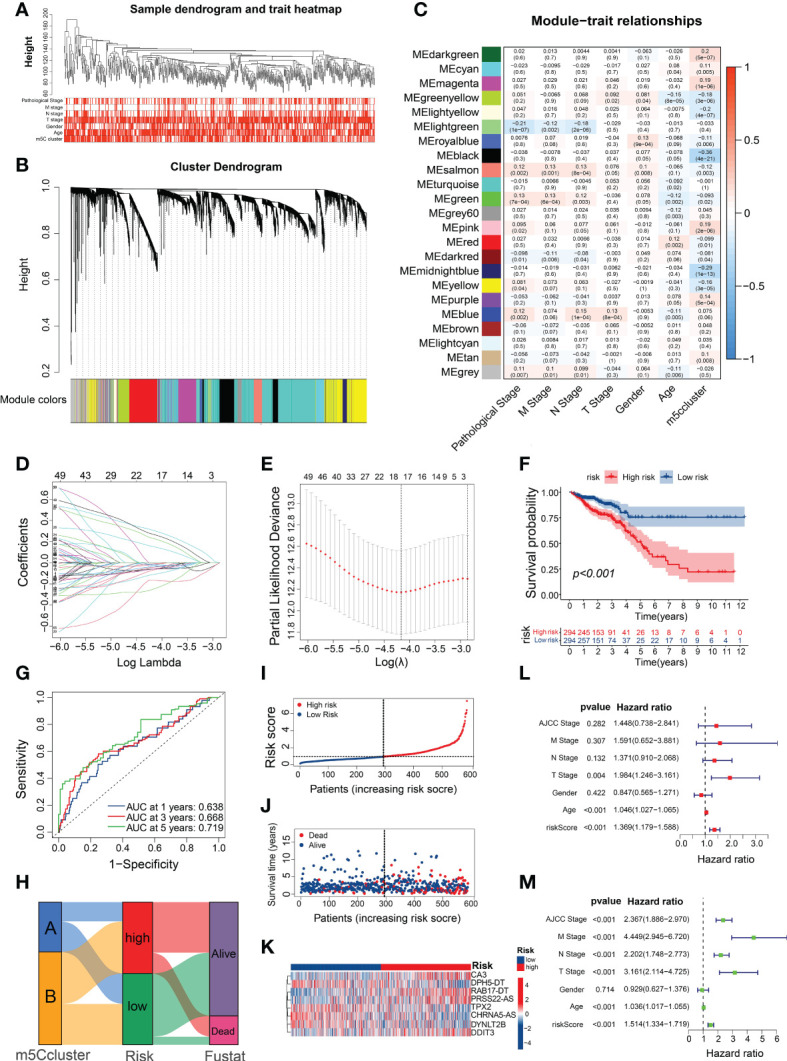
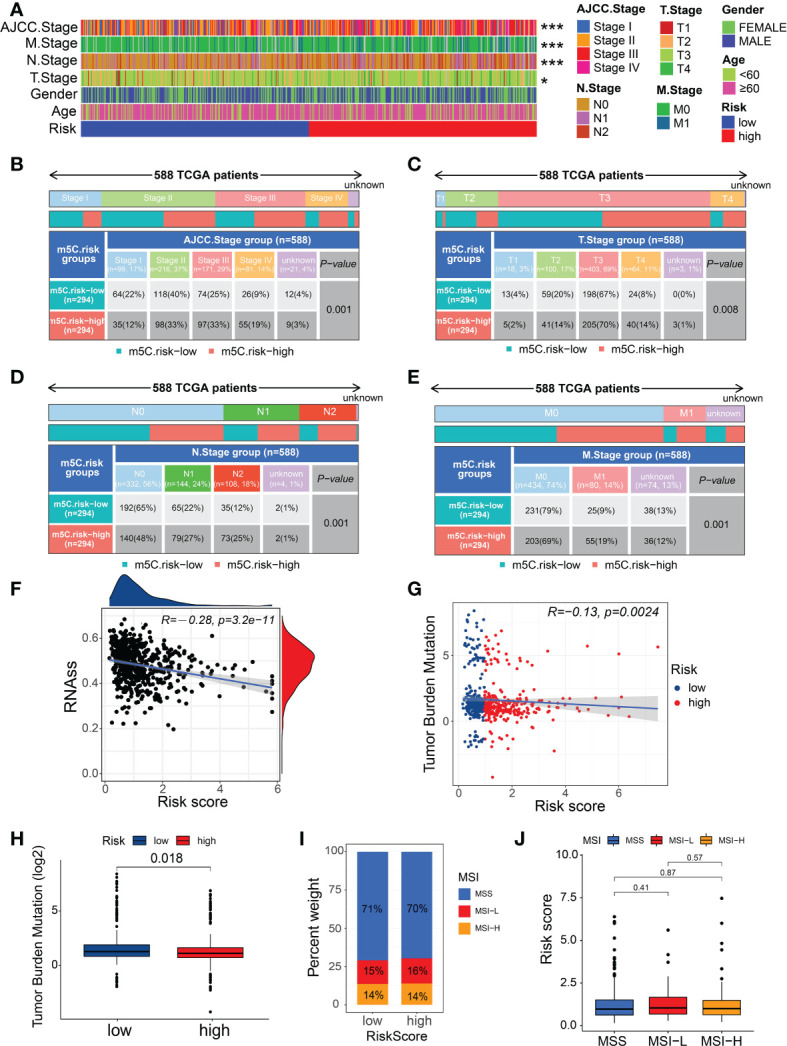
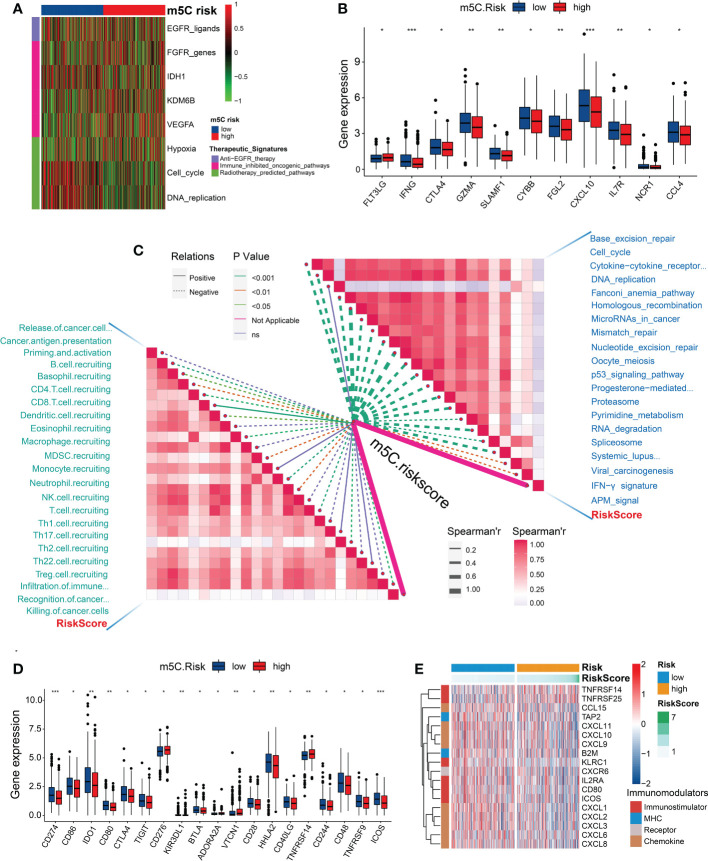
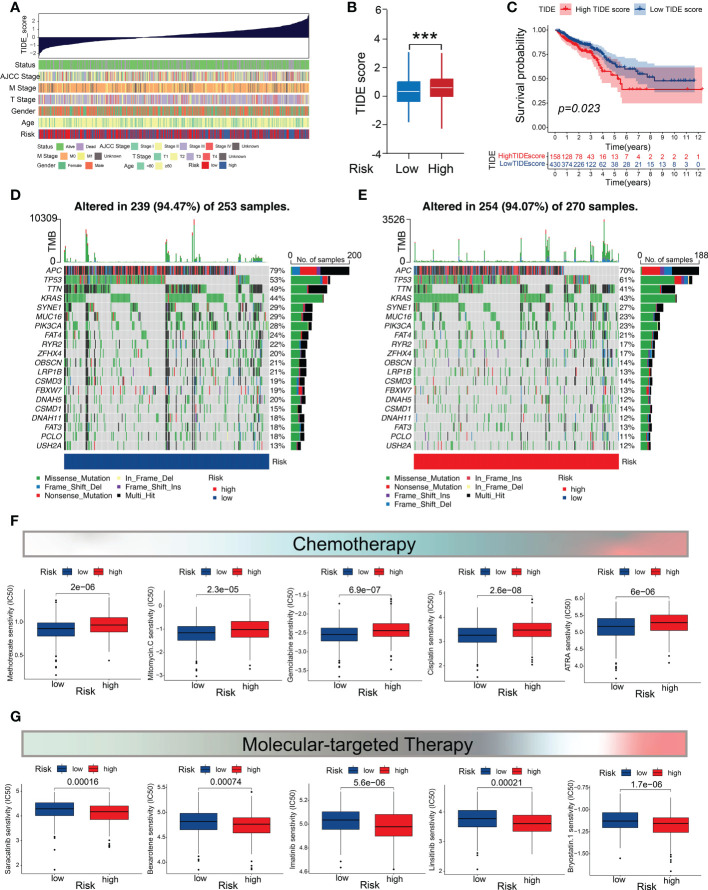
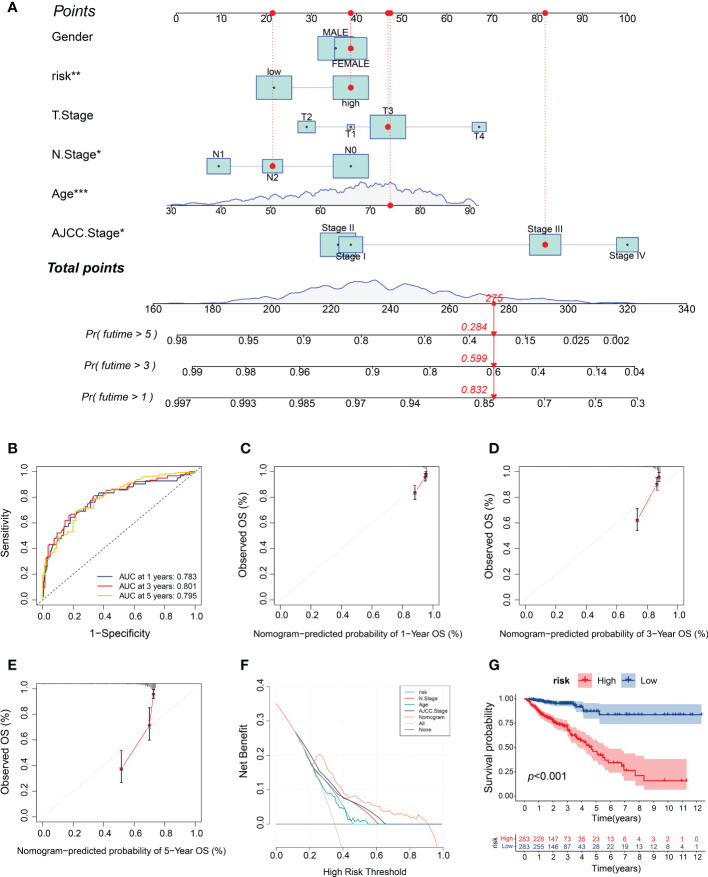
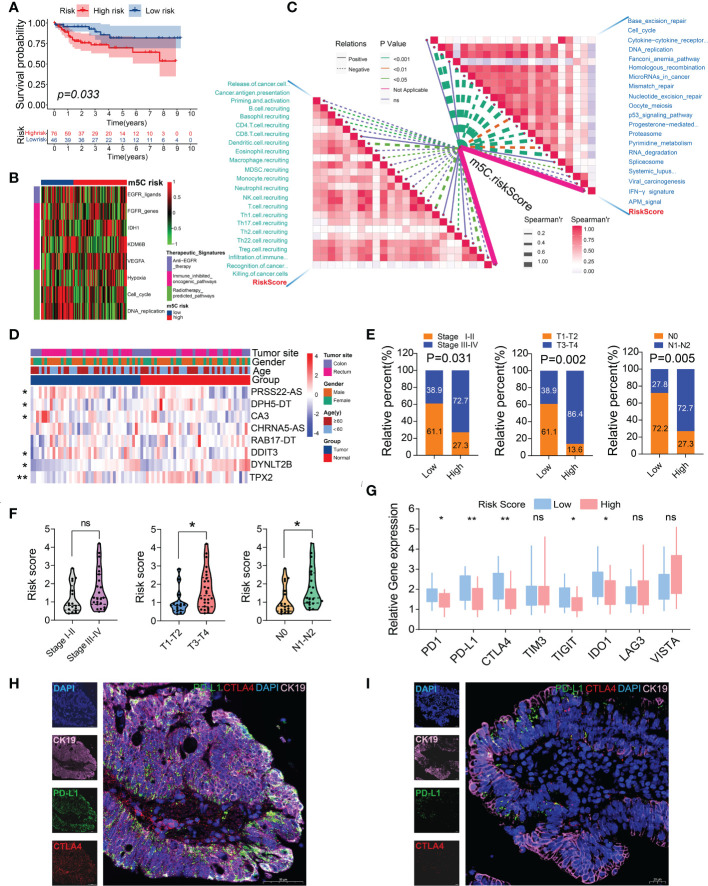
Results: The transcriptomic sequencing data of 18 m5C regulators and clinical data of patients with CRC were obtained from The Cancer Genome Atlas (TCGA) and systematically evaluated. We found that 16 m5C regulators were differentially expressed between CRC and normal tissues. Unsupervised cluster analysis was then performed and revealed two distinct m5C modification patterns that yielded different clinical prognoses and biological functions in CRC. We demonstrated that the m5C score constructed from eight m5C-related genes showed excellent prognostic performance, with a subsequent independent analysis confirming its predictive ability in the CRC cohort. Then we developed a nomogram containing five clinical risk factors and the m5C risk score and found that the m5C score exhibited high prognostic prediction accuracy and favorable clinical applicability. Moreover, the CRC patients with low m5C score were characterized by "hot" TME exhibiting increased immune cell infiltration and higher immune checkpoint expression. These characteristics were highlighted as potential identifiers of suitable candidates for anticancer immunotherapy. Although the high m5C score represented the non-inflammatory phenotype, the CRC patients in this group exhibited high level of sensitivity to molecular-targeted therapy.
Conclusion: Our comprehensive analysis indicated that the novel m5C clusters and scoring system accurately reflected the distinct prognostic signature, clinicopathological characteristics, immunological phenotypes, and stratifying therapeutic opportunities of CRC. Our findings, therefore, offer valuable insights into factors that may be targeted in the development of precision medicine-based therapeutic strategies for CRC.
Keywords: 5-methylcytosine; RNA methylation; colorectal cancer; immune infiltrates; precision medicine; tumor microenvironment.
Copyright © 2022 Chen, Xi, Zhao, Hong, Tian, Zhai, Chen, Ren, Fan, Xie and Jiang.
Conflict of interest statement
The authors declare that the research was conducted in the absence of any commercial or financial relationships that could be construed as a potential conflict of interest.
Figures
Similar articles
-
m5C methylation modification may be an accomplice in colorectal cancer escaping from anti-tumor effects of innate immunity-type I/III interferon.Front Immunol. 2025 Jan 10;15:1512353. doi: 10.3389/fimmu.2024.1512353. eCollection 2024. Front Immunol. 2025. PMID: 39867908 Free PMC article. Review.
-
m5C regulator-mediated methylation modification phenotypes characterized by distinct tumor microenvironment immune heterogenicity in colorectal cancer.Sci Rep. 2023 Jul 24;13(1):11950. doi: 10.1038/s41598-023-37300-z. Sci Rep. 2023. PMID: 37488178 Free PMC article.
-
Roles of m5C RNA Modification Patterns in Biochemical Recurrence and Tumor Microenvironment Characterization of Prostate Adenocarcinoma.Front Immunol. 2022 May 4;13:869759. doi: 10.3389/fimmu.2022.869759. eCollection 2022. Front Immunol. 2022. PMID: 35603206 Free PMC article.
-
Comprehensive Analysis of m5C Methylation Regulatory Genes and Tumor Microenvironment in Prostate Cancer.Front Immunol. 2022 Jun 10;13:914577. doi: 10.3389/fimmu.2022.914577. eCollection 2022. Front Immunol. 2022. PMID: 35757739 Free PMC article.
-
Targeting the "tumor microenvironment": RNA-binding proteins in the spotlight in colorectal cancer therapy.Int Immunopharmacol. 2024 Apr 20;131:111876. doi: 10.1016/j.intimp.2024.111876. Epub 2024 Mar 16. Int Immunopharmacol. 2024. PMID: 38493688 Review.
Cited by
-
Deciphering the vital roles and mechanism of m5C modification on RNA in cancers.Am J Cancer Res. 2023 Dec 15;13(12):6125-6146. eCollection 2023. Am J Cancer Res. 2023. PMID: 38187052 Free PMC article. Review.
-
NSUN2 promotes colorectal cancer progression by stabilizing PHGDH mRNA to promote serine metabolism reprogramming.Cancer Metab. 2025 Aug 14;13(1):37. doi: 10.1186/s40170-025-00406-1. Cancer Metab. 2025. PMID: 40814066 Free PMC article.
-
NSUN6 Regulates NM23-H1 Expression in an m5C Manner to Affect Epithelial-Mesenchymal Transition in Lung Cancer.Med Princ Pract. 2024;33(1):56-65. doi: 10.1159/000535479. Epub 2023 Nov 29. Med Princ Pract. 2024. PMID: 38029727 Free PMC article.
-
m5C methylation modification may be an accomplice in colorectal cancer escaping from anti-tumor effects of innate immunity-type I/III interferon.Front Immunol. 2025 Jan 10;15:1512353. doi: 10.3389/fimmu.2024.1512353. eCollection 2024. Front Immunol. 2025. PMID: 39867908 Free PMC article. Review.
-
Molecular subtyping and the construction of a predictive model of colorectal cancer based on ion channel genes.Eur J Med Res. 2024 Apr 4;29(1):219. doi: 10.1186/s40001-024-01819-2. Eur J Med Res. 2024. PMID: 38576045 Free PMC article.
References
Publication types
MeSH terms
LinkOut - more resources
Full Text Sources
Medical