. 2022 Dec 1:16:997656.
doi: 10.3389/fnins.2022.997656. eCollection 2022.

Responses to dichotic tone-in-noise stimuli in the inferior colliculus

Affiliations

Responses to dichotic tone-in-noise stimuli in the inferior colliculus

Langchen Fan et al. Front Neurosci. .

Abstract

Human listeners are more sensitive to tones embedded in diotic noise when the tones are out-of-phase at the two ears (N0Sπ) than when they are in-phase (N0S0). The difference between the tone-detection thresholds for these two conditions is referred to as the binaural masking level difference (BMLD) and reflects a benefit of binaural processing. Detection in the N0Sπ condition has been explained in modeling studies by changes in interaural correlation (IAC), but this model has only been directly tested physiologically for low frequencies. Here, the IAC-based hypothesis for binaural detection was examined across a wide range of frequencies and masker levels using recordings in the awake rabbit inferior colliculus (IC). IAC-based cues were strongly correlated with neural responses to N0Sπ stimuli. Additionally, average rate-based thresholds were calculated for both N0S0 and N0Sπ conditions. The rate-based neural BMLD at 500 Hz matched rabbit behavioral data, but the trend of neural BMLDs across frequency differed from that of humans.

Keywords: binaural cues; binaural detection; binaural masking level difference; interaural correlation; midbrain.


Conflict of interest statement

The authors declare that the research was conducted in the absence of any commercial or financial relationships that could be construed as a potential conflict of interest.

Figures

FIGURE 1
FIGURE 1
Example neural ITD responses (black solid curve) and fitted Gabor function (blue dashed curve) for peak-like (left) and trough-like (right) NDFs. Vertical dotted line indicates the best ITD. The neuron’s CF, Best or Worst ITD (dBITD), and for cyclic ITD curves, the ITD tuning frequency (fITD) are described in the text.
FIGURE 2
FIGURE 2
Distribution of MTFs across CF (in one-octave bins) for the units presented in this study. Gray shades from light to dark indicate units with band-enhanced (BE), band-suppressed (BS), hybrid and all-pass (AP) MTF shapes. Two neurons with CF of 12.1k were included in the last bin for simplicity. Most MTF types were represented across the range of CFs, although hybrid MTFs were not observed at the lower CFs.
FIGURE 3
FIGURE 3
Responses of two example neurons (top and bottom row respectively). (A,E) MTF, response rates to amplitude-modulated noise; stars indicate modulation frequencies that had rates significantly different from the unmodulated condition. (B,F) ITD sensitivity, response rates vs. time delay in contralateral side (negative indicates ipsilateral side has delay). (C,D,G,H) responses to N0S0 and N0Sπ stimuli at different noise levels (different symbols) vs. SNR (from left to right); filled symbols indicate supra-thresholds. Errorbars indicate standard deviation. MTF shape and tone frequency for TIN stimuli (close to CF) are shown on the left. The example BE neuron had decreasing rate upon addition of a tone for both N0S0 and N0Sπ, while the example BS neuron had increasing rate for both conditions.
FIGURE 4
FIGURE 4
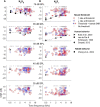
Responses of six example neurons (A–F). The left two columns show the neuron’s MTF and ITD sensitivity, respectively. The right three columns show the neuron’s response to N0S0 (blue circles) and N0Sπ (red squares) TIN stimuli at noise levels of 35, 55, and 75 dB SPL, respectively; filled symbols indicate supra-threshold responses. MTF shape and tone frequency of TIN stimuli (close to CF) are shown on the left.
FIGURE 5
FIGURE 5
Correlation between dynamic ranges of responses to N0Sπ and ITD (A), N0Sπ and ILD (B), and ILD and ITD (C) at 65 dB SPL (as indicated in titles). Correlation coefficients and p-values are shown at the top right of each panel; a star indicates that the correlation coefficient was significant after Bonferroni correction (p < 0.017). Neurons with CF below 1.5 kHz (low–CF) are shown with filled triangles, whereas neurons with CF above 1.5 kHz (high–CF) are shown with open circles. Solid gray lines indicate linear regressions.
FIGURE 6
FIGURE 6
Correlation between the rate difference elicited by addition of a dichotic tone (N0Sπ) at 0 dB SNR and the rate difference between responses to N0 and Nu conditions. Correlation coefficients and p-values are shown; a star indicates that the correlation coefficient was significant after Bonferroni correction (p < 0.0014). Neurons with CF below 1.5 kHz (low–CF) are shown in filled triangles, whereas neurons with CF above 1.5 kHz (high–CF) are shown in open circles. Solid lines show linear regressions.
FIGURE 7
FIGURE 7
Rate-based threshold for N0S0 (A) and N0Sπ (B) conditions. Thresholds of most sensitive neurons across frequencies matched human behavioral data for the N0S0 condition, but had a trend different from human for the N0Sπ condition. Neural thresholds at 500 Hz matched rabbit behavioral data for both conditions.
FIGURE 8
FIGURE 8
Binaural masking level differences (BMLDs) calculated based on single-neuron thresholds for both N0S0 and N0Sπ conditions. Open triangles indicate that the direction of change in rate vs. SNR at threshold for the N0Sπ condition was the same as for the N0S0 condition, whereas filled triangles indicate opposite direction of change in rate at threshold for the N0S0 and N0Sπ conditions. Only neurons that had measurable thresholds in both N0S0 and N0Sπ conditions are shown here.
FIGURE 9
FIGURE 9
N0S0 (solid blue line) and N0Sπ thresholds (dashed red line) of the neural population across frequency. Individual neural thresholds at 79.1% correct for N0S0 (blue square) and N0Sπ (red diamond) conditions, for noise levels of 55–75 dB SPL are shown for all neurons with measurable thresholds above the lowest SNR tested. Symbols with a black star indicate that the threshold was lower than the lowest measured SNR. Human detection thresholds are from van de Par and Kohlrausch (1999) and shifted up by 4 dB for comparison with neural thresholds, which were computed using a higher criterion. Neural binaural masking level differences (BMLDs) had a different trend across frequency compare to human BMLDs.

References

    1. Asadollahi A., Endler F., Nelken I., Wagner H. (2010). Neural correlates of binaural masking level difference in the inferior colliculus of the barn owl (Tyto alba). Eur. J. Neurosci. 32 606–618. 10.1111/j.1460-9568.2010.07313.x - DOI - PubMed
    1. Barlow H. B., Levick W. R., Yoon M. (1971). Responses to single quanta of light in retinal ganglion cells of the cat. Vision Res. 11 87–101. 10.1016/0042-6989(71)90033-2 - DOI - PubMed
    1. Bernstein L. R., Trahiotis C. (1996). On the use of the normalized correlation as an index of interaural envelope correlation. J. Acoust. Soc. Am. 100 1754–1763. 10.1121/1.416072 - DOI - PubMed
    1. Bernstein L. R., Trahiotis C. (1997). The effects of randomizing values of interaural disparities on binaural detection and on discrimination of interaural correlation. J. Acoust. Soc. Am. 102 1113–1120. 10.1121/1.419863 - DOI - PubMed
    1. Bernstein L. R., Trahiotis C. (2017). An interaural-correlation-based approach that accounts for a wide variety of binaural detection data. J. Acoust. Soc. Am. 141 1150–1160. 10.1121/1.4976098 - DOI - PubMed