. 2022 Nov 30:13:1045490.
doi: 10.3389/fmicb.2022.1045490. eCollection 2022.

A metabotropic glutamate receptor affects the growth and development of Schistosoma japonicum

Affiliations

A metabotropic glutamate receptor affects the growth and development of Schistosoma japonicum

Xiaoling Wang et al. Front Microbiol. .

Abstract

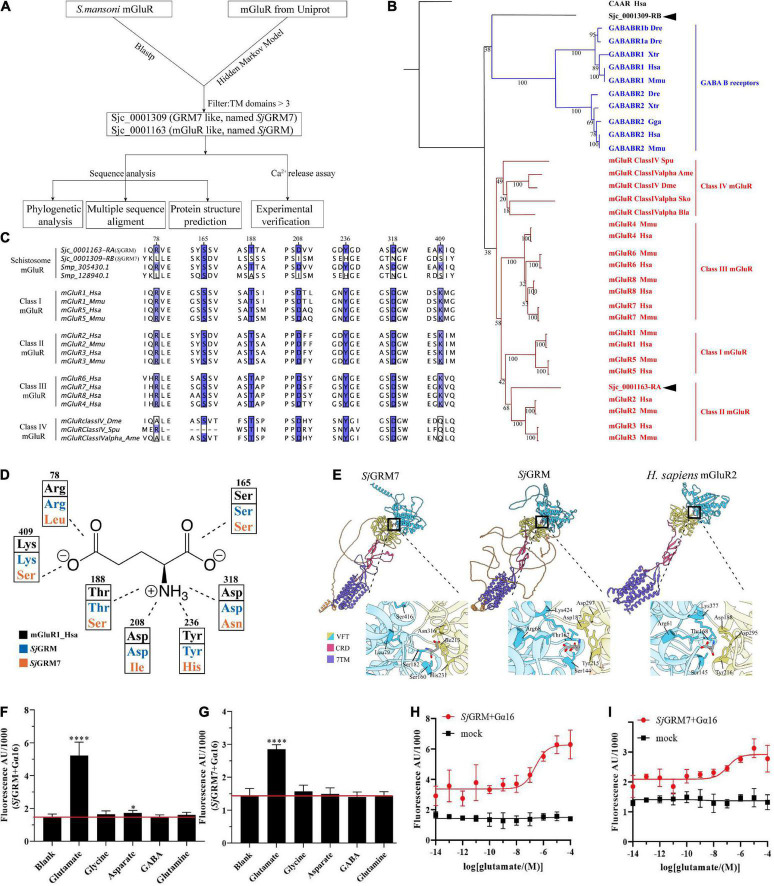
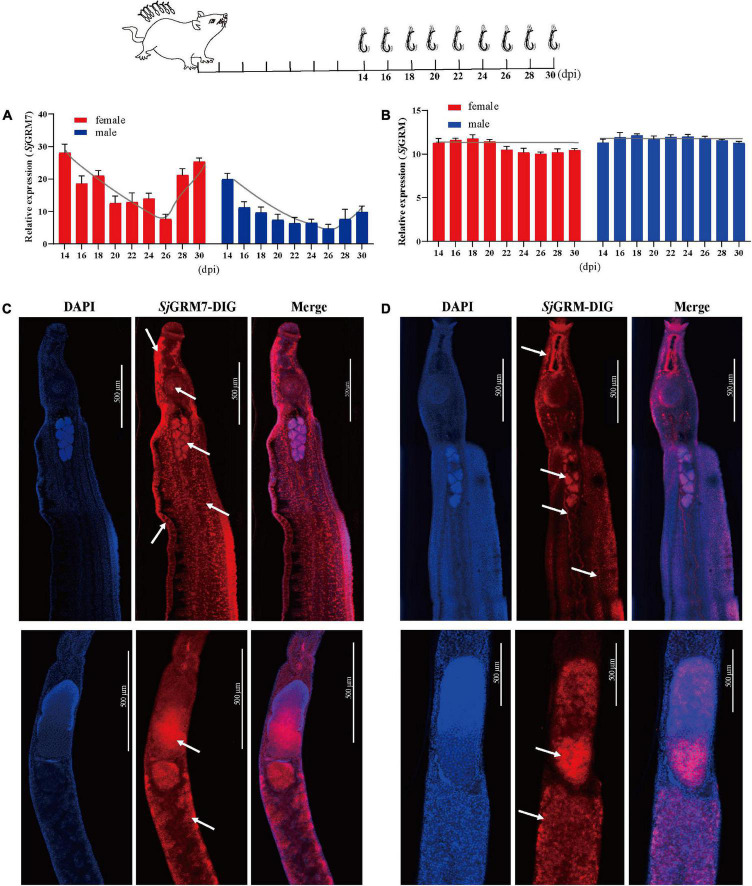
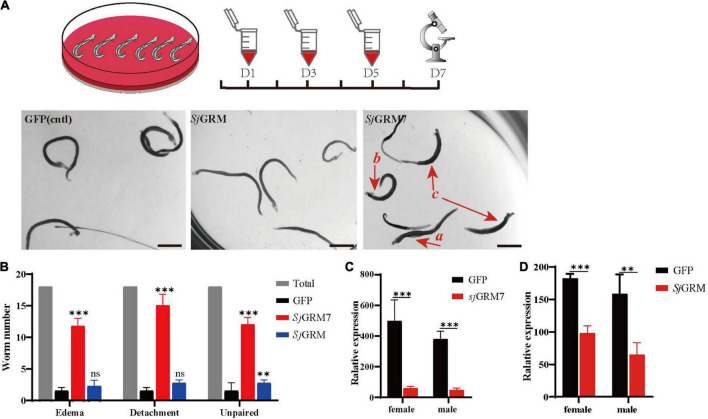
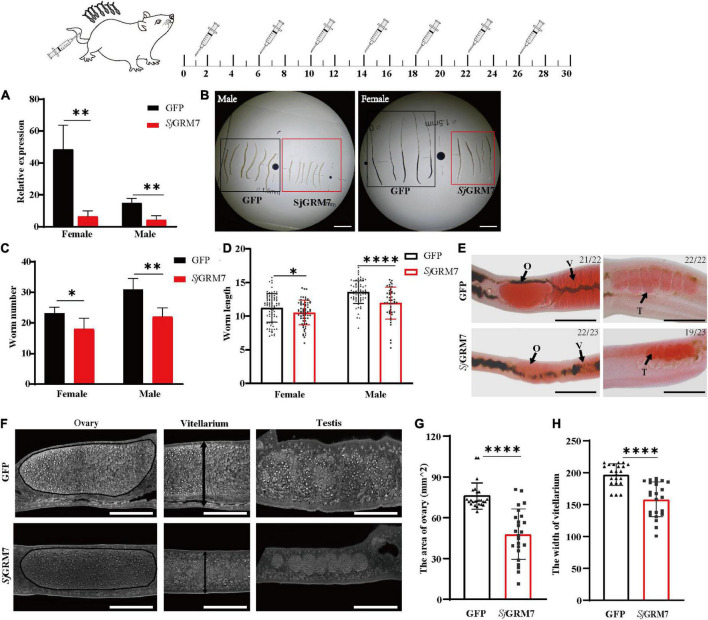
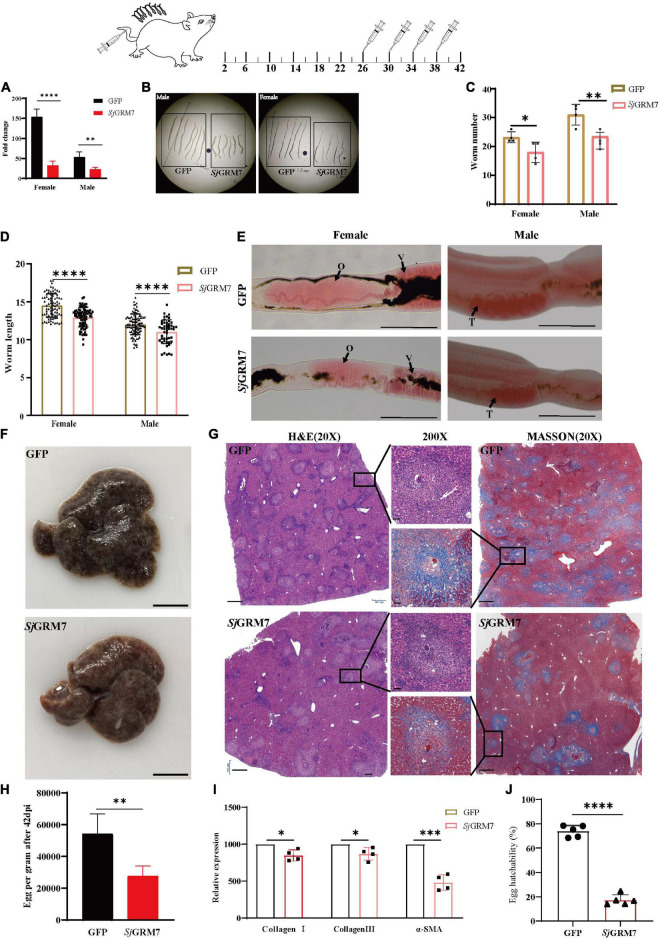
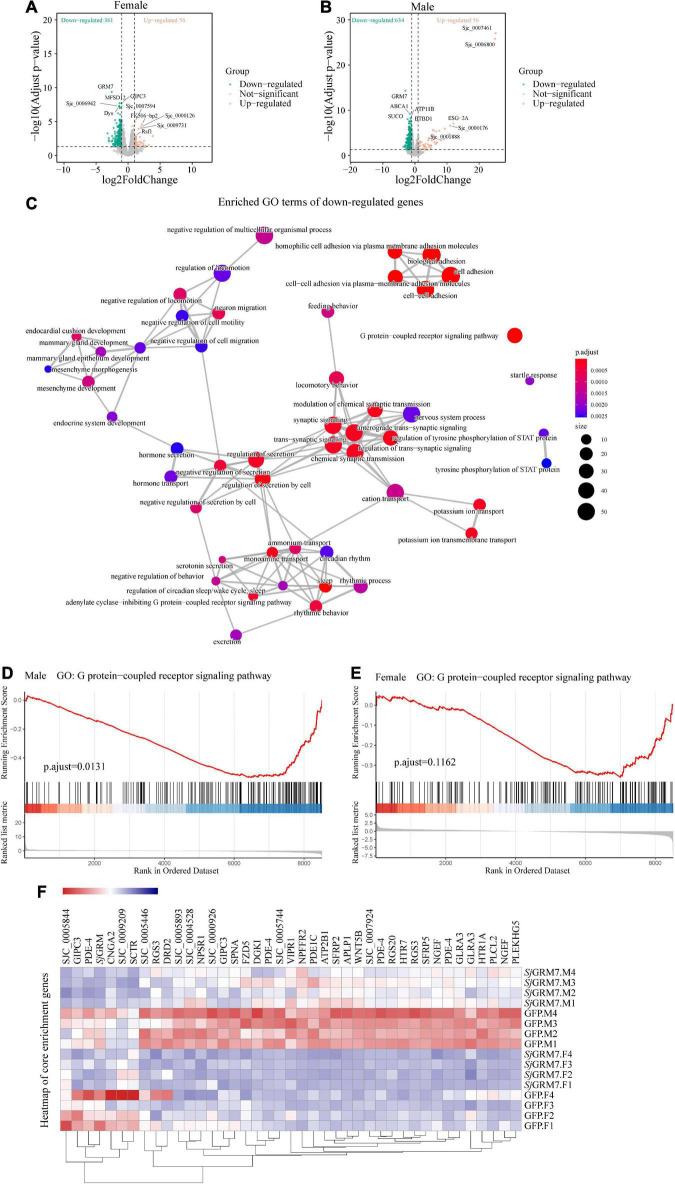
Schistosomiasis is a zoonotic parasitic disease caused by schistosome infection that severely threatens human health. Therapy relies mainly on single drug treatment with praziquantel. Therefore, there is an urgent need to develop alternative medicines. The glutamate neurotransmitter in helminths is involved in many physiological functions by interacting with various cell-surface receptors. However, the roles and detailed regulatory mechanisms of the metabotropic glutamate receptor (mGluR) in the growth and development of Schistosoma japonicum remain poorly understood. In this study, we identified two putative mGluRs in S. japonicum and named them SjGRM7 (Sjc_001309, similar to GRM7) and SjGRM (Sjc_001163, similar to mGluR). Further validation using a calcium mobilization assay showed that SjGRM7 and SjGRM are glutamate-specific. The results of in situ hybridization showed that SjGRM is mainly located in the nerves of both males and gonads of females, and SjGRM7 is principally found in the nerves and gonads of males and females. In a RNA interference experiment, the results showed that SjGRM7 knockdown by double-stranded RNA (dsRNA) in S. japonicum caused edema, chassis detachment, and separation of paired worms in vitro. Furthermore, dsRNA interference of SjGRM7 could significantly affect the development and egg production of male and female worms in vivo and alleviate the host liver granulomas and fibrosis. Finally, we examined the molecular mechanisms underlying the regulatory function of mGluR using RNA sequencing. The data suggest that SjGRM7 propagates its signals through the G protein-coupled receptor signaling pathway to promote nervous system development in S. japonicum. In conclusion, SjGRM7 is a potential target for anti-schistosomiasis. This study enables future research on the mechanisms of action of Schistosomiasis japonica drugs.

Keywords: Schistosoma japonicum; development; double-stranded RNA; liver fibrosis; metabotropic glutamate receptor.


Conflict of interest statement

The authors declare that the research was conducted in the absence of any commercial or financial relationships that could be construed as a potential conflict of interest.

Figures

FIGURE 1
FIGURE 1
Bioinformatic analysis reveals SjGRM7 as a schistosome-specific mGluR. (A) A schematic for bioinformatics and functional analysis of S. japonicum mGluR. (B) mGluR maximum-likelihood tree. mGluRs and GABAB receptors (GABABR) are indicated by the branches and text colors. The text on the right shows further classification. Two S. japonicum mGluRs are highlighted in black. The species used in this analysis are implicated using a three-letter species code, except for S. japonicum (Sjc), S. mansoni (Smp), and Schmidtea mediterranea (SMESG). Phylogenetic reconstruction was performed using the maximum-likelihood method with the WAG + I + G + F model and an ultrafast bootstrap of 1,000 iterations. Bootstrap values are shown at the tree nodes, and protein names are shown at the end of each branch. The human calcium-sensing receptor was used as an outgroup. The scale bar denotes the number of amino acid substitutions per site. (C) Multiple protein alignments of mGluR ligand-binding residues. Representative sequences were chosen for each class with labels on the left. Key residues are colored according to percentage identity. The residue numbers indicated at the top correspond to those in human mGluR1. (D) Schematic depiction of mGluR’s key residues involved in ligand binding. Human mGluR key residues and those of S. japonicum are shown for comparison. As shown in panel (C), the residue and its number corresponded to multiple protein alignments. Residues are colored based on proteins, as shown in the legend. The dashed line indicates the part of the glutamate the residue that interacts with other residues. (E) Protein structure comparisons between the predicted two mGluRs of S. japonicum structures and human mGluRII crystal structures. Different classes corresponded to other protein domains, as shown in the legend. Orange structures are intra-cellular regions, but most have low confidence (pLDDT < 50). Dashed lines in human mGluR2 denote disordered fragments. The binding pockets are shown by black boxes and are zoomed at the bottom right of each structure. Key residues involved in ligand binding are depicted in close-up views using the residue number and three-letter code. (F) SjGRM-expressing HEK293 cells were treated with various amino acid transmitters (L-glutamate, glutamine, GABA, glycine, and aspartate) at 10– 4 M or vehicle (blank). (G) SjGRM7-expressing HEK293 cells were treated with various amino acid transmitters (L-glutamate, glutamine, GABA, glycine, and aspartate) at 10– 4 M or vehicle (blank). (H) SjGRM-expressing HEK293 cells were treated with different concentrations of L-glutamate, and the vector (blank) was plotted in a dose-dependent manner. (I) SjGRM7-expressing HEK293 cells were treated with different concentrations of L-glutamate, and the vector (blank) was plotted in a dose-dependent manner. mGluR and GRM, metabotropic glutamate receptor; HEK293, human embryonic kidney 293T cells, GABA, γ-aminobutyric acid. *P < 0.05, ****P < 0.0001.
FIGURE 2
FIGURE 2
Localization and expression of the two mGluRs in S. japonicum. The top is a flow chart of the samples collected during the different developmental periods and most worms in 14 and 16 dpi are not paired. (A) Expression patterns of SjGRM7 at different time points post-infection. (B) Expression patterns of SjGRM at different time points post-infection. (C) Sagittal confocal section of FISH showing SjGRM7 mRNA enriched in the testes, brain ganglia, longitudinal neuraxis, ventral suckers, and peripheral nerve cells of a male worm (top) and in the ovaries and vitelline glands of a female worm (bottom) (white arrows). (D) Sagittal confocal section of FISH showing SjGRM mRNA enrichment in the testes of male worms (top) and in the ovaries and vitelline glands of female worms (bottom). FISH analysis of the locations of the two S. japonicum mGluRs. Nuclei were stained blue (DAPI), and dig-labeled mGluRs were stained red. Fifteen parasites were used in the five experiments. Specific signals are indicated by white arrows. Scale bar: 500 μm (C,D). FISH, fluorescence in situ hybridization; mGluR and GRM, metabotropic glutamate receptor; DAPI, 4′,6-diamidino-2-phenylindole.
FIGURE 3
FIGURE 3
SjGRM7 is required for normal physiological activity in S. japonicum in vitro. The top is the flow chart of in vitro interference. Adults with good pairing activity were added to the petri dish, dsRNA was added for interference on the first, third, and fifth days, and microscopic observation and photography were carried out on the seventh day. Each plate had six pairs of three replicate wells for each biological experiment with four biological replicates. (A) Observation under the light microscope on the seventh day after dsRNA treatment of the control (left), SjGRM (middle), and SjGRM7 (right) groups. Scale bar: 200 μm. (B) Effect statistics of the control, SjGRM, and SjGRM7 groups after dsRNA treatment, with the statistical indicators of swelling (detachment), no adsorption to the chassis, and unpairing. qPCR was used to detect the mRNA expression of SjGRM7 (C) and SjGRM (D) after treatment with dsRNA. ***P < 0.001, **P < 0.01. mGluR and GRM, metabotropic glutamate receptor; qPCR, reverse transcription polymerase chain reaction; dsRNA, double-stranded RNA.
FIGURE 4
FIGURE 4
Effects of dsRNA-mediated knockdown of SjGRM7 in vivo. The top is a flow chart of in vivo interference. On the 1st, 6th, 10th, 14th, 18th, 22nd, and 26th days after cercariae infection using the abdominal patch method, dsRNA was injected through the tail vein, and the hepatic portal vein was perfused on the 30th day for observation. Worms were continuously treated with 10 μg SjGRM7 and GFP dsRNA in vivo. (A) SjGRM7 transcript relative mRNA levels in the SjGRM7 dsRNA group. (B) Morphological changes in the worms captured at 30 dpi. (C) Comparison of worm numbers between GFP and SjGRM7 dsRNA groups. (D) Comparison of worm length between the GFP and SjGRM7 dsRNA groups. (E) Morphological changes in the gonads of female and male worms were observed by carmine staining. (F) Adult worms from the treatment group were analyzed by confocal laser scanning microscopy. (G) The area of the largest cross-section of the ovary of female worms was measured using ImageJ. (H) The width of the largest cross-section of the vitellarium of female worms was measured using the ImageJ software. O, oocytes; E, eggs; T, testis; GFP, green fluorescent protein; dpi, days post infection; dsRNA, double-stranded RNA; GRM, metabotropic glutamate receptor. Scale-bars: (E) 200 μm; (F) 50 μm. *⁣*⁣**P < 0.0001, **P < 0.01, *P < 0.05.
FIGURE 5
FIGURE 5
SjGRM7 affects oviposition in S. japonicum and alleviates host pathology in vivo. On the 26th, 30th, 34th, and 38th days after abdominal patch infection, dsRNA was injected through the tail vein, and the hepatic portal vein was perfused on the 42nd day. (A) SjGRM7 transcript relative mRNA levels in the SjGRM7 dsRNA group. (B) Morphological changes in worms collected at 42 dpi. (C) Comparison of worm numbers between GFP and SjGRM7 dsRNA groups. (D) Comparison of worm length between the GFP and SjGRM7 dsRNA groups. (E) Morphological changes in the gonads of female and male worms were observed by carmine staining. (F) Gross observations of the mouse liver in the GFP and SjGRM7 dsRNA groups. (G) Liver sections stained with hematoxylin and eosin (H&E) (left) showing egg granulomatous lesions; Masson’s trichrome staining (right); liver fibrosis, granuloma formation, and liver fibrosis from individual eggs were also observed (middle). (H) Eggs per gram comparison between the GFP control and SjGRM7 dsRNA groups. (I) qPCR showed that the mRNA levels of collagen I, collagen III, and α-SMA in the SjGRM7 dsRNA group were significantly lower than those in the GFP control group. (J) Comparison of egg hatchability between GFP and SjGRM7 dsRNA groups. O, oocytes; e, eggs; T, testis. E, 200 μm; F, 10 mm.; G, left and right, 500 μm; middle, 50 μm; GFP, green fluorescent protein; dpi, days post infection; dsRNA, double-stranded RNA; GRM, metabotropic glutamate receptor; qPCR, quantitative polymerase chain reaction; α-SMA, α-smooth muscle actin protein *⁣*⁣**P < 0.0001, ***P < 0.001, **P < 0.01, *P < 0.05.
FIGURE 6
FIGURE 6
Differentially expressed genes (DEGs) of S. japonicum after SjGRM7 RNAi in vitro and gene ontology (GO) analysis. (A) DEG volcano plots in females and males. (B) X-axis: log2-fold change (ds SjGRM7/GFP). Y-axis: log10 (adjusted p-value). Green points represent significantly downregulated genes, and orange points represent significantly upregulated genes. (C) GO term visualization (enrichment calculated using gene-set enrichment analysis, p < 0.05, adjusted for FDR, only shown in genes significantly downregulated after SjGRM7 knockdown). (D) GSEA showed downregulation of the GPCR signaling pathway in SjGRM7 dsRNA group male worms and female worms (E) as compared to GFP controls. (E) Heat map of core enrichment genes in both males and females for the GPCR signaling pathway gene set. (F) The score at the peak of the plot (D,E) is the enrichment score (ES) for this gene set, and genes that appear before or at the peak are defined as core enrichment genes for this gene set. GFP, green fluorescent protein; dsRNA, double-stranded RNA; GRM, metabotropic glutamate receptor; GPCR, G protein-coupled receptor; GSEA, Gene set enrichment analysis; FDR, false discovery rate.

Similar articles

Cited by

References

    1. Afshin A., Sur P. J., Fay K. A., Cornaby L., Murray C. (2019). Health effects of dietary risks in 195 countries, 1990–2017: A systematic analysis for the global burden of disease study 2017. Lancet 393 1958–1972. 10.1016/S0140-6736(19)30041-8 - DOI - PMC - PubMed
    1. Amir S., Ayana J., Isabel B., Liliane S., Newmark P. A., Federica W. M. (2016). GPCRS direct germline development and somatic gonad function in planarians. PLoS Biol. 14:e1002457. 10.1371/journal.pbio.1002457 - DOI - PMC - PubMed
    1. Andrews S. (2013). FastQC: A quality control tool for high throughput sequence data. Available online at: https://www.bioinformatics.babraham.ac.uk/projects/fastqc/ (accessed November 20, 2020).
    1. Bockaert J., Claeysen S., Becamel C., Pinloche S., Dumuis A. (2002). G protein-coupled receptors: Dominant players in cell-cell communication. Int. Rev. Cytol. 212 63–132. 10.1016/S0074-7696(01)12004-8 - DOI - PubMed
    1. Bono M. D., Villu Maricq A. (2005). Neuronal substrates of complex behaviors in C. elegans. Annu. Rev. Neurosci. 28:451. 10.1146/annurev.neuro.27.070203.144259 - DOI - PubMed

LinkOut - more resources