. 2022 Dec 2:13:1071278.
doi: 10.3389/fmicb.2022.1071278. eCollection 2022.

Glutamine potentiates gentamicin to kill lab-evolved gentamicin-resistant and clinically isolated multidrug-resistant Escherichia coli

Affiliations

Glutamine potentiates gentamicin to kill lab-evolved gentamicin-resistant and clinically isolated multidrug-resistant Escherichia coli

Yue-Tao Chen et al. Front Microbiol. .

Abstract

Introduction: Gentamicin is a conventional antibiotic in clinic. However, with the wide use of antibiotics, gentamicin-resistant Escherichia coli (E. coli) is an ever-increasing problem that causes infection in both humans and animals. Thus, it is especially important to restore gentamicin-mediated killing efficacy.

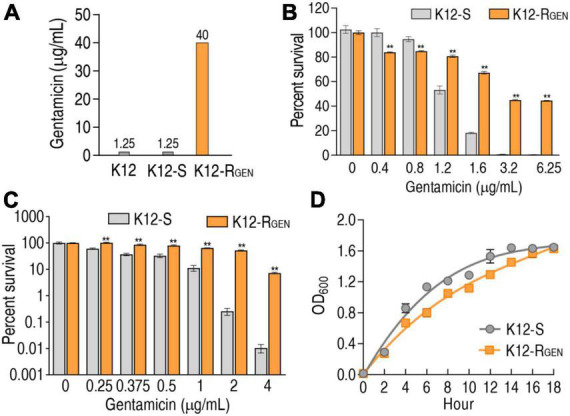
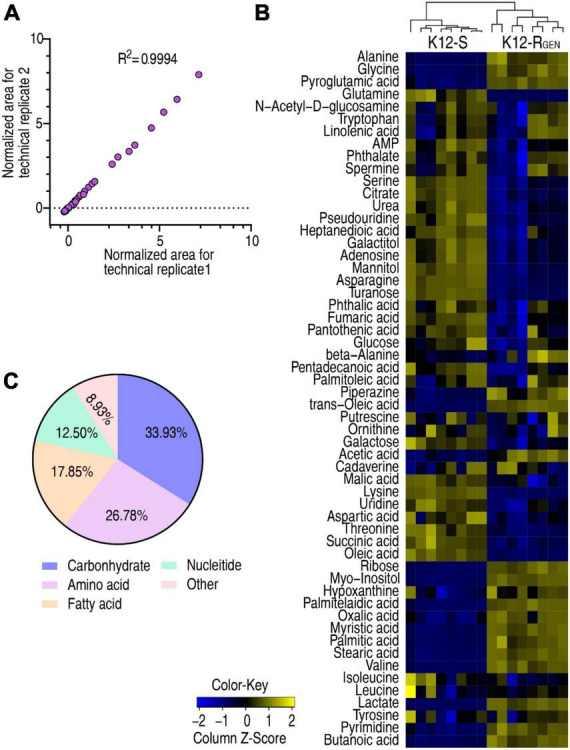
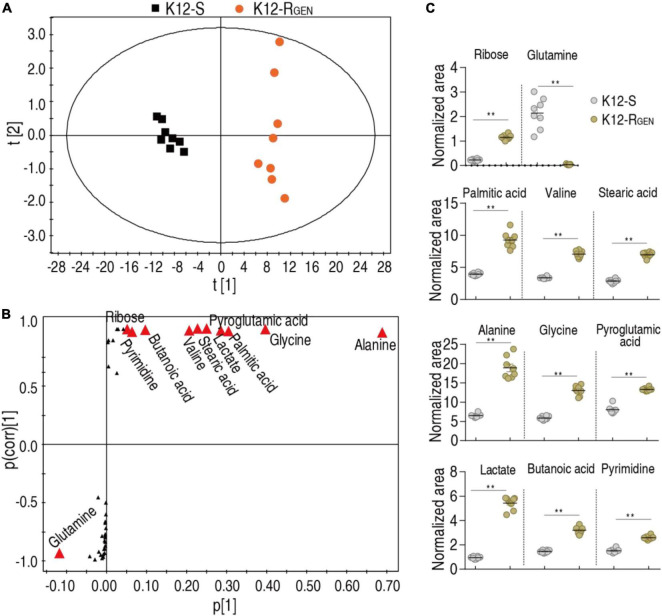
Method: E. coli K12 BW25113 cells were passaged in medium with and without gentamicin and obtain gentamicin-resistant (K12-R GEN ) and control (K12-S) strains, respectively. Then, the metabonomics of the two strains were analyzed by GC-MS approach.

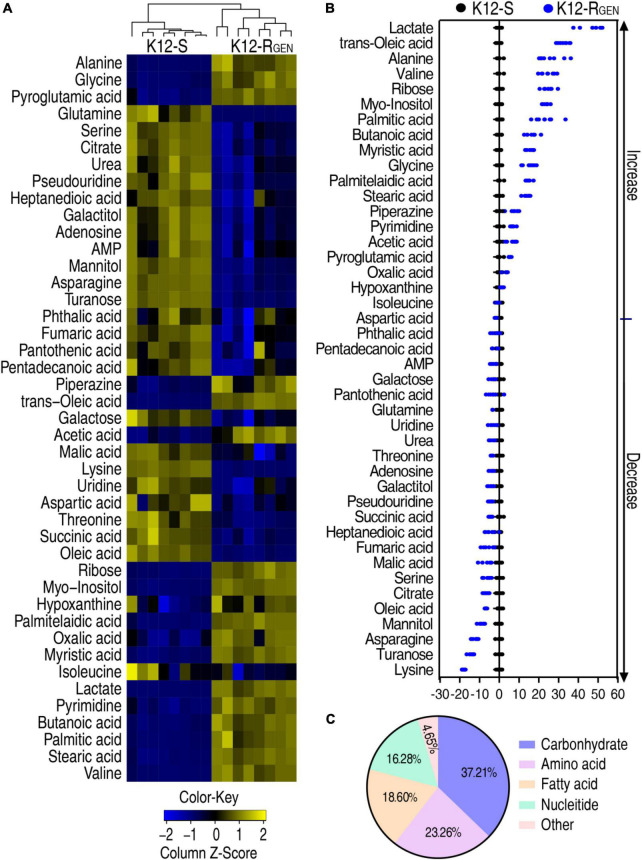
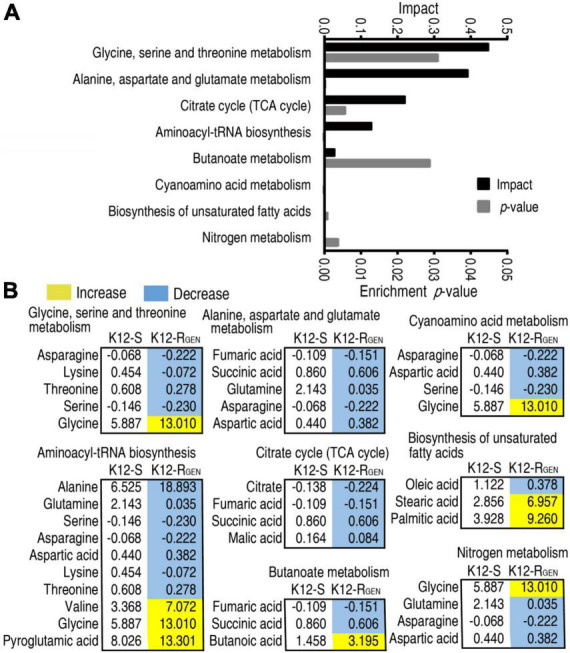
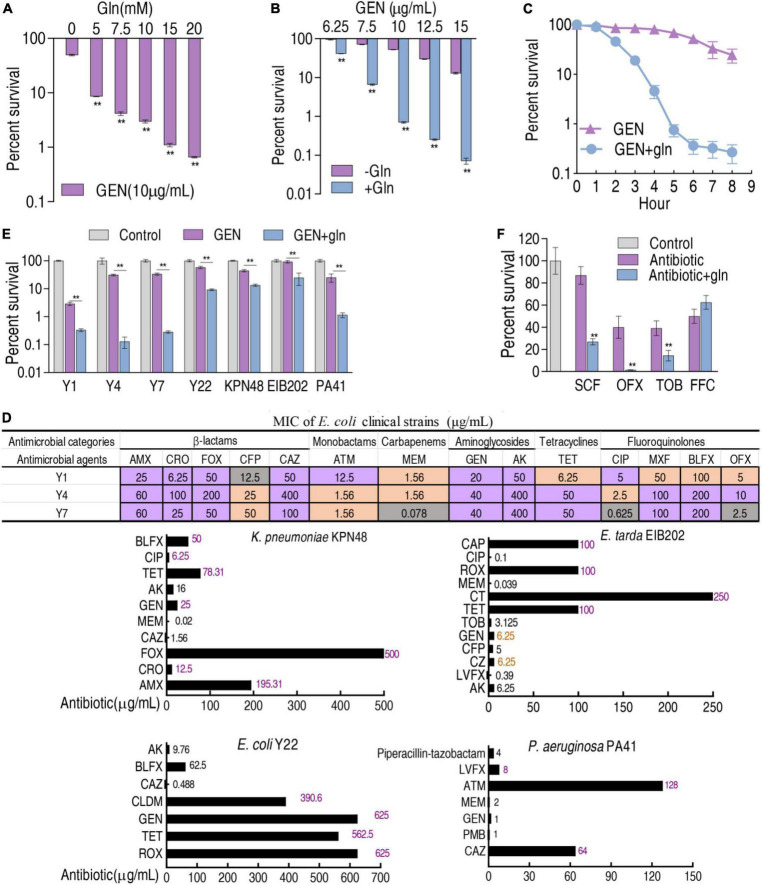
Results: K12-R GEN metabolome was characterized as more decreased metabolites than increased metabolites. Meantime, in the most enriched metabolic pathways, almost all of the metabolites were depressed. Alanine, aspartate and glutamate metabolism and glutamine within the metabolic pathway were identified as the most key metabolic pathways and the most crucial biomarkers, respectively. Exogenous glutamine potentiated gentamicin-mediated killing efficacy in glutamine and gentamicin dose-and time-dependent manners in K12-R GEN . Further experiments showed that glutamine-enabled killing by gentamicin was effective to clinically isolated multidrug-resistant E. coli.

Discussion: These results suggest that glutamine provides an ideal metabolic environment to restore gentamicin-mediated killing, which not only indicates that glutamine is a broad-spectrum antibiotic synergist, but also expands the range of metabolites that contribute to the bactericidal efficiency of aminoglycosides.

Keywords: Escherichia coli; aminoglycoside; antibiotic resistance; glutamine; multidrug resistance; reprogramming metabolomics.


Conflict of interest statement

The authors declare that the research was conducted in the absence of any commercial or financial relationships that could be construed as a potential conflict of interest.

Figures

FIGURE 1
FIGURE 1
Antibiotic resistance phenotypes of K12-RGEN. (A) MIC of K12-RGEN. (B) Survival of K12-RGEN to a lethal dose of gentamicin. (C) Survival capability of K12-RGEN to a non-lethal dose of gentamicin. (D) Growth curve of K12-RGEN. Results are displayed as mean ± SEM and three biological repeats are performed. Significant differences are identified. **p < 0.01.
FIGURE 2
FIGURE 2
Metabolite profiling of K12-RGEN and K12-S. (A) Reproducibility of the metabolomic profiling platform used in the discovery phase. The abundance of metabolites quantified in samples over two technical replicates is shown. The Pearson correlation coefficient between technical replicates varies between 0.9946 and 0.9995. (B) Heat map of unsupervised hierarchical clustering of different metabolites (row). Blue indicates decreases and yellow indicates an increase of the metabolites scaled to the mean and standard deviation of row metabolite level (see color scale). (C) Categories of the differential metabolites. Fifty-six differential abundances of metabolites are searched against in KEGG for categories. The pie chart is generated in Excel 2010 (Microsoft, USA).
FIGURE 3
FIGURE 3
Differential metabolic profiling between K12-RGEN and K12-S. (A) Heat map showing the differential abundance of metabolites. Yellow and blue indicate an increase and decrease of metabolites relative to the median metabolite level of the control, respectively (see color scale). (B) A Z-score plot of differential metabolites based on control. Each point represents one metabolite in one technical repeat and is colored by sample types. (C) Category of these differential abundances of metabolites.
FIGURE 4
FIGURE 4
Pathway enrichment analysis. (A) Pathway enrichment of differential metabolites in K12-RGEN. (B) Integrative analysis of metabolites in significantly enriched pathways. Yellow and light blue indicate increased and decreased metabolites, respectively.
FIGURE 5
FIGURE 5
Identification of crucial metabolites. (A) PCA analysis according to the treatments set. Each dot represents the technical replicate analysis of samples in the plot. (B) S-plot generates from OPLS-DA. Predictive component p [1] and correlation p(corr) [1] differentiate K12-RGEN from K12-S. The dot represents metabolites and candidate biomarkers are highlighted in red. (C) Scatter plot of biomarkers in data (B). Results (C) are displayed as mean ± SEM, and significant differences are identified (**p < 0.01) as determined by a two-tailed Student’s t-test.
FIGURE 6
FIGURE 6
Glutamine promotes gentamicin-mediated killing. (A) Percent survival of K12-RGEN in the presence of the indicated concentration of glutamine and 10 μg gentamicin. (B) Percent survival of K12-RGEN in the presence of the indicated concentration of gentamicin and with or without 20 mM glutamine. (C) Percent survival of K12-RGEN in the indicated incubation time plus 20 mM glutamine and 10 μg gentamicin. The concentration of K12-RGEN in (A–C) was 5 × 10⁸ CFU/ml. (D) MIC measurement of clinically isolated bacterial strains in four to six kinds of antibiotics commonly used in clinical practice. Purple indicates resistant; orange indicates intermediate; dark gray indicates susceptible. For AMX, CRO, FOX, CFP, CAZ, MEM, GEN, CIP, TET, CLDM, PMB, LVFX, CZ, CT, TOB, CAP, and ROX, the standard was according to reference (CLSI, 2012). For ATM, OFX, and AK, the standard was according to reference (Kahlmeter et al., 2006). For MXF and BLFX, susceptible, intermediate, and resistant E. coli were defined as MIC ≤ 0.025, MIC = 0.05, and MIC ≥ 0.1 and MIC ≤ 0.05, MIC = 0.1, and MIC ≥ 0.2, respectively. (E) Percent survival of clinically isolated strains in the presence or absence of gentamicin (Y1 at 2 μg/ml; Y4, Y7 at 2.5 μg/ml; Y22 at 100 μg/ml; K. pneumoniae KPN48 (2 μg/ml); E. tarda EIB202 (2 μg/ml); P. aeruginosa PA41 (1 μg/ml), or in the presence of both gentamicin and 20 mM glutamine. (F) Percent survival of K12-RGEN in the indicated antibiotics (SCF, 10 μg/ml; OFX, 1.5 μg/ml; TOB, 2.5 μg/ml; FFC, 40 μg/ml) with and without 20 mM glutamine. The concentration of clinically isolated strains in (E) and K12-RGEN in (F) was 1 × 10⁶ CFU/ml. Amoxicillin (AMX), Ceftriaxone (CRO), Cefoxitin (FOX), Cefoperazone (CFP), Cefoperazone-sulbactam (SCF), Ceftazidime (CAZ), Aztreonam (ATM), Meropenem (MEM), Gentamicin (GEN), Amikacin (AK), Ciprofloxacin (CIP), Moxifloxacin (MXF), Balofloxacin (BLFX), Ofloxacin (OFX), Tetracycline (TET), Clindamycin (CLDM), Polymyxin B (PMB), Levofloxacin (LVFX), Cefazolin (CZ), Colistin (CT), Tobramycin (TOB), Chloramphenicol (CAP), Roxithromycin (ROX), Florfenicol (FFC). Results are displayed as mean ± SEM and three biological repeats are performed. Significant differences are identified. **p < 0.01.

Similar articles

Cited by

References

    1. Allison K. R., Brynildsen M. P., Collins J. J. (2011). Metabolite-enabled eradication of bacterial persisters by aminoglycosides. Nature 473 216–220. 10.1038/nature10069 - DOI - PMC - PubMed
    1. Appel G. B., Neu H. C. (1978). Gentamicin in 1978. Ann. Intern. Med. 89 528–538. 10.7326/0003-4819-89-4-528 - DOI - PubMed
    1. Breijyeh Z., Jubeh B., Karaman R. (2020). Resistance of Gram-negative bacteria to current antibacterial agents and approaches to resolve it. Molecules 25:1340. 10.3390/molecules25061340 - DOI - PMC - PubMed
    1. Cheng Z. X., Guo C., Chen Z. G., Yang T. C., Zhang J. Y., Wang J., et al. (2019). Glycine, serine and threonine metabolism confounds efficacy of complement-mediated killing. Nat. Commun. 10:3325. 10.1038/s41467-019-11129-5 - DOI - PMC - PubMed
    1. CLSI (2012). Methods for Dilution Antimicrobial Susceptibility Tests for Bacteria that Grow Aerobically; Approved Standard. CLSI document M07-A9, 9 Edn. Wayne, PA: Clinical and Laboratory Standards Institute.