. 2022 Nov 30:13:1065780.
doi: 10.3389/fmicb.2022.1065780. eCollection 2022.

A Chinese herbs complex ameliorates gut microbiota dysbiosis induced by intermittent cold exposure in female rats

Affiliations

A Chinese herbs complex ameliorates gut microbiota dysbiosis induced by intermittent cold exposure in female rats

Lu Jin et al. Front Microbiol. .

Abstract

Cold is a common source of stress in the alpine areas of northern China. It affects the microbial community, resulting in the invasion of pathogenic microorganisms and intestinal diseases. In recent years, studies have reported that Chinese herbal extracts and their fermentation broth have a significant beneficial effect on gut microbiota. This study aimed to investigate the probiotic effect of a self-designed Chinese herbs complex on the gut microbiota of rats exposed to cold. The rats were treated with intermittent cold exposure and Chinese herbs complex for 14 days, and the gut microbiota composition and other parameters were assayed. The 16s ribosomal DNA high-throughput sequencing and analysis confirmed that the Chinese herbs complex positively improved the gut microbiota. We found that cold exposure could lead to significant changes in the composition of gut microbiota, and affect the intestinal barrier and other physiological functions. The relative abundance of some probiotics in the genus such as Roseburia, Parasutterella, and Elusimicrobium in rats treated with Chinese herbs complex was significantly increased. Serum D-lactic acid (D-LA) and lipopolysaccharide (LPS) were increased in the cold exposure group and decreased in the Chinese herbs complex-treated group. Moreover, the Chinese herbs complex significantly increased the protein expression of occludin. In conclusion, the Chinese herbs complex is effective in restoring the gut microbiota caused by cold exposure, improving the function of the intestinal barrier, and may act as a prebiotic in combatting gut dysbiosis.

Keywords: Chinese herbs complex; HPO axis; cold exposure; gut microbiota; intestinal barrier function.


Conflict of interest statement

The authors declare that the research was conducted in the absence of any commercial or financial relationships that could be construed as a potential conflict of interest.

Figures

FIGURE 1
FIGURE 1
Chart of the experimental protocol. Thirty-three 8-week-old female Sprague Dawley (SD) rats (body weight 185.82 ± 5.89 g) were housed at a temperature of 23°C ± 1°C and relative humidity of 40% to 60% with a 12-h light/dark cycle. The animals had free access to tap water and diet for 5 days before being randomly assigned to the control group (C), cold exposure group (CE), and Chinese herbs complex group (CH) based on body weight. The rats in the C and CE groups were intragastrically administrated distilled water, and the rats in the CH group were given Chinese herbs complex by gavage once a day. After the treatment, the cold exposure group and Chinese herbs complex group were exposed to −10°C in a cabin for 4 h every day, and the treatment time lasted for 14 days.
FIGURE 2
FIGURE 2
Changes in body weight and food intake. (A) Body weight; (B) food intake; Data are represented as the mean ± standard deviation (n = 8); C, control group; CE, cold exposure group; CH, Chinese herbs complex group.
FIGURE 3
FIGURE 3
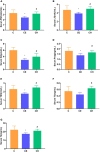
Alterations of the serum hormone levels. (A) FSH, follicle-stimulating hormone; (B) LH, luteinizing hormone; (C) E2, estradiol; (D) Prog, progesterone; (E) TSH, thyroid stimulating hormone; (F) T3, triiodothyronine; (G) T4, thyroxine. Data are represented as the mean ± standard deviation (n = 8). *Means are significantly different vs. C group (*p < 0.05); #Means are significantly different vs. CE group (#p < 0.05); C, control group; CE, cold exposure group; CH, Chinese herbs complex group.
FIGURE 4
FIGURE 4
Changes in histological morphology of the colonic mucosa at the end of the experiment. Histological morphology of the colon (HE, ×200). (A) C group; (B) CE group; (C) CH group; (D) Comparison of the villus length of colonic mucosa among different groups; Data are presented as the mean ± standard deviation (n = 5). The means with different superscript letters are significantly different based on one-way ANOVA with LSD post-hoc analysis; *Means are significantly different vs. C group (*p < 0.05); #Means are significantly different vs. CE group (#p < 0.05); C, control group; CE, cold exposure group; CH, Chinese herbs complex group.
FIGURE 5
FIGURE 5
Serum D-lactic acid (D-LA) and lipopolysaccharide (LPS) levels; (A) Serum D-LA level; (B) Serum LPS level; *Means are significantly different vs. C group (*p < 0.05); #Means are significantly different vs. CE group (#p < 0.05); Data are represented as the mean ± standard deviation (n = 8); C, control group; CE, cold exposure group; CH, Chinese herbs complex group.
FIGURE 6
FIGURE 6
Protein expression of MUC2, E-cadherin, and occludin in the colon of rats treated with Chinese herbs complex for 14 days. (A) Representative images of immunohistochemical staining of MUC2, E-cadherin, and Occludin in colon samples from different experimental groups (scale bar, 250 mm). Data are presented as the mean ± standard deviation (n = 5), analyzed using one-way ANOVA with LSD post-hoc analysis. (B) Western blotting for E-cadherin, MUC2, occludin, and GAPDH; relative quantification of E-cadherin, MUC2 and occludin. Data are presented as the mean ± standard deviation (n = 3). The means with different superscript letters are significantly different based on one-way ANOVA with Dunn-Bonferroni post-hoc analysis; *Means are significantly different vs. C group (*p < 0.05); #Means are significantly different vs. CE group (#p < 0.05); C, control group; CE, cold exposure group; CH, Chinese herbs complex group.
FIGURE 7
FIGURE 7
The diversity of gut microbiota in rats (n = 5); (A–C) diversity indices of microbial communities in fecal samples, box plots showed differences in the microbiome diversity among C, CE, and CH groups in terms of the sobs index, Chao1 index and Shannon indexes; (D) the effects of intermittent cold exposure on the fecal microbial communities; *Means are significantly different vs. C group (*p < 0.05); #Means are significantly different vs. CE group (#p < 0.05); C, control group; CE, cold exposure group; CH, Chinese herbs complex group.
FIGURE 8
FIGURE 8
Relative abundance levels of the gut microbial community. (A) Phylum level; (B) class level; (C) genus level (n = 5); (D) abundance of Barnesiella; (E) abundance of Parasutterella; (F) abundance of Sporobacter; (G) abundance of Roseburia; (H) abundance of Ruminococcus2; (I) abundance of Clostridium_XlVa; *Means are significantly different vs. C group (*p < 0.05); #Means are significantly different vs. CE group (#p < 0.05); C, control group; CE, cold exposure group; CH, Chinese herbs complex group.
FIGURE 9
FIGURE 9
Linear discriminant analysis of the effect size (LEfSe) analysis of the gut microbiota among three groups. (A,B) The taxonomic cladogram was obtained from the LEfSe analysis of gut microbiota in different groups; (C,D) The LDA effect size of more than four was used as a threshold for the LEfSe analysis. C, control group; CE, cold exposure group; CH, Chinese herbs complex group.
FIGURE 10
FIGURE 10
Correlations between the biochemical indicators and the operational taxonomic units (OTUs). The intensity of the color indicates the degree of correlation between the OTU abundance and the biochemical indicator as evaluated by Spearman’s correlation. Significant correlations are indicated with an asterisk (*) in the squares. The OTU taxonomy is listed on the right.

Similar articles

Cited by

References

    1. Adlercreutz H., Pulkkinen M., Hämäläinen E., Korpela J. (1984). Studies on the role of intestinal bacteria in metabolism of synthetic and natural steroid hormones. J. Steroid. Biochem. 20 217–229. 10.1016/0022-4731(84)90208-5 - DOI - PubMed
    1. Atarashi K., Tanoue T., Oshima K., Suda W., Nagano Y., Nishikawa H., et al. (2013). Treg induction by a rationally selected mixture of Clostridia strains from the human microbiota. Nature 500 232–236. 10.1038/nature12331 - DOI - PubMed
    1. Bae J., Park K., Kim Y.-M. (2022). Commensal microbiota and cancer immunotherapy: Harnessing commensal bacteria for cancer therapy. Immune Netw. 22 e3. 10.4110/in.2022.22.e3 - DOI - PMC - PubMed
    1. Cao Y., Shen J., Ran Z. H. (2014). Association between Faecalibacterium prausnitzii reduction and inflammatory bowel disease: A meta-analysis and systematic review of the literature. Gastroent. Res. Pract. 2014:872725. 10.1155/2014/872725 - DOI - PMC - PubMed
    1. Chen K. (2020). Effects of fermented Danggui Buxue decoction on growth performance and intestinal microflora diversity in broilers. Master’s thesis. Beijing: Chinese Academy of Agricultural Sciences.

LinkOut - more resources