

A novel synthesis of two decades of microsatellite studies on European beech reveals decreasing genetic diversity from glacial refugia
- PMID: 36532711
- PMCID: PMC9744708
- DOI: 10.1007/s11295-022-01577-4
A novel synthesis of two decades of microsatellite studies on European beech reveals decreasing genetic diversity from glacial refugia
Abstract
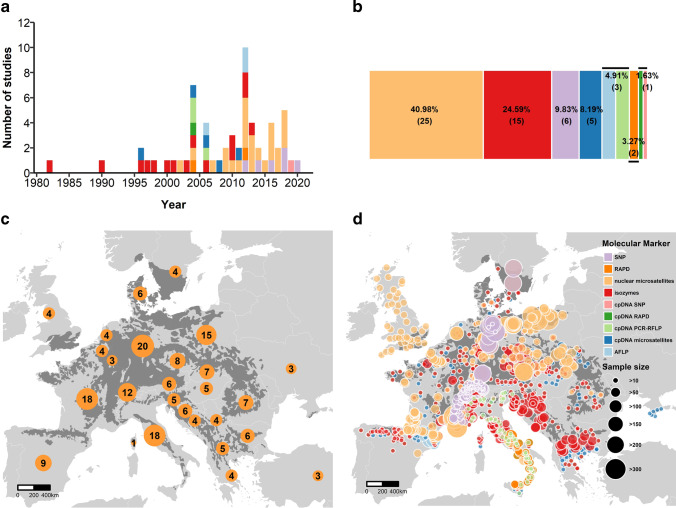
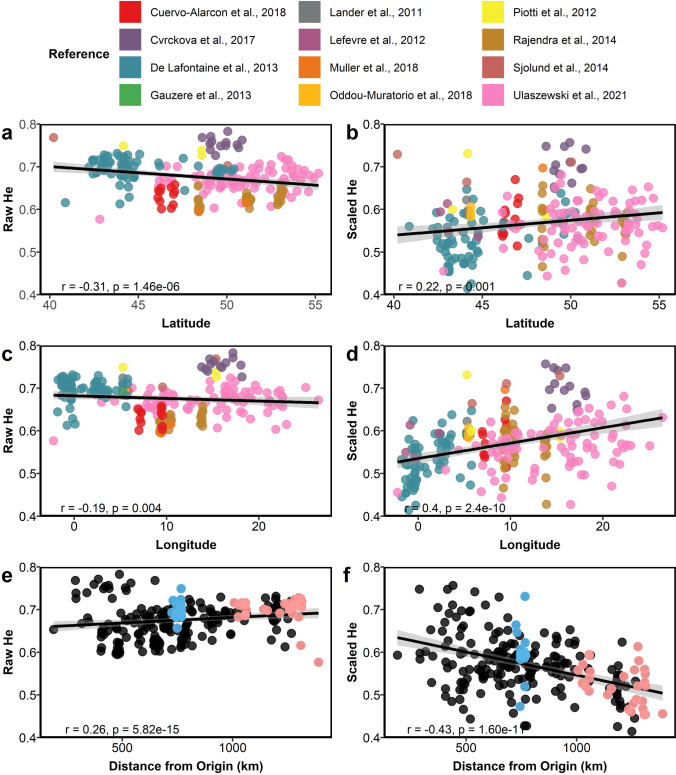
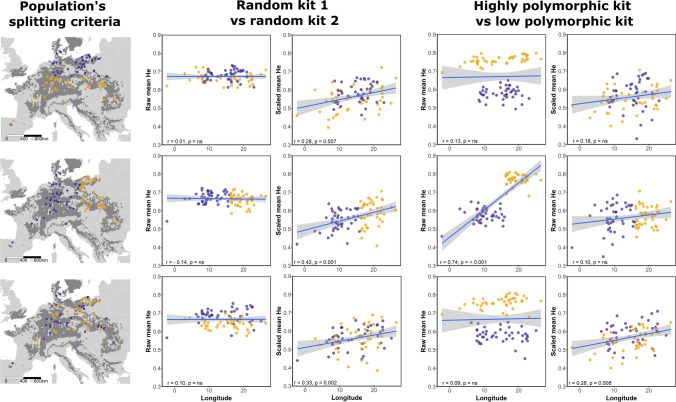
Genetic diversity influences the evolutionary potential of forest trees under changing environmental conditions, thus indirectly the ecosystem services that forests provide. European beech (Fagus sylvatica L.) is a dominant European forest tree species that increasingly suffers from climate change-related die-back. Here, we conducted a systematic literature review of neutral genetic diversity in European beech and created a meta-data set of expected heterozygosity (He) from all past studies providing nuclear microsatellite data. We propose a novel approach, based on population genetic theory and a min-max scaling to make past studies comparable. Using a new microsatellite data set with unprecedented geographic coverage and various re-sampling schemes to mimic common sampling biases, we show the potential and limitations of the scaling approach. The scaled meta-dataset reveals the expected trend of decreasing genetic diversity from glacial refugia across the species range and also supports the hypothesis that different lineages met and admixed north of the European mountain ranges. As a result, we present a map of genetic diversity across the range of European beech which could help to identify seed source populations harboring greater diversity and guide sampling strategies for future genome-wide and functional investigations of genetic variation. Our approach illustrates how to combine information from several nuclear microsatellite data sets to describe patterns of genetic diversity extending beyond the geographic scale or mean number of loci used in each individual study, and thus is a proof-of-concept for synthesizing knowledge from existing studies also in other species.
Supplementary information: The online version contains supplementary material available at 10.1007/s11295-022-01577-4.
Keywords: Chloroplast markers; Demography; Fagus sylvatica; Genetic diversity; Heterozygosity; Microsatellites; Min–max scaling; Nuclear markers; Single nucleotide polymorphisms (SNPs).
© The Author(s) 2022.
Conflict of interest statement
Conflict of interestThe authors declare no competing interests.
Figures


References
-
- Aranda I, Cano FJ, Gasco A, Cochard H, Nardini A, Mancha JA, Lopez R, Sanchez-Gomez D (2015) Variation in photosynthetic performance and hydraulic architecture across European beech (Fagus sylvatica L.) populations supports the case for local adaptation to water stress. Tree Phys 35:34–46 - PubMed
-
- Asuka Y, Tani N, Tsumura Y, Tomaru N (2004) Development and characterization of microsatellite markers for Fagus crenata Blume. Mol Ecol Notes 4(1):101–103. 10.1046/j.1471-8286.2003.00583.x
-
- Barzdajn W, Rzeznik Z. Wstepne wyniki miedzynarodowego doswiadczenia proweniencyjnego z bukiem [Fagus sylvatica L.] serii 1993/1995 w Lesnym Zakladzie Doswiadczalnym. Siemnianice. 2002;146(02):149–64.
Publication types
Grants and funding
LinkOut - more resources
Full Text Sources
Research Materials
Miscellaneous