

Combined metabolomics and network pharmacology to elucidate the mechanisms of Dracorhodin Perchlorate in treating diabetic foot ulcer rats
- PMID: 36532755
- PMCID: PMC9752146
- DOI: 10.3389/fphar.2022.1038656
Combined metabolomics and network pharmacology to elucidate the mechanisms of Dracorhodin Perchlorate in treating diabetic foot ulcer rats
Abstract
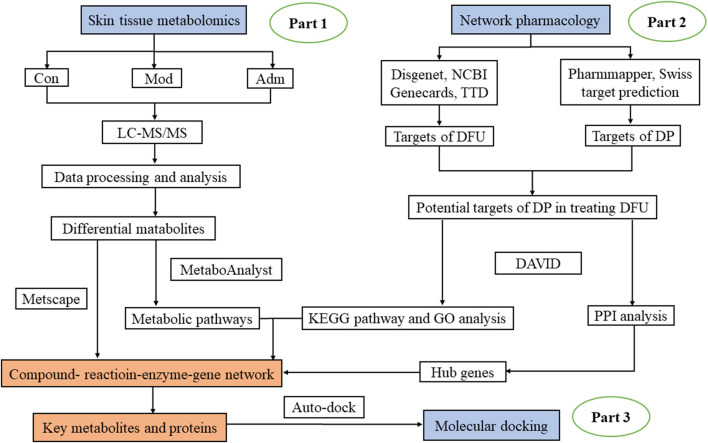
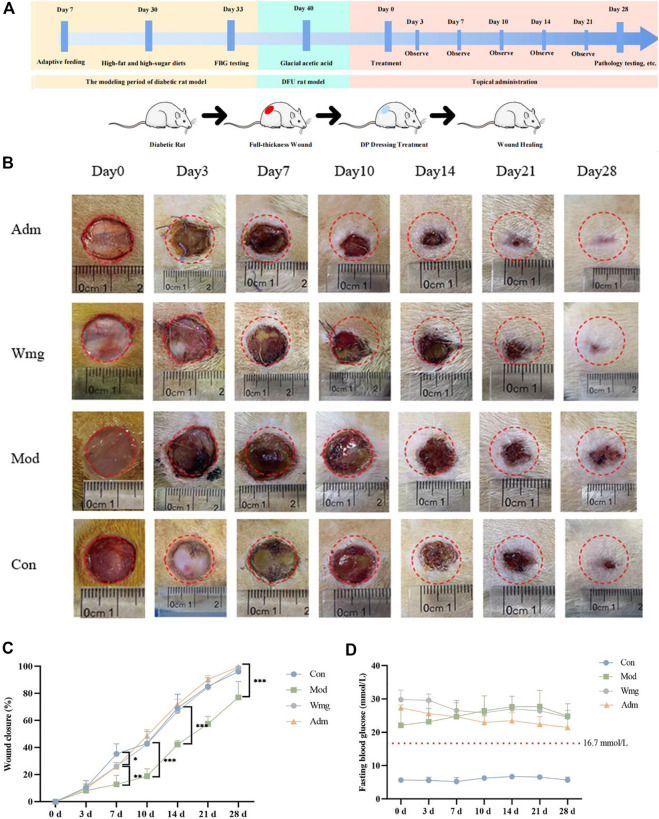
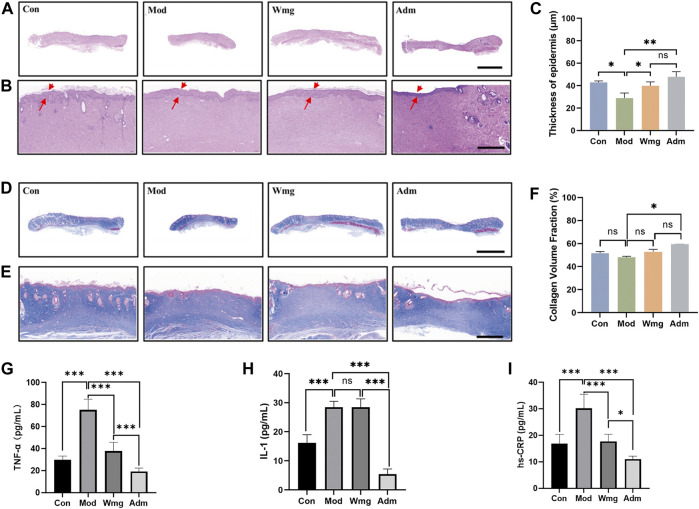
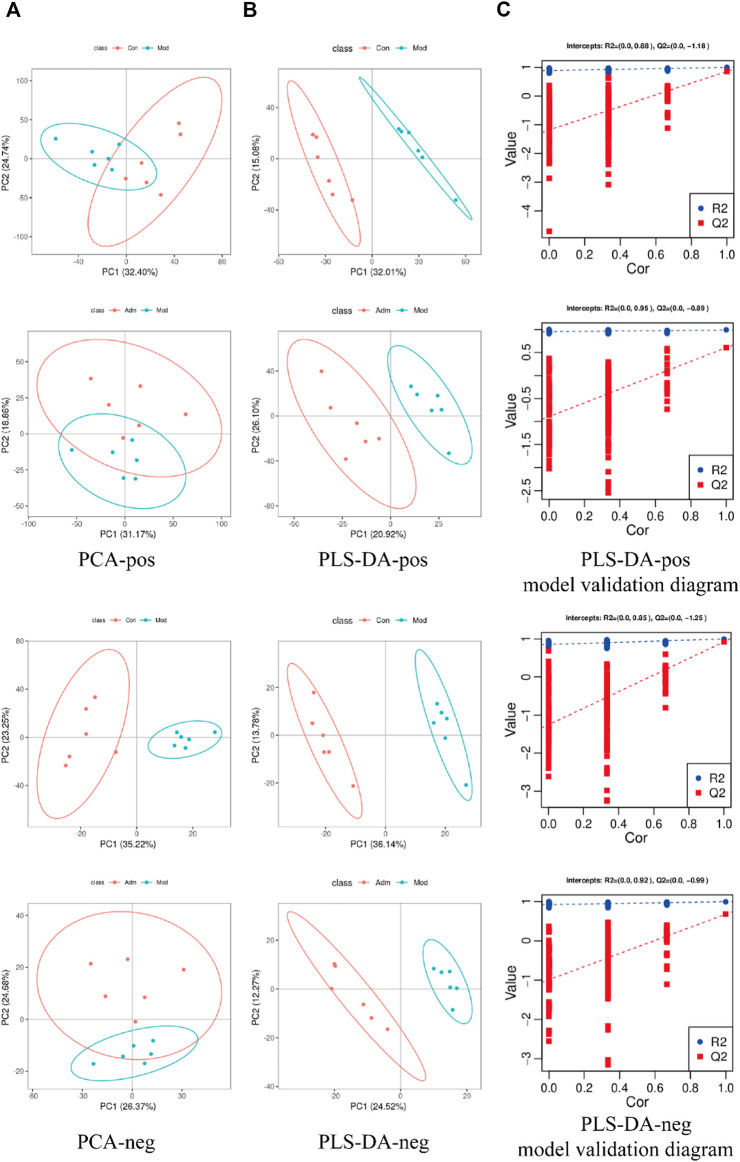
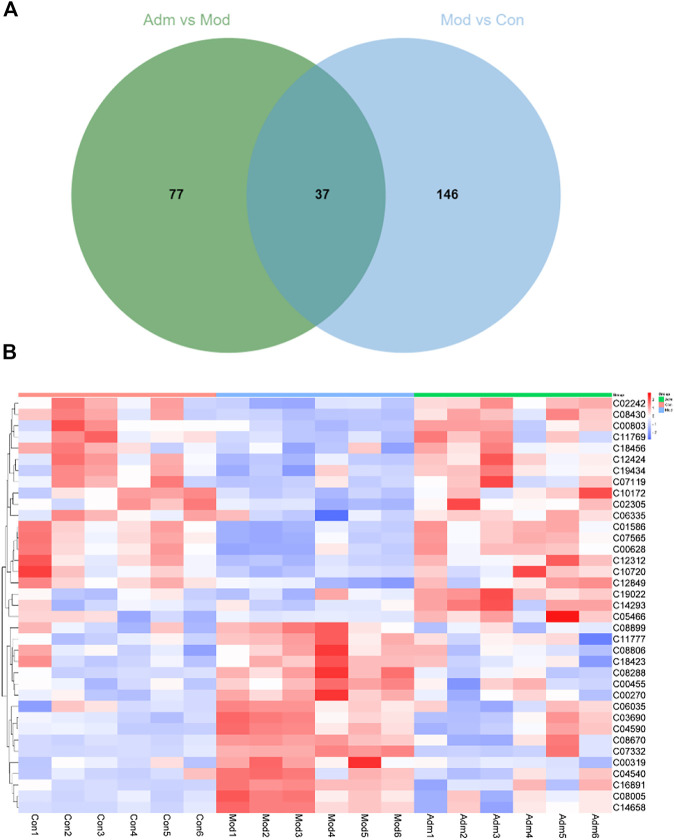
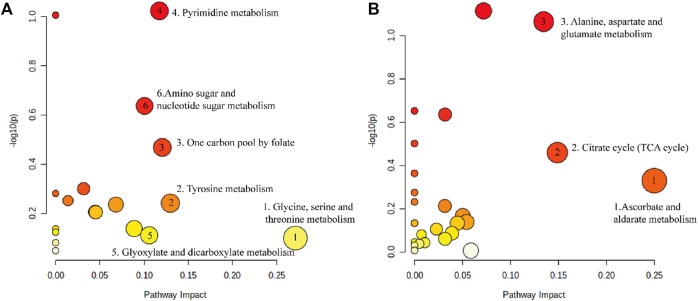
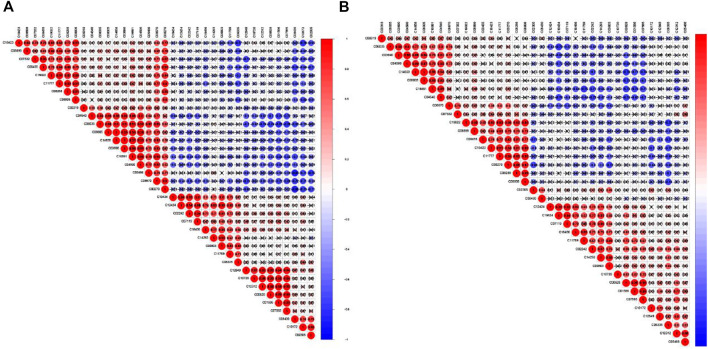
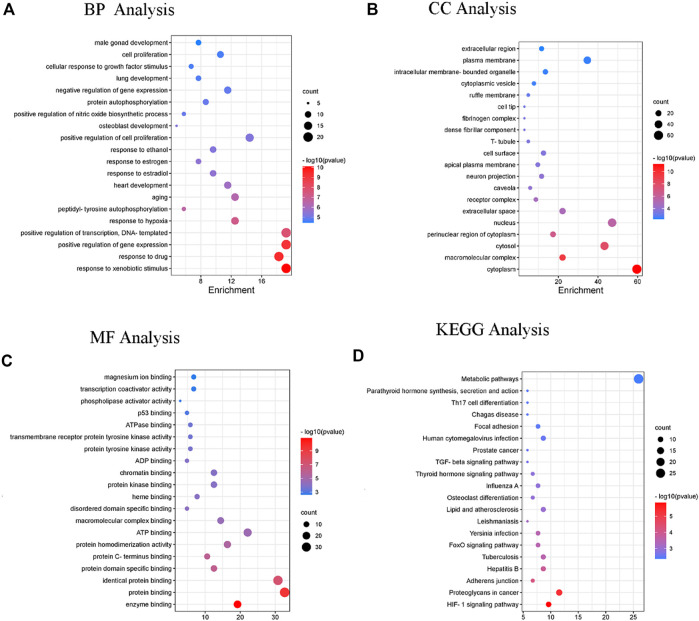
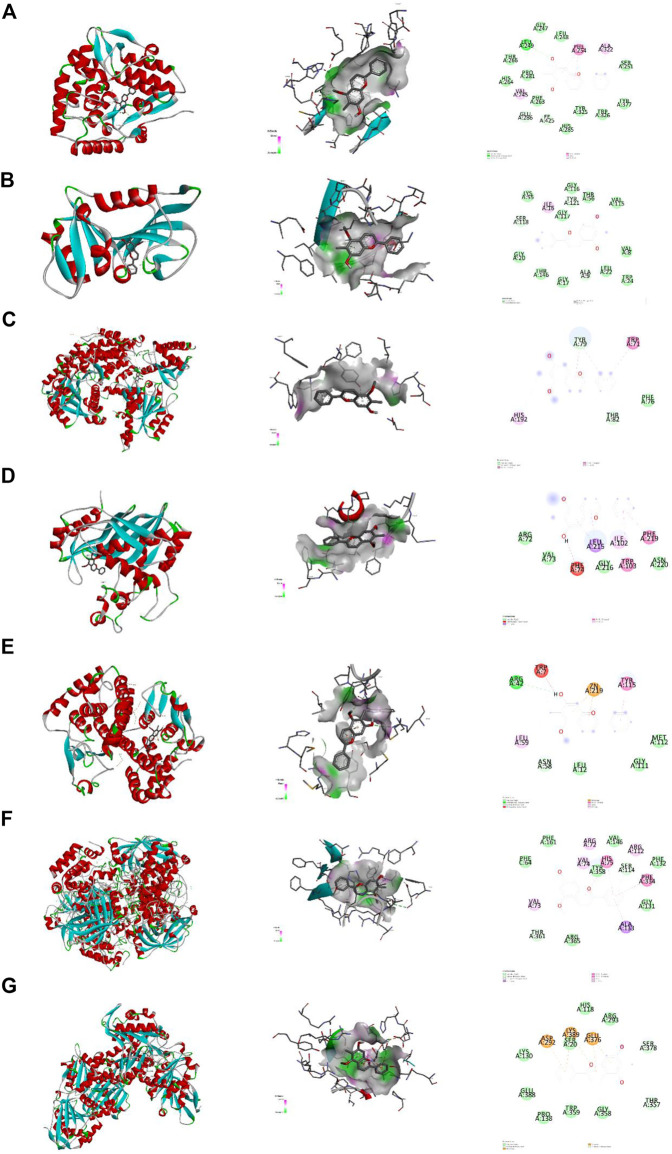
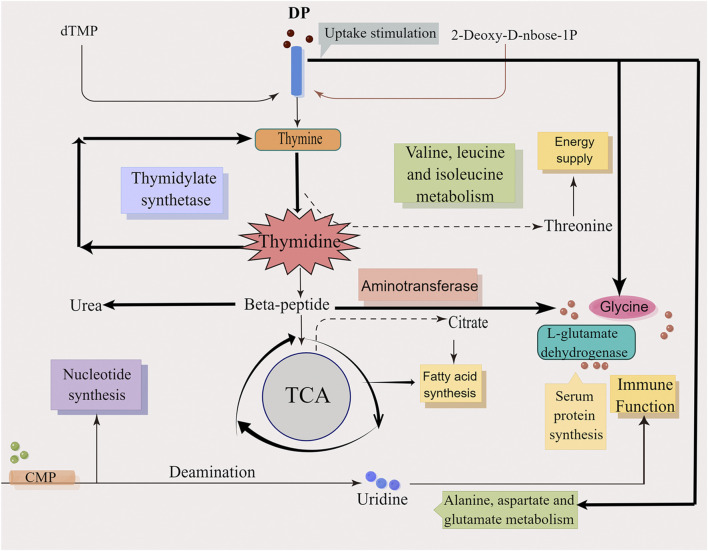
Background: Diabetic foot ulcer (DFU) is a severe chronic complication of diabetes, that can result in disability or death. Dracorhodin Perchlorate (DP) is effective for treating DFU, but the potential mechanisms need to be investigated. We aimed to explore the mechanisms underlying the acceleration of wound healing in DFU by the topical application of DP through the combination of metabolomics and network pharmacology. Methods: A DFU rat model was established, and the rate of ulcer wound healing was assessed. Different metabolites were found in the skin tissues of each group, and MetaboAnalyst was performed to analyse metabolic pathways. The candidate targets of DP in the treatment of DFU were screened using network pharmacology. Cytoscape was applied to construct an integrated network of metabolomics and network pharmacology. Moreover, the obtained hub targets were validated using molecular docking. After the topical application of DP, blood glucose, the rate of wound healing and pro-inflammatory cytokine levels were assessed. Results: The levels of IL-1, hs-CRP and TNF-α of the Adm group were significantly downregulated. A total of 114 metabolites were identified. These could be important to the therapeutic effects of DP in the treatment of DFU. Based on the network pharmacology, seven hub genes were found, which were partially consistent with the metabolomics results. We focused on four hub targets by further integrated analysis, namely, PAH, GSTM1, DHFR and CAT, and the crucial metabolites and pathways. Molecular docking results demonstrated that DP was well combined with the hub targets. Conclusion: Our research based on metabolomics and network pharmacology demonstrated that DP improves wound healing in DFU through multiple targets and pathways, and it can potentially be used for DFU treatment.
Keywords: Dracorhodin Perchlorate; diabetic foot ulcer; mechanisms; metabolomics; network pharmacology.
Copyright © 2022 Deng, Liang, Wang, Hao, Han, Sun, Pan, Li, Wu, Huang, Xue and Chen.
Conflict of interest statement
The authors declare that the research was conducted in the absence of any commercial or financial relationships that could be construed as a potential conflict of interest.
Figures

Similar articles
-
Mechanism of dracorhodin in accelerating diabetic foot ulcer healing via the Nrf2 pathway, a network pharmacology, molecular docking and experimental validation.Sci Rep. 2025 Apr 11;15(1):12492. doi: 10.1038/s41598-025-97831-5. Sci Rep. 2025. PMID: 40216975 Free PMC article.
-
Proteomic analysis of foot ulcer tissue reveals novel potential therapeutic targets of wound healing in diabetic foot ulcers.Comput Biol Med. 2023 Jun;159:106858. doi: 10.1016/j.compbiomed.2023.106858. Epub 2023 Apr 13. Comput Biol Med. 2023. PMID: 37087778
-
In vivo evaluation and mechanism prediction of anti-diabetic foot ulcer based on component analysis of Ruyi Jinhuang powder.World J Diabetes. 2022 Aug 15;13(8):622-642. doi: 10.4239/wjd.v13.i8.622. World J Diabetes. 2022. PMID: 36159224 Free PMC article.
-
Treatment Strategies Against Diabetic Foot Ulcer: Success so Far and the Road Ahead.Curr Diabetes Rev. 2021;17(4):421-436. doi: 10.2174/1573399816999201102125537. Curr Diabetes Rev. 2021. PMID: 33143613 Review.
-
Stem and Somatic Cell Monotherapy for the Treatment of Diabetic Foot Ulcers: Review of Clinical Studies and Mechanisms of Action.Stem Cell Rev Rep. 2022 Aug;18(6):1974-1985. doi: 10.1007/s12015-022-10379-z. Epub 2022 Apr 27. Stem Cell Rev Rep. 2022. PMID: 35476187 Review.
Cited by
-
Bushen Huoxue formula for the treatment of diminished ovarian reserve: A combined metabolomics and integrated network pharmacology analysis.Heliyon. 2023 Sep 13;9(9):e20104. doi: 10.1016/j.heliyon.2023.e20104. eCollection 2023 Sep. Heliyon. 2023. PMID: 37809906 Free PMC article.
-
Multi-omics association study integrating GWAS and pQTL data revealed MIP-1α as a potential drug target for erectile dysfunction.Front Pharmacol. 2024 Nov 1;15:1495970. doi: 10.3389/fphar.2024.1495970. eCollection 2024. Front Pharmacol. 2024. PMID: 39555095 Free PMC article.
-
Exploring the Association Between Human Blood Metabolites and Autism Spectrum Disorder Risk: A Bidirectional Mendelian Randomization Study.Health Sci Rep. 2025 Mar 3;8(3):e70528. doi: 10.1002/hsr2.70528. eCollection 2025 Mar. Health Sci Rep. 2025. PMID: 40041792 Free PMC article.
-
Mechanisms of Huhuang decoction in treating diabetic wounds: a network pharmacological and experimental study.Int J Med Sci. 2025 Mar 10;22(8):1811-1824. doi: 10.7150/ijms.108187. eCollection 2025. Int J Med Sci. 2025. PMID: 40225864 Free PMC article.
-
Mechanism of dracorhodin in accelerating diabetic foot ulcer healing via the Nrf2 pathway, a network pharmacology, molecular docking and experimental validation.Sci Rep. 2025 Apr 11;15(1):12492. doi: 10.1038/s41598-025-97831-5. Sci Rep. 2025. PMID: 40216975 Free PMC article.
References
-
- Asha M. K., Debraj D., Prashanth D., Edwin J. R., Srikanth H. S., Muruganantham N., et al. (2013). In vitro anti-Helicobacter pylori activity of a flavonoid rich extract of Glycyrrhiza glabra and its probable mechanisms of action. J. Ethnopharmacol. 145 (2), 581–586. 10.1016/j.jep.2012.11.033 - DOI - PubMed
LinkOut - more resources
Full Text Sources
Research Materials
Miscellaneous